|
Dr. Gagandeep Kaur Associate Professor Chandigarh University NH-95 Ludhiana Highway ,Gharuan (Mohali)- 140413,Punjab( India) Contact No. 91-9465043568 Drgagandeepkaur.1982@gmail.com |
Ms. Priyanka Panday Research Scholar Chandigarh University NH-95 Ludhiana Highway ,Gharuan (Mohali)- 140413,Punjab( India) Contact No: 91-7351814209 Priyanka.usb@cumail.in |
Bani Grewal Chandigarh University Chandigarh University NH-95 Ludhiana Highway ,Gharuan (Mohali)- 140413,Punjab( India) Banigrewal07@gmail.com |
Military rations management must deal with constraints far beyond those encountered in civilian food science industry. Operational rations must meet stringent shelf life requirements in order to be useful to an expeditionary force. Weight and volume are at an absolute premium for rations that may be in a military transport plane one day, air dropped the next and on a war fighter’s back soon after. This is particularly true in the Indian scenario as Indian Armed Forces operate in some of the most adverse environmental conditions in the world. This paper focuses on the inventory management of essential supplies for the Indian Army, the scope of which is restricted to food supplies and FMCG (Fast Moving Consumer Goods). However, the approach and models used in this paper can be used for inventory management of other commodities managed by Army Service Corp (ASC).
Keywords: ABC Analysis, Descriptive Analytics, Demand Forecasting, EOQ, Excel Solver, IBM Cognos Insight Inventory Management, Multidimensional analysis, OLAP, Prescriptive Analytics, Trend Analysis, Transportation Problem.
It is necessary to hold inventory to meet the Defense services requirement uninterruptedly, despite demand and supply side variability. Purchasing costs, ordering costs, inventory carrying costs, stock-out costs, costs of quality, and shrinkage costs make holding of inventory a very costly proposition. Nevertheless, it is crucial for the Armed Forces to carry the right amount of inventory, for peace time operations and have enough safety stock to deal with mission critical situations. Army Service Corp (ASC) of the Indian Army, is primarily responsible for provisioning, procurement and distribution of supplies, transport, Fuel Oils And Lubricants (FOL), hygiene chemicals and miscellaneous items to Army, Air Force and where required to Navy and other Para Military forces. The operation of mechanical transport except first line transport and the provision and operation of animal transport is also one of the major responsibilities of the ASC. The Directorate General of Supplies and Transport, which is the apex organization of ASC, is a major nodal point for Army budget expenditure. The provisioning and training of clerks and catering staff for whole Army are also the responsibilities of ASC.
Singh, Shukla, Singh and Prasad (2008) has examined the adequacy of the existing ration scales of the Armed Forces personnel stationed under different terrain conditions of the country as well as recruits at various training centers using experimental research. The study clearly indicates that the present ration scales for the Service personnel, both in plains and at high altitudes is adequate with respect to their nutrient density. Attrey and Rao (2013) has examined the effect of food technology research on Armies deployed in critical zones and has suggested food that increases the cognitive ability of soldiers in action. Viswanathan , Prasad, Ramanuja and Narayanan (1991) has performed evaluation of low energy pack ration by short term feeding to soldiers. The experimental research was found to provide favorable results in terms of cognitive ability and nutrition content. Premavalli (2000) examined convenience food for Defence Force based on traditional Indian food. The packaging and shelf life aspects were examined in detail. Malhotra, Chandra, Rai, Venkataswam and Sridharan (1976) examined the relationship between food intake and energy expenditure of Indian troops in training. Malhotra, Chandra and Sridharan (1976) examined dietary intake and energy requirement of Indian submariners in tropical waters. The energy requirement of the Indian crew of a conventional submarino was assessed by the actual food intake and energy expenditure during exercises in tropical waters, for a period of 15 days in two phases. Sachidhanandam, Singh, Sharma, Salhan and Ray (2010) examined Plasma response during high altitude stress with respect to effect of age and ethnicity. Bhattacharya (2015) presented a historical exploration of Indian diets and a possible link to insulin resistance syndrome. Bertrandt, Kłos, Waszkowski, Nowicki, Pytlak, Stezycka and Gazdzinska (2014) examined copper content in daily food rations planned and served to students from selected military academies and soldiers doing compulsory military service in the Polish army. Schneeman (1987) examined the effect of soluble versus insoluble fiber on different physiological responses. Ramanuja, Susheela, Valli, Sarma, Rao, Rao, and Vijayaraghavan (1967) examined the effect of proximate and mineral composition of some processed military rations. Viswanathan, Prasad, and Siddalingaswamy (1997) studied the effect of short term energy and protein restriction on tissue and body using experimental research on rats. Malhotra, Rai, Sridharan and Bhaskaran (1970) studied the rationalization of Army ration scale for peace and field areas. Rai, Sridharan, Swamy, Mukherjee, Radhakrishnan, Kumaria and Sampat (1983) studied the effect of repeated strenuous exercise under low energy intake on physical performance. Mathur, Ramanatha and Bhatia (1972) studied the shelf life and packaging requirements of dehydrated traditional Indian food. Cecil and Woodroof (1962) studied the long-term storage of military rations with respect to different product categories. Lakins, Echeverry, Alvarado, Brooks, Brashears and Brashears. M (2008) examined the quality of mold growth on white enriched bread for military rations following directional microwave treatment. Cline and Highland (1985) examined the survival, reproduction, and development of seven species of stored product insects on the various food components of lightweight, high-density, prototype military rations. Wilson, Nghiem, Summers, Carter and Harper (2013) performed a nutritional analysis of New Zealand military food rations at Gallipoli in 1915 and likely contribution to scurvy and other nutrient deficiency disorders. King, Fridlund and Askew (1993) studied nutrition issues of military women. Froio (2005) examined developments in high barrier non-foil packaging structures for military rations. Wenkam (1989) studied validity of self-estimated and weighed dietary data for assessment of military rations. The SIPRI Milex data is used to compare the military expenditure of India and its neighbors. Deuster (1997) examines patterns and risk factors for exercise related injuries in women from a military perspective. King (1994) examines nutritional intake of female soldiers during the US Army basic combat training
The objectives of the study are as follows.
1. To create statistical demand forecasting models to forecast demand, reduce inventory           carrying cost and cost due to spoilage.
2. To optimize the transportation model to minimize cost using production operation management models.
3. To supplement the VED analysis currently being done with EOQ and ABC models to optimize usage of warehouse space and reduce opportunity cost.
1.	Ho1: There is no effect on total cost of inventory management by the use of statistical demand forecasting models.
      H11: There is reduction in total cost of inventory management by the use of statistical   demand forecasting models.
2.	H02: There is no effect on cost of transportation by the use of production operation management models.
      H12: There is reduction in cost of transportation by the use of production operation management models
3.	H03: There is no effect on total cost of inventory management by supplementing VED analysis with EOQ and ABC analysis.
     H13: There is reduction in total cost of inventory management by supplementing VED analysis with EOQ and ABC analysis.
Locale of the study involves Indian Army regiments deployed in peace stations in India as well as in the border areas involving different geographic terrains. However details of regiments are not divulged for security reasons.
Multistage sampling technique is used. In the first stage, cluster sampling is used to divide the geographical area into clusters called regions. In the second stage, stratified sampling is used to divide the regions into provinces. Basically there are 2 types of strata, peace stations and critical zones. Critical zones include but are not restricted to border areas only. In the third stage, random sampling technique is used to capture the inventory requirements of regiments in peace stations and critical zones. The names and details of regions (clusters), provinces (stratas of peace stations and critical zones) and regiments (random samples) are masked in the data for security reasons.
Data collection is done from government datasets and from past experimental research conducted by DRDO with respect to military ration requirements. The data is quantitative in nature. Data is divided into 2 primary areas – ration requirements in peace stations and ration requirements in critical zones. Exploratory data analysis and multidimensional analysis is done to further break down the critical components that effect ration requirements such as urgency of ration delivery, mode of transportation used based on the geographical terrain, seasonal requirements, size of the regiment which is proportional to number of strata within a cluster and other operational requirements such as Meal Ready to Eat. Meal Ready to Eat must meet operational requirements in critical zones such as low volume, ready to eat, high nutrition content, should not induce sleep and increase cognitive ability and should have long shelf life. All data analysis is supported by facts from review of literature with respect to military operations.
Descriptive analytics is used to describe the data and understand what happened in the past. Cognos Insight is used to perform multidimensional analysis on product, time, cost, supply and demand dimensions. Cognos Insight is also used to perform seasonal trend analysis amongst the various product categories. The percentage of spending on Defence by the Indian Government is compared with the expenditure on Defence of other countries. The per capita expenditure as well as the expenditure as a percentage of GDP (Gross Domestic Product) is analyzed using Cognos Insight. Predictive analytics is used to predict the future. It is also used to draw inferences about the population from samples based on Central Limit Theorem. SPSS is used to perform correlation analysis. To check whether the correlation occurred by chance or whether it actually exists in the data Chi Square test is carried out in SPSS. The predictive analysis is done using Multiple Linear Regression (MLR) to predict demand. Analysis of variance is carried out using ANOVA to compare the mean of military expenditure as a percentage of government spending, amongst India and its neighbors. Customized cross functional charts are used in Cognos Insight and SPSS to present the results based on the outcome of the statistical tests. Prescriptive analytics is used to optimize business models to minimize cost and maximize profit. Microsoft Excel is used to develop the various transportation models using macros and Excel solver and compare the costs associated with them. Excel is also used to perform ABC analysis and EOQ computations.
Descriptive analytics is used to describe the data and understand what happened in the past. Multidimensional cube analysis is performed using Cognos Insight, on entities.
In peace stations, the food supplies and FMCG goods are subsidized for the officers and troops. One would be inclined to believe that the most popular product that generates maximum sales revenue would also be the most profitable. But this is not the case as shown below (Figure 1).
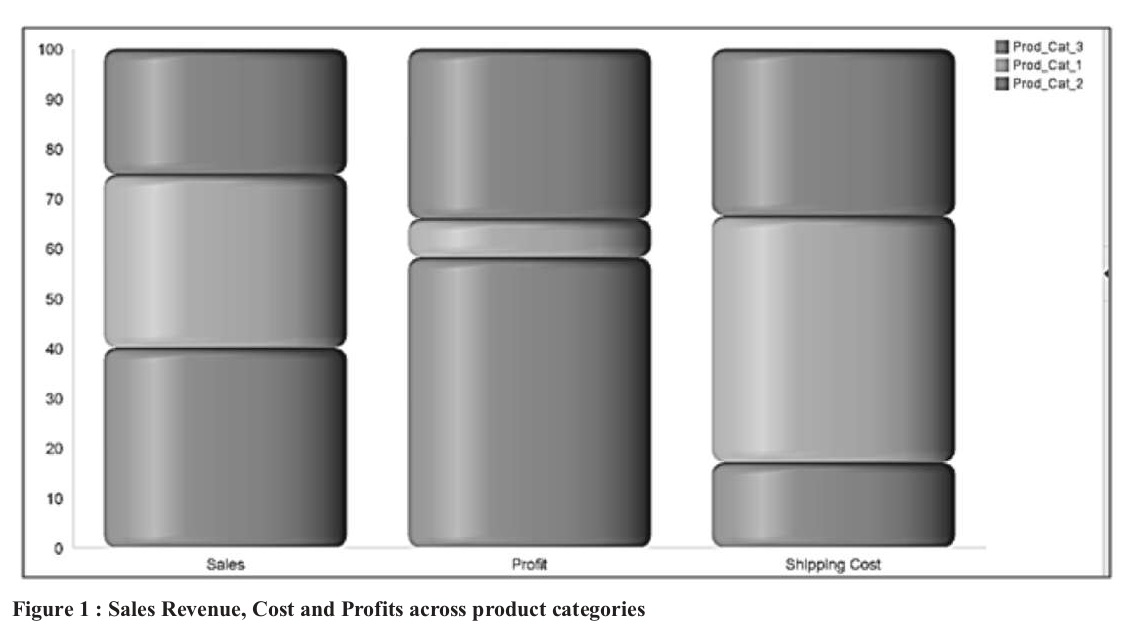
Product category 1, is the second largest revenue generator but is the least profitable. This is because the shipping cost associated with product category 1 is significantly high and severely impacts its profit margins compared to product category 3.

The graph above shows that product categories 2 and 3 are shipped by air even when the order priority is not specified or it is a low or medium priority order. Shipping cost for these product categories can be brought down by delivering low priority orders using delivery trucks instead of shipping by air.
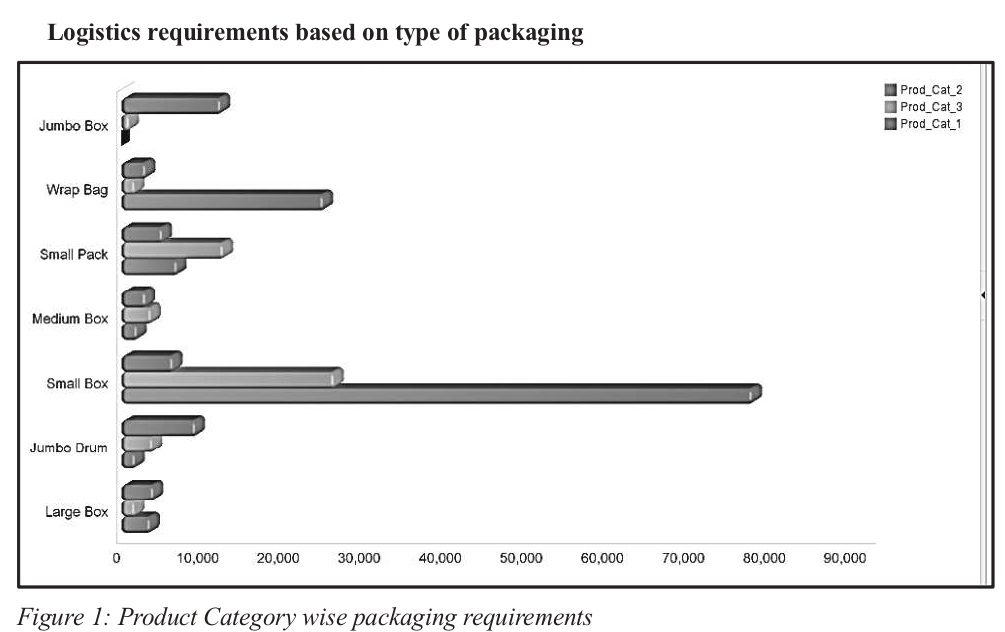
It can be observed from the graph that product category 2 places minimum burden on logistics requirements as it can be easily packed into small boxes and wraps.

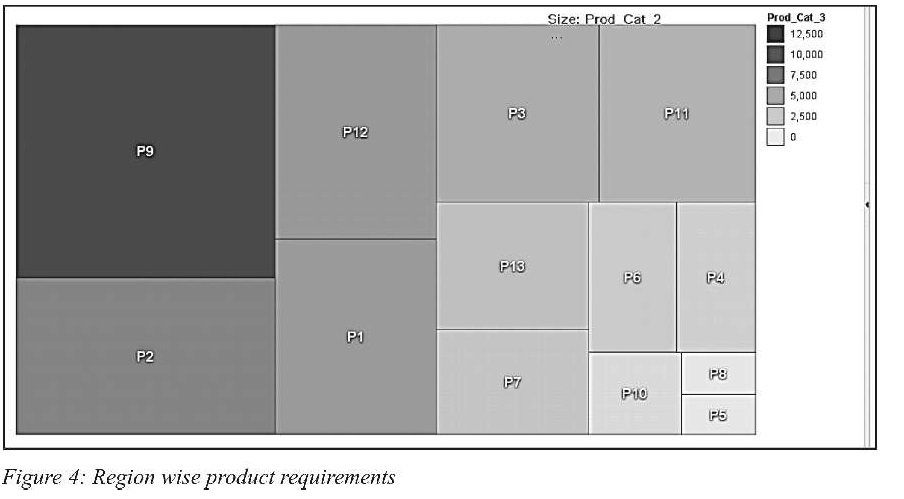
It can be observed that product category 2, that places least burden on logistics in terms of weight and volume, has the highest demand in province 9 followed by province 2, province 12 and province 1 in descending order. These provinces thus are most likely critical zones. The least requirement for product category 2 is in province 8 and province 5. This most likely implies that these are peace stations. The overall demand remains highest for product category 1. This implies that product category 1 is vital to sustain operations under all conditions.

It can be observed from the above graph that product category 1 has peak demand in quarter 3 and quarter 4. Product category 2 has peak demand in quarter 4 and quarter 1. This implies that products that are not required throughout the year can be procured and transported only during the seasons or quarters when they are required. This process is called Just In Time inventory management technique. This will not only reduce the warehouse cost considerably, but will also bring down the logistics cost.

The graph shows that the highest demand for product category 2 is in province 9 by customer segment 2 and customer segment 3. From Figure 3, product category 2 places minimum burden on the logistics as it can be easily packaged into small wraps and boxes. From Figure 4, province 9 is a critical zone. Thus segment 2 and segment 3 are most likely regiments deployed in critical zones that require supplies that are light weight and place minimum burden on the logistics.
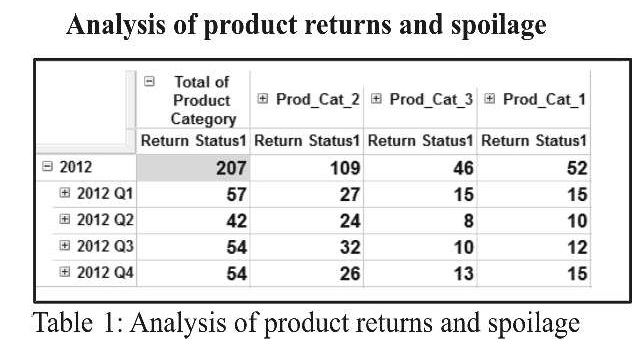
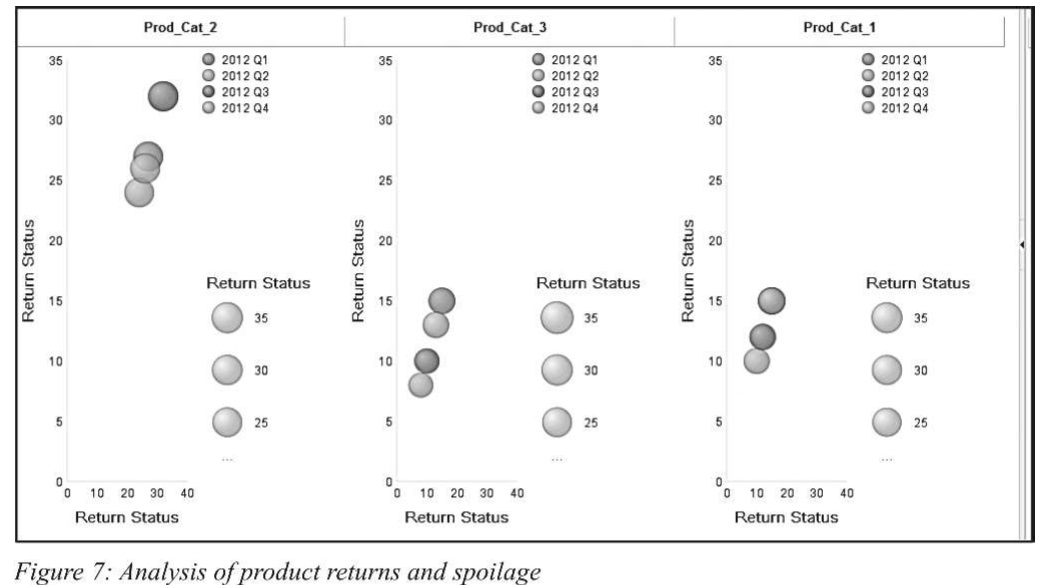
It can be observed that product category 2, has the highest returns in quarter 3. This is because from figure 5, the peak demand for product category 2 is in quarter 1 and quarter 4. Thus the spoilt or surplus products are returned in quarter 3. This cost due to spoilage can be considerably reduced using Just In Time inventory management technique
The graph below shows the military expenditure of countries as a percentage of Gross Domestic Product (GDP) for China, Bangladesh, India, Nepal, Pakistan and Sri Lanka from 1988 to 2015 as per the SIPRI Milex data source.
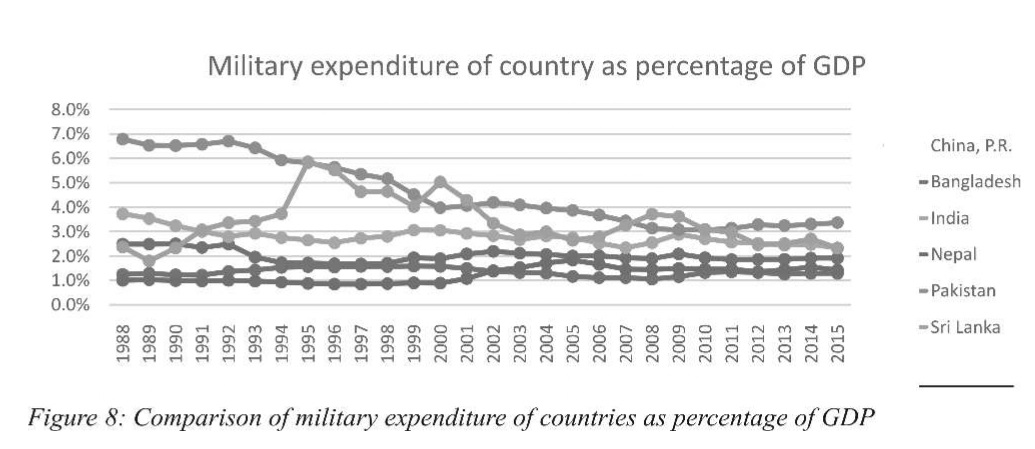
From the graph above it can be seen that the military expenditure of Pakistan as a percentage of GDP has decreased significantly. However the military expenditure of India as a percentage of GDP is still lower than Pakistan and almost the same as China.
The graph below shows the military expenditure per capita by country for China, Bangladesh, India, Nepal, Pakistan and Sri Lanka from 1988 to 2015 as per the SIPRI Milex data source
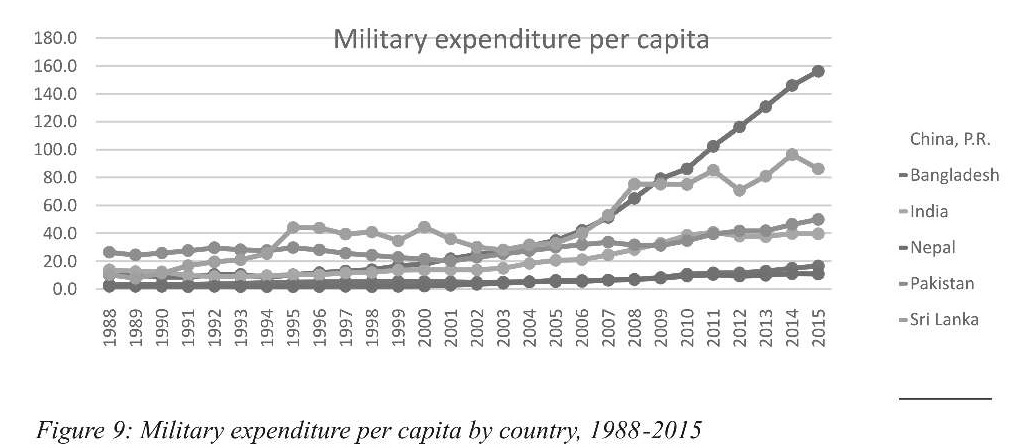
From the graph above it can be seen that the military expenditure of China per capita has increased significantly whereas the military expenditure of India per capita has shown a marginal increase.
The graph below shows the military expenditure by country as percentage of Government spending, for China, Bangladesh, India, Nepal, Pakistan and Sri Lanka from 1988 to 2015 as per the SIPRI Milex data source
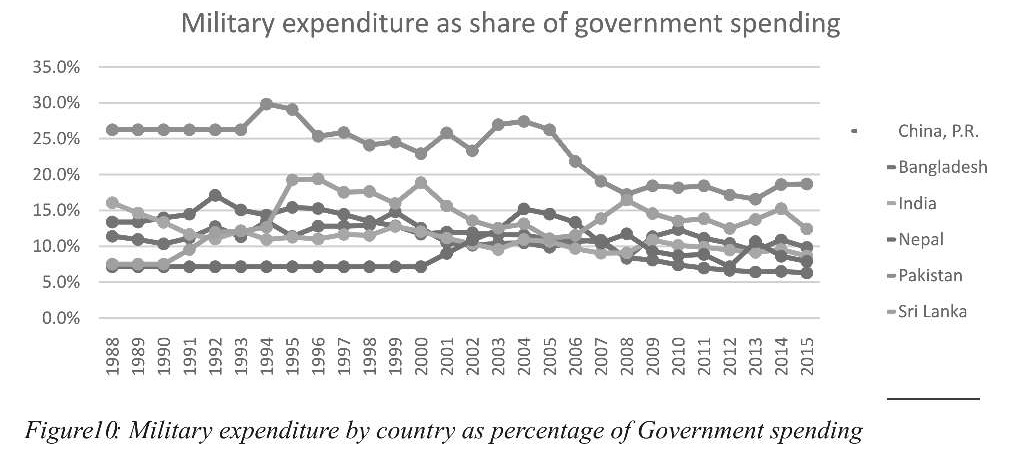
It can be observed that Military expenditure by country as percentage of Government spending, is maximum for Pakistan.
Predictive analytics is used to forecast the future trends. It also helps make inferences about the population from samples
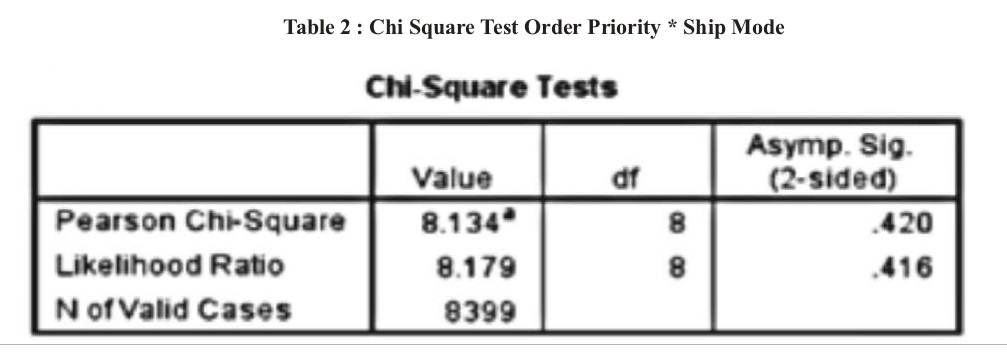
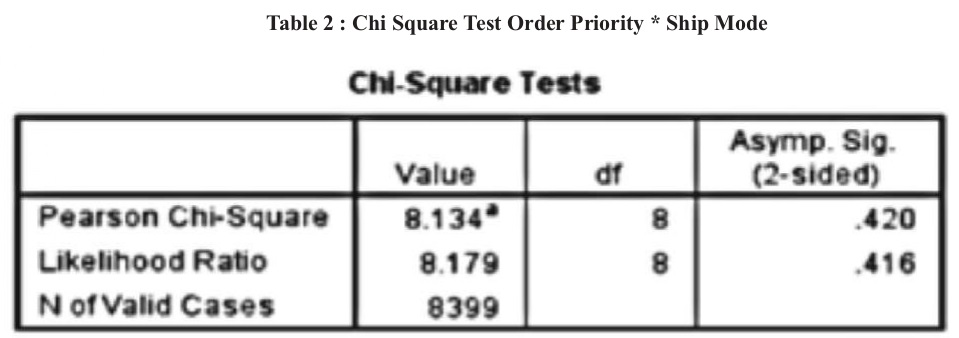
The Chi Square test value is not significant. Hence it can be concluded that low priority orders also tend to be shipped by air along with high priority orders.
The Chi Square test result is significant. It can be observed that product category 2, can be packed in small boxes and wrap bags, and therefore places minimum burden on the logistics and is ideal for critical zones.

The Chi Square test result is significant. Thus it can be concluded that different provinces depending on whether they are critical zones or peace stations, have different order priorities.

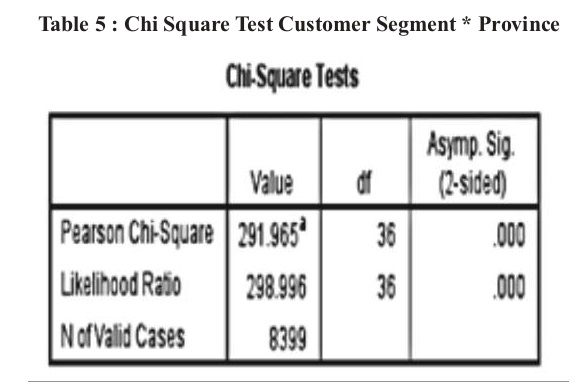
The Chi Square test statistic is significant. Therefore, it can be concluded that the customer segments differ across provinces depending on the size of the province and the nature of the province, whether it is a critical zone or peace station.
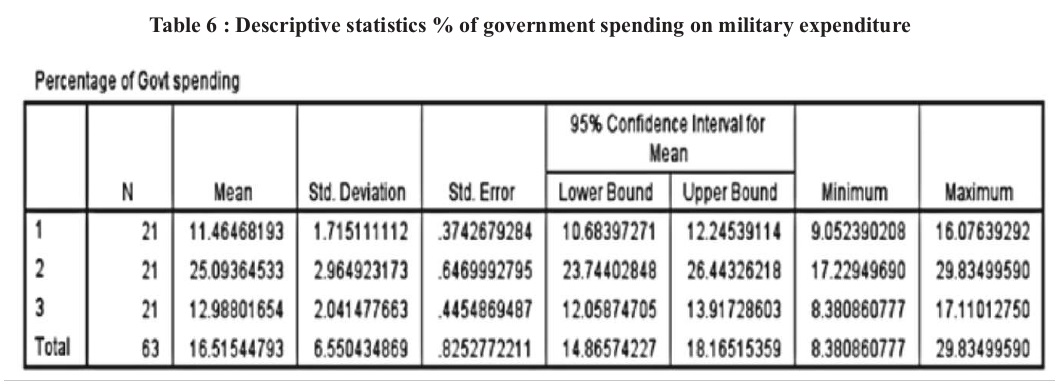
From the descriptive statistics table above, it is observed that the means for the three population subgroups (India, Pakistan, China) differ significantly, with respect to percentage of government spending on military expenditure. To examine whether these differences are due to random sampling variations or actually exist in the population the ANOVA test is used.

The output of the Levene’s test is not significant, which implies that the variances are equal among the various population subgroups.
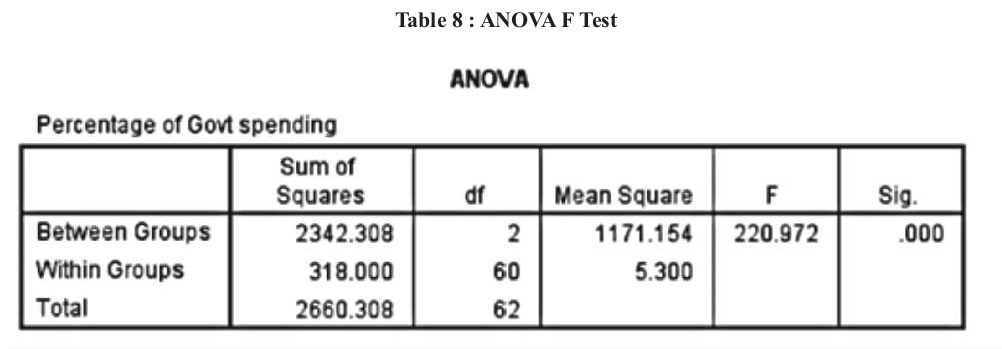
The output of the ANOVA test is significant, therefore it can be concluded that the means are not equal among the various population subgroups. To determine whether the population mean for India is greater than Pakistan and China, with respect to mean of percentage of government spending on military expenditure, post hoc analysis is done. The post hoc analysis is done using the Bonferroni test and Dunnett t test. The mean of percentage of government spending on military expenditure for India, is taken as the control variable. The hypotheses are formulated as follows. Null Hypothesis (H0): The mean of percentage of government spending on military expenditure for India is same as that for Pakistan and China. Alternate Hypothesis (H1): The mean of percentage of government spending on military expenditure for India is less than that for Pakistan and China.
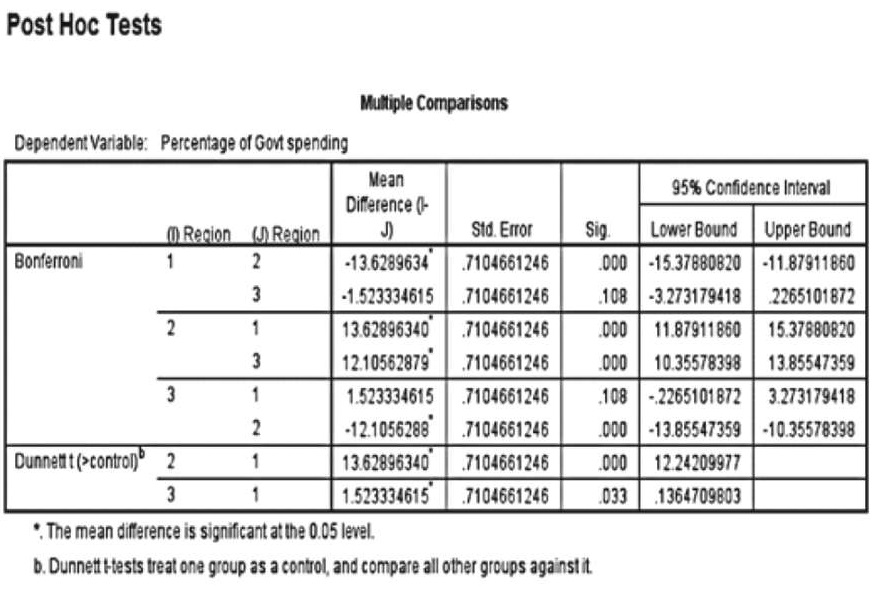
The output of Dunnett t post hoc test is significant. Therefore, the null hypothesis is rejected. It can be concluded that the mean of percentage of government spending on military expenditure for India is less than that for Pakistan and China. The Bonferroni test defines by how much the mean of percentage of government spending on military expenditure for India is less than that for Pakistan and China. This is seen in the first row of the output.
Multiple Linear Regression is used to predict the demand based on variation in the independent factors order month, province, product category, order priority and shipping cost.Stepwise Multiple Linear Regression is used

It is observed that with successive iteration of the stepwise method the adjusted R Square value increases until it is optimized. In this model, the independent variables order month, province and product category can explain 92.1% variation in the dependent variable order quantity. To examine whether this relationship is due to sampling variance or it actually exists in the population the ANOVA table is used.
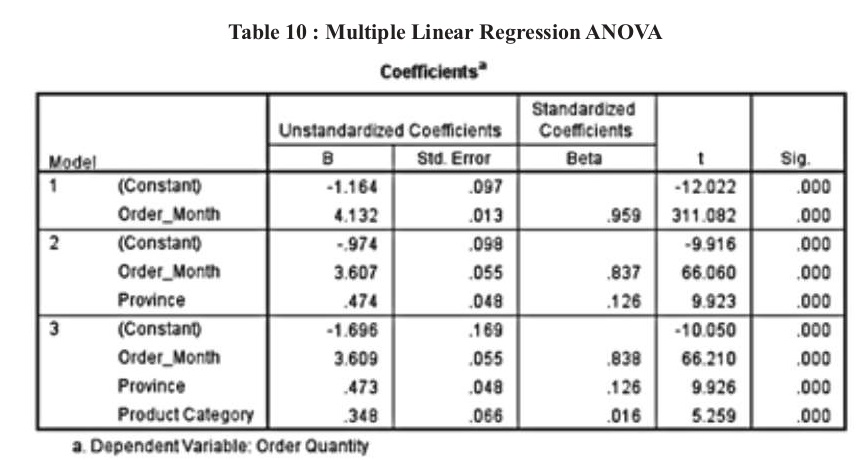
The result of ANOVA is significant. Therefore it can be concluded that there is relationship between the dependent variable (demand) and combination of independent variables (order month, province and product category). Order priority and shipping cost were excluded by the stepwise method as they have no significant impact on the order quantity.
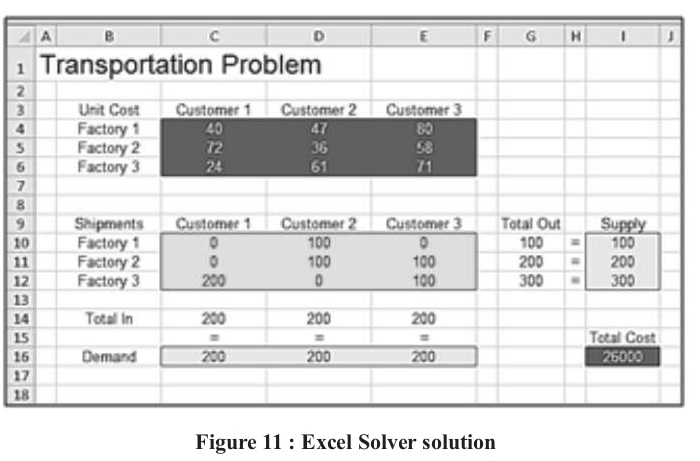
Prescriptive analytics is concerned with optimization of business models to minimize cost and maximize profit
Using Excel Solver the transportation model can be optimized by using the linear programming simplex method to minimize cost. The optimal solution is as follows.
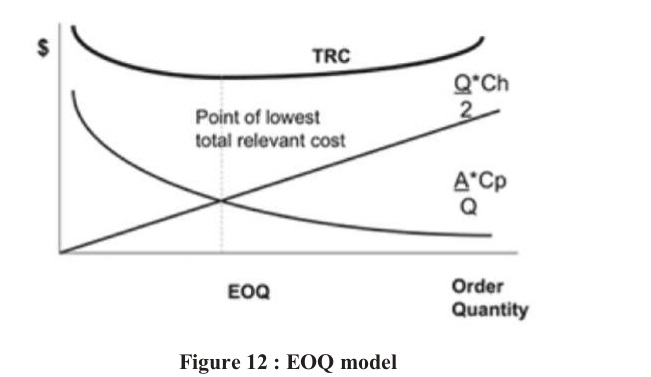
The economic order quantity (EOQ) is the order quantity that minimizes total holding and ordering costs for the year. Two most important categories of inventory cost are ordering cost and carrying cost. Ordering cost is cost that is incurred on obtaining additional inventory. This includes cost incurred on communicating the order, transportation cost, etc. Carrying cost represents the cost incurred on holding inventory in hand. This includes the opportunity cost of money held up in inventory, storage cost, spoilage cost, etc.
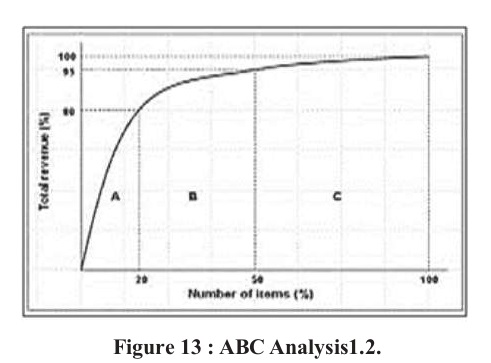
The ABC classification process is an analysis of a range of objects, such as finished products, items lying in inventory or customers into three categories. It's a system of categorization, with similarities to Pareto analysis, and the method usually categorizes inventory into three classes with each class having a different management control associated. A is very important; B is of average importance; C is relatively unimportant as a basis for a control scheme. Popularly known as the "80/20" rule ABC concept is applied to inventory management as a rule-of-thumb. It says that about 80% of the Rupee value, consumption wise, of an inventory remains in about 20% of the items.
Descriptive analytics is used to perform multidimensional analysis using IBM Cognos Insight and the following observations are made. The profit generated by a product is not just a function of sales but is also significantly impacted by shipping cost. The ship mode for lower priority items can be optimized to reduce shipping cost. For critical zones, products that have low packaging volume are more popular as they place minimum burden on the logistics. Based on seasonal trend analysis Just In Time (JIT) inventory management technique may be used to minimize inventory carrying cost and spoilage cost. Predictive analytics is used to forecast the future trends and make inferences about the population from samples. There is significant positive correlation between sales and profit. There is significant negative correlation between profit and shipping cost. The Chi Square test reveals that low priority orders also tend to be shipped by air along with high priority orders adding to the shipping cost. There is significant relationship between product category and product container, making light weight products ideal for critical zones. The Chi Square test points that different provinces depending on whether they are critical zones or peace stations, have different order priorities. From the Chi Square test it can be observed that the customer segments differ across provinces depending on the size of the province and the nature of the province, i.e. whether it is a critical zone or peace station. From the One Way ANOVA and post hoc tests it can be concluded that the mean of percentage of government spending on military expenditure for India is less than that for Pakistan and China. Multiple Linear Regression is used to predict the demand; the independent variables order month, province and product category can explain 92.1% variation in the dependent variable order quantity. Prescriptive analytics is used to arrive at the optimal solution. It is observed that the solution using Linear Programming Simplex method using Excel Solver is optimal amongst all the other methods. Excel Solver is a free add-in provided with Microsoft Excel. Thus this technique can be used with zero set up cost, to provide the optimal transportation model at the fastest computation speed using automation. Microsoft Excel Macros are created to perform ABC analysis and compute Economic Order Quantity (EOQ). The use of scientific automation techniques makes the order management system more predictable and reduces total cost of inventory management which includes carrying cost, ordering cost, opportunity cost and spoilage cost. JIT technique can be used based on seasonal trend analysis performed using descriptive analytics. ABC analysis and EOQ can be used in conjunction with predictive analytics using multiple linear regressions to predict order quantity based on province, order month and product category. Based on this research study the null hypotheses are rejected and it can be concluded that
•	There is reduction in total cost of inventory management by the use of statistical demand forecasting models.
•	There is reduction in cost of transportation by the use of production operation management models.
•	There is reduction in total cost of inventory management by supplementing VED analysis with EOQ and ABC analysis.
The mean of percentage of government spending on military expenditure for India is less than that for Pakistan and China. However this can be further reduced and recommendations for the same are made below. Business analytics can be used to predict the demand based on variation in the independent factors order month, province, product category, order priority and shipping cost with 92.1% accuracy. Transportation models can be optimized using Linear Programming Simplex method using Excel Solver. Excel Solver is a free add-in provided with Microsoft Excel. Thus this technique can be used with zero set up cost, to provide the optimal transportation model at the fastest computation speed using automation. As light weight products with long shelf life are preferred in critical zones, the use of DRDO health drink using Seabuckthorn may be promoted. Seabuckthorn is a wild shrub found in high altitude areas with excellent nutritional and anti-cold, properties. The fruit juice of seabuckthorn is a rich source of vitamins A, B1 , B2, C, E and K. DRDO has developed beverage out of berries of this plant which does not freeze at subzero temperature and is an excellent health drink. It is recommended to reduce the shipping cost by choosing the appropriate ship mode based on order priority. Based on seasonal trend analysis Just In Time (JIT) inventory management technique may be used to minimize inventory carrying cost and spoilage cost. The use of scientific automation techniques such as EOQ, ABC and predictive modeling may be used to make the order management system more predictable and reduce total cost of inventory management.
1.	Attrey, D. P. (2013). D Vijaya Rao (ed): Armies, wars and their food. Cambridge University Press India Pvt Ltd, New Delhi, India, 2012 (ISBN: 978-7596-918-6) Pages xx+ 534.
2.	 Babusha, S. T., Singh, V. K., Shukla, V., Singh, S. N., & Prasad, N. N. (2008). Assessment of Ration Scales of the Armed Forces Personnel in Meeting the Nutritional Needs at Plains and High Altitudes-I. Defence Science Journal, 58(6), 734.
3.	Bertrandt, J., Kłos, A., Waszkowski, R., Nowicki, T., Pytlak, R., Stęzycka, E., & Gazdzinska, A. (2014). Copper Content in Daily Food Rations Planned and Served to Students from Selected Military Academies and Soldiers Doing Compulsory Military Service in the Polish Army. World Academy of Science, Engineering and Technology, International Journal of Medical, Health, Biomedical, Bioengineering and Pharmaceutical Engineering, 8(2), 80-83.
4.	Bhattacharya, M. (2015). A historical exploration of Indian diets and a possible link to insulin resistance syndrome. Appetite, 95, 421-454.
5.	Cecil, S. R., & Woodruff, J. G. (1962). Long-term storage of military rations (Vol. 2). Department of the Army, Quartermaster Research and Engineering Command, Quartermaster Food and Container Institute for the ARmed Forces.
6.	Cline, L. D., & Highland, H. A. (1985). Survival, reproduction, and development of seven species of stored-product insects on the various food components of lightweight, high-density, prototype military rations. Journal of economic entomology, 78(4), 779-782.
7.	Chairil, T. (2018). The politics behind Alpalhankam: Military and politico-security factors in Indonesia’s arms procurements, 2005–2015. Competition and Cooperation in Social and Political Sciences.
8.	Deuster, P. A., Jones, B. H., & Moore, J. (1997). Patterns and risk factors for exercise-related injuries in women: a military perspective. Military medicine, 162(10), 649.
9.	Froio, D., Lucciarini, J., Ratto, J., Thellen, C., & Culhane, E. (2005, March). Developments  in high barrier non-foil packaging structures for military rations. In Proceedings of Flexible Packaging Conference, Orlando, FL, USA (pp. 14-17).
10.	King, N., Fridlund, K. E., & Askew, E. W. (1993). Nutrition issues of military women. Journal of the American College of Nutrition, 12(4), 344-348.
11.	King, N., Arsenault, J. E., Mutter, S. H., Champagne, C., Murphy, T. C., Westphal, K. A., & Askew, E. W. (1994). Nutritional intake of female soldiers during the US Army basic combat training (No. USARIEM-T94-17). ARMY RESEARCH INST OF ENVIRONMENTAL MEDICINE NATICK MA.
12.	Lakins, D. G., Echeverry, A., Alvarado, C. Z., Brooks, J. C., Brashears, M. T., & Brashears, M. M. (2008). Quality of and mold growth on white enriched bread for military rations following directional microwave treatment. Journal of food science, 73(3).
13.	Malhotra, M. S., Rai, R. M., Sridharan, K., & Bhaskaran, A. (1970). Rationalization of army ration scales for peace and field areas. Phase I-Field Scales. Report no. DIPAS/6/70.
14.	Mathur, V. K., Ramanathan, L. A., & Bhatia, B. S. (1972). Dehydrated khichdi and pulav. J Food Sci Technol Mysore.
15.	Malhotra, M. S., CHANDRA, U., & Sridharan, K. (1976). Dietary intake and energy requirement of Indian submariners in tropical waters. Ergonomics, 19(2), 141-148.
16.	Malhotra, M. S., Chandra, U., Rai, R. M., Venkataswamy, Y., & Sridharan, K. (1976). Food intake and energy expenditure of Indian troops in training. British Journal of Nutrition, 35(2), 229-244.
17.	Premavalli, K. S. (2000). Convenience Foods for Defence Force Based on Traditional Indian Foods. Defence Science Journal, 50(4), 361.
18.	Ramanuja, M. N., Susheela, B. A., VALLI, D., Sarma, M. L., Rao, M. V. R. K., Rao, N. A. N., & Vijayaraghavan, P. K. (1967). Proximate and mineral composition of some processed military rations. Indian Journal of Nutrition and Dietetics, 4, 311-317.
19.	Rai, R. M., Sridharan, K., Swamy, Y. V., Mukherjee, A. K., Radhakrishnan, U., Kumaria, M. M. L., ... & Sampatkumar, T. (1983). Effect of repeated strenuous exercise under low energy intake on physical performance. Defence Institute of Physiology and Allied Sciences, DIPAS, 6, 83.
20.	Sachidhanandam, M., Singh, S. N., Sharma, Y. K., Salhan, A. K., & Ray, U. S. (2010). Plasma proANP1-98 Response During High Altitude Stress: Effect of Age and Ethnicity. Wilderness & environmental medicine, 21(1), 11-16.
21.	Schneeman, B. O. (1987). Soluble vs insoluble fiber: different physiological responses. Food Technology.
22.	Viswanathan, K. R., Prasad, N. N., & Siddalingaswamy, M. (1997). Effect of Short Term Energy and Protein Restriction on Tissue and Body. Defence Science Journal, 47(2), 159.
23.	Wilson, N., Nghiem, N., Summers, J. A., Carter, M. A., & Harper, G. (2013). A nutritional analysis of New Zealand military food rations at Gallipoli in 1915: likely contribution to scurvy and other nutrient deficiency disorders. The New Zealand Medical Journal (Online), 126(1373).
24.	Wenkam, N. S., & Fox, M. (1989). Validity of self-estimated and weighed dietary data for assessment of military rations. Journal of the American Dietetic Association, 89(2), 203-208.

