Pacific B usiness R eview I nternational

A Refereed Monthly International Journal of Management Indexed With THOMSON REUTERS(ESCI)
|
Dr. Chandan (M.B.A., Ph.D) Contact No.:- 09478382707 E-mail:- chandan3149@gmail.com |
The purpose of reforms in Indian economy especially in Indian Life insurance sector was to make the economy more market oriented. Due to these reforms the insurance sector was opened to private players. As a result new private life insurers started their business in Indian life insurance sector and a big chunk of life insurance businessgone in the hands of private players and the monopoly of public sector player (LIC)was finished. In the light of widening of the life insurance market there is a need to conduct fresh research on growth and expansion of lifeinsurance industry in India.The present study reveals that the private sector shows more growth as compared to public sector in terms of total premium during the period of the study. However, both public and private sector shows negative growth in number of policies issued. Moreover, the life insurance industry expanded itself mainly in areas other than metro and urban areas. It is suggested in the study that IRDA should start mass campaign to educate people regarding the need of life insurance which will help the life insurance companies to cover untapped market.
Keywords: expansion, growth, IRDA, Life Insurance, LIC, private players, total premium
The social and economic development in the Indian economy is based on the service sector which is the fastest growing sector. The era of liberalization has brought about a rapid change in the service industry which has converted Indian economy from agricultural based economy to service-based economy and also infused competition.The Indian insurance sector which is part of the financial service sector is also very wide. It was initially monopolized by the public sector but with the economic reforms undertaken by government of India, the insurance sector was also opened to the private sector so as to avail of the immense growth potential of this sector.At present there are 23 private life insurance companies operating in India. The entry of many private life insurance companies in life insurance market has affected the performance of public sector player and has given the customer a choice other than LIC. This has also led to growth of life insurance industry in India especially after the post reform period.
Rao (1999) studied the growth and pattern of life insurance industry.The period chosen for the study was 1960-61 to 1993-94 which was further divided into two periods i.e. from 1960-61 to 1983-84 and 1984-85 to 1993-94.The life insurance business was found lower in terms of coverage and contribution to national income and savings during the study period which implied that LIC had a great potential to grow in future.
Krishnamurthy and et al. (2005) studied the growth and status of Indian insurance sector after liberalization.The study revealed that LIC served better in rural areas while private sector insurance companies gave more importance tourban areas and metro cities.
Bhatia and Sharma (2008) in their study attempted to review and assess the performance of Indian services sector since the economic reforms launched.According to the studythe business of private insurance companies increased rapidly.
Singh and Garg (2008) in their study analyzed market share of both life insurers and non-life insurers in the public as well as private sector. The study highlighted that LIC and private insurers respectively held a market share of 87.44 and 12.56 per cent during 2003-04.The size of the life insurance market increased with the growth of theeconomy and concomitant increase in the per capita income. This resulted in a favorable growth for LIC (15.63%) and private new insurers (17.63%) in 2003-04. Acomparatively higher growth of the later was due to a very small base.
Pasricha and Arora (2009) in their paper studied the recent scenario of life insurance industry in India in the light of various changes like liberalization, privatization, and globalization.The study pertained to the period 2000-01 to 2006-07.The study found LIC registered a growth of 0.6 per cent while private insurers registered a growth rate of 92.4 percent in terms of new offices opened. The growth of premium income of LIC (21.3%) was also found to be lesser than private players (250.4%).
Rajendran and Natarajan (2009) in their study compared the overall performance of Indian Life Insurance Corporation of India between pre- and post-Liberalization era (1957 to 2007).The study showed that LIC’s business in India as well outside India had an increasing trend.
Pasricha (2009) in his doctoral research appraised the performance of LIC.The study was based on secondary data covering 27 years from 1980-81 to 1999-2000 (period prior to IRDA) and 2000-01 to 2006-07 (period after IRDA).The study concluded that LIC had grown in terms of branches during the study period.The most of the business of LIC was procured during the last quarter of year.The study suggested that LIC should concentrate on north eastern states of country. The number of offices and cash counters should be increased.
Selvakumar and Priyan (2010) in their paper studied the recent scenario of life insurance in India and the prospects for private sector.The study highlighted that the insurance companies were increasingly tapping the semi-urban and rural areas to take across the message of protection of life through insurance cover.
Choudhary and Kiran(2011) studied the recent life insurance scenario and changes in number of offices of Indian life Insurers andgrowth of premium income in Indian life insurance Industry.The period of study was 2006-07 to 2010-11. It was found that life insurance industry expanded tremendously from 2000 onwards in terms of number of offices and premium income.
Arif (2015) studied the trends and pattern of life insurance industry in India. The study pertained to the period of 10 years from 2003-04 to 2012-13.The study found that after privatization the life insurance industry showed an increasing trend in terms ofotal premium, number of new policies issued and number of offices opened. but in the life insurance industry showed the decreasing trends.
Objectives of the study
1. To study the sector-wise growth of life insurance industry in India during post liberalization period.
2. To analyse the region-wise expansion of life insurance industry in India during post liberalization period.
3. To evaluate the impact of number of new policies issued and number of total offices of public and private life insurers on their total premium with the help of multiple regression model.
Scope of the Study
The scope of study is limited to public and private sector life insurance companies operating in India.
Period of the Study
The period of study for the analysis of life insurance industry is of ten years from 2006-07 to 2015-16.
The study is based on secondary data. These data have been collected from various sources namely annual reports of IRDAI and annual reports of public and private life insurance companies operating in India. The study has also used some relevant information from the website of Insurance Regulatory and Development Authority of India (IRDAI).The sector specific data ontotal premium, number of policies issued and number of offices, have been used to study the comparative growth and expansion of life insurance industry.
The data have been analyzed with the help of growth rate over previous year and Compound Annual growth rate (CAGR). The coefficient of variation has also been used to assess the inter-year variation of the data. The normality of the data has been confirmed through Jarque-Bera normality test. The non-normal data has been transformed by using Box-Cox transformation technique. Two samplet-testhas been applied to test thesignificance of mean difference between public and private sector on various issues. The Levene’s test has been applied to check the homogeneity of variance. In some cases whereassumption of homogeneity of variances is not met Welch t-test has been applied. To test thesignificance of mean difference between the officesin three groups of cities/areas (metro, urban and unclassified), the WelchAnova test has been applied because the assumption of homogeneity of variances is not met. The post-hoc analysis has also been carried out with the help of Games Howell post-hoc test to identify the groups that are significantly different from each other. Themodel of multiple linear regression has been used to examine the impact of new policies issued and number of total offices on total premium of life insurance industry. The assumptions of multiple linear regression model have been tested through various statistical tests. The assumption of normality of residuals has been checked through Jarque-Bera test. The assumption of no autocorrelation has been tested through Durbin Watson statistic. The assumption of no multicollinearity is tested through value of tolerance and Variation Inflation factor. The main hypotheses of the study have been formulated at appropriate places of the study and accepted or rejected at 5 per cent level of significance.
With the entry of private insurers in life insurance business in India, it was expected that some proportion of new business would go in the hands of private life insurers. In order to study the impact of privatization an attempt has been made to study the growth of life insurance business in terms of policies and premium income of Indian life insurance industry.Premium is an amount paid periodically or once to the insurer by the insured for covering his or her risk. The growth of life insurance business in India is presented in Table 1.
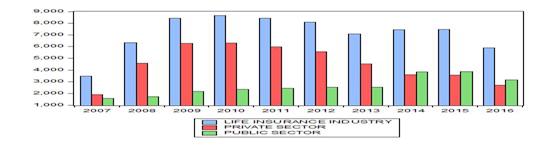
The table reveals that the total premium of life insurance industry rose from `1560 billion in 2006-07 to `3669.43 billion in 2015-16. This amount is more than two times of the premium received in the initial year of the study. The total premium of life insurance industry registered a growth rate of 8.92 per cent during the period of the study. Further, the life insurance industry reported positive growth over previous years in all the years of the study except 2011-12. Sector-wise, the table exhibits that the LIC’s total premium increased from `1278.22 billion to `2664.44 billion registering a growth rate of 7.62 per cent during the period of the study. Moreover, the public sector life insurer registered a positive growth in all the years of the study except 2011-12 in receipt of total premium. On the other hand, the total premium of private sector rose from `282.53 billion to `1004.99 billion registering a much higher growth rate (13.53%) as compared to public sector life insurer during the period of the study. The private sector life insurer recorded a positive growth in all the years of the study except 2011-12 and 2013-14. The Coefficient of Variation was 0.20 and 0.26 for public and private sector respectively which revealed that the public sector player was more consistent in terms of total premium receivedas compared to private sector.
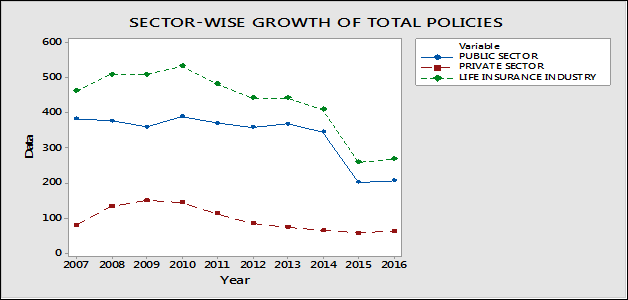
Table 1 reveals that the total policies issued by life insurance industry showed a fluctuating trend during the period of the study. In the initial three years of the study (2007-08 to 2009-10), the life insurance industry showed a positive growth while in the next five years (2010-11 to 2014-15), the life insurance industry showed a negative trend. However, in 2015-16, the life insurance industry was able to revive and grew by 3.21 per cent over 2013-14 in terms of number of new policies issued. The industry showed a decline of 5.31 per cent during the period of the study. Sector-wise the total policies issued by LIC decreased from 382.29 lakh to 205.47 lakh during the period of the study. The public sector player showed a fluctuating trend over theperiod of study. There are five years (2007-08, 2008-09, 2010-11, 2012-13 and 2014-15) in which LIC recorded a negative growth rates over previous years whereas in the remaining years the company registered a positive growth over previous years. During the period of the study the public sector player recorded a decline of 6.02 per cent in total number of policies issued. On the other hand the private sector registered a growth of 67.40 per cent in 2007-08. In 2008-09 the growth over previous year was reported to be 13.19 per cent. After 2008-09 the private sector of life insurance industry registered a negative growth up to 2014-15. However, the private sector was able to revive in 2015-16 by recording a growth of 7.93 per cent over 2014-15. The private sector declined by 2.43 per cent in all the years of the study. The Coefficient of Variation was 0.20 and 0.35 for public and private sector respectively which showed that the public sector player was more consistent as compared to private sector in terms of new policies issued.
The normality of data has been tested through Jarque-Bera test. The Jarque-Bera statistic (Table 1) reveals that the data for total premium and total policies for public and private sector is normally distributed at 5 per cent level of significance. The value of Levene’s statistic (4.40, p=0.05)between public and private sector for total premium reveals that the assumption of equality of variances is not met. To test the significancedifference in the mean of total premium of public and private sector life insurers’, Welcht-test has been applied. The value of t (8.085, p=0.00) depicts that there is significant difference in the mean total premium of public and private life insurers. Hence the null hypothesis that there is no significant difference in the
Table 1: Sector-wise Growth of Life Insurance Business in India
| Year | Total Premium (` Billion) | Total Policies (Lakhs) | ||||||||||
| Public Sector | Growth over Previous Year | Private Sector | Growth over Previous Year | Industry | Growth over Previous Year | Public Sector | Growth over Previous Year | Private Sector | Growth over Previous Year | Industry | Growth over Previous Year | |
| 2006-07 | 1278.22 | - | 282.53 | - | 1560.75 | 382.29 | - | 79.22 | 461.51 | - | ||
| 2007-08 | 1497.89 | 17.19 | 515.61 | 82.50 | 2013.50 | 29.01 | 376.13 | -1.61 | 132.62 | 67.40 | 508.75 | 10.23 |
| 2008-09 | 1572.88 | 5.01 | 644.97 | 25.09 | 2217.85 | 10.15 | 359.13 | -4.52 | 150.11 | 13.19 | 509.24 | 0.09 |
| 2009-10 | 1860.77 | 18.30 | 793.69 | 23.06 | 2654.46 | 19.69 | 388.63 | 8.21 | 143.62 | -4.32 | 532.25 | 4.51 |
| 2010-11 | 2034.73 | 9.35 | 881.65 | 11.04 | 2916.38 | 9.85 | 370.38 | -4.70 | 111.14 | -22.61 | 481.52 | -9.53 |
| 2011-12 | 2028.89 | -0.29 | 841.82 | -4.52 | 2870.71 | -1.57 | 357.51 | 3.47 | 84.42 | -24.04 | 441.93 | -8.22 |
| 2012-13 | 2088.03 | 2.96 | 783.98 | 2.91 | 2872.01 | 0.04 | 367.82 | 2.88 | 74.05 | -12.28 | 441.87 | -0.01 |
| 2013-14 | 2369.42 | 13.48 | 773.59 | -1.35 | 3143.01 | 9.43 | 345.12 | -6.17 | 63.60 | -14.11 | 408.72 | -7.50 |
| 2014-15 | 2396.67 | 1.15 | 884.33 | 14.32 | 3281.00 | 4.39 | 201.71 | -41.55 | 57.37 | -9.80 | 259.08 | -36.61 |
| 2015-16 | 2664.44 | 11.19 | 1004.99 | 13.64 | 3669.43 | 11.83 | 205.47 | 1.86 | 61.92 | 7.93 | 267.39 | 3.21 |
| CAGR | 7.62 | 13.53 | 8.92 | -6.02 | -2.43 | -5.31 | ||||||
| Mean | 1979.19 | 740.71 | 2719.91 | 335.41 | 95.08 | 431.22 | ||||||
| C.V. | 0.20 | 0.26 | 0.22 | 0.20 | 0.35 | 0.21 | ||||||
| Jarque-Bera statistic | 0.40 p=0.81 normally distributed at 5 per cent level of significance | 1.89 p=0.38 normally distributed at 5 per cent level of significance | 3.20 p=0.20 normally distributed at 5 per cent level of significance | 1.17 p=0.55 normally distributed at 5 per cent level of significance | 1.65 p=0.43 normally distributed at 5 per cent level of significance | |||||||
| Levene Test of equality of variances | 4.40,p=0.05 equality of variances not assumed | 2.27, p=0.14 equality of variances assumed | ||||||||||
| Two sample t-value | 8.085 degrees of freedom= 13 p=0.00 significant at 5 per cent level of significance | 9.586 degrees of freedom= 18 p=0.00 significant at 5 per cent level of significance | ||||||||||
| Mean Diff. | 1238.47 | 239.61 | ||||||||||
Note: Total Premium Exclude specialized insurers and Standalone Health Insurers
Source: IRDA Annual Reports of various Years
Figures in parentheses denotes market share
Figure 1: Graph Representing Sector-wise Growth of Life Insurance Total Premium in India
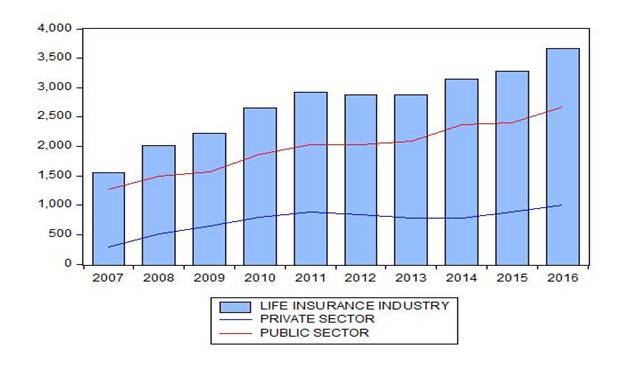
Figure 2: Graph Representing Sector-wise Growth of Life Insurance Total Policies in India
mean of total premium of public and private sector life insurers’ during the period of the study stands rejected and the alternative hypothesis that there is significant difference in the mean of total premium of public and private sector life insurers during the period of the studystands accepted at 5 per cent level of significance. To test the significance difference in the mean ofnew policies issuedby public and private sector life insurers’, t-test has been applied because the assumption of homogeneity of variances (Levene statistic=2.27, p=0.14) is met.The value oft(9.586, p=0.00) depicts that there is significant difference in the mean of new policies issuedby public and private sector life insurers. Hence the null hypothesis that there is no significant difference in the mean ofnew policies issued by public and private sector life insurers’ during the period of the study stands rejected and the alternative hypothesis that there is significant difference in the mean of new policies issuedby public and private sector life insurers during the period of the study is accepted at 5 per cent level of significance.
Region-Wise Expansion of Life Insurance Industry in India
According to the regulations framed by the IRDA the life insurers in India irrespective of their sector have the obligations towards rural and social sector. Therefore, it is important to studythe location wise set up of officesby lifeinsurers in India. The data on the region-wise distribution of offices of life insurers are presented in Table 2.
The table depicts that as on 31.3.2007, 64.71 per cent of the offices of life insurers operating in India were situated in unclassified areas followed by urban (25.06%) and metro cities (9.78%). The share of unclassified areas continued to increase and reached to 72.98 per cent in 2011.After 2011, the share of urban areas in terms of number of offices started increasing and percentage of offices in unclassified areas started decreasing. The percentage share of unclassified areas reached to 53.12 per cent in 2016.In 2008, the share of metro cities in number of offices increased to 10.53 per cent. After 2008, the metro cities recorded a fluctuating trend and reached to 31.83 per cent in 2016.Sector-wise it was evident from the table that LIC had 2301 offices in 2007 out of which only 10.12 per cent offices were in metro cities. The big chunk of offices (68.19%) of LIC was found to be in unclassified areas.After 2007, the share of unclassified areas continued to increasewhile the share of urban areas continued to decline till 2012.The shareof unclassified areas in offices of LIC found to be 73.14 per cent in 2012.The share of urban areas found to be 16.29 per cent in 2012.After that the unclassified areas and
Table 2: Area-wise Expansion of Life Insurance Industry in India in terms of Total Offices
(As on 31st March)
|
Public Sector |
Private Sector |
Total Industry |
||||||||||
|
Region/Areas |
||||||||||||
|
Year |
Metro |
Urban |
Unclassified |
Total |
Metro |
Urban |
Unclassified |
Total |
metro |
urban |
Unclassified |
Total |
|
2007 |
233 (10.12) |
499 (21.69) |
1569 (68.19) |
2301 (100) |
316 (10.29) |
848 (27.60) |
1908 (62.11) |
3072 (100) |
549 (9.78) |
1347 (25.06) |
3477 (64.71) |
5373 (100) |
|
2008 |
311 (12.33) |
468 (18.55) |
1743 (69.11) |
2522 (100) |
628 (9.82) |
1169 (18.29) |
4594 (71.88) |
6391 (100) |
939 (10.53) |
1637 (18.36) |
6337 (71.09) |
8913 (100) |
|
2009 |
338 (11.15) |
529 (17.45) |
2163 (71.38) |
3030 (100) |
927 (10.55) |
1594 (18.14) |
6264 (71.30) |
8785 (100) |
1265 (10.70) |
2123 (17.96) |
8427 (71.32) |
11815 (100) |
|
2010 |
347 (9.36) |
550 (16.92) |
2353 (72.40) |
3250 (100) |
897 (10.20) |
1555 (17.73) |
6316 (72.03) |
8768 (100) |
1244 (10.35) |
2105 (17.51) |
8669 (72.13) |
12018 (100) |
|
2011 |
363 (10.76) |
560 (16.61) |
2448 (72.61) |
3371 (100) |
769 (9.40) |
1428 (17.46) |
5978 (73.12) |
8175 (100) |
1132 (9.80) |
1988 (17.21) |
8426 (72.98) |
11546 (100) |
|
2012 |
365 (10.56) |
563 (16.29) |
2527 (73.14) |
3455 (100) |
741 (9.60) |
1393 (18.06) |
5578 (72.32) |
7712 (100) |
1106 (9.90) |
1956 (17.51) |
8105 (72.57) |
11167 (100) |
|
2013 |
368 (10.43) |
614 (17.41) |
2544 (72.14) |
3526 (100) |
703 (10.40) |
1519 (22.47) |
4537 (67.12) |
6759 (100) |
1071 (10.41) |
2133 (20.73) |
7081 (68.84) |
10285 (100) |
|
2014 |
372 (7.68) |
617 (12.75) |
3850 (79.56) |
4839 (100) |
676 (10.91) |
1926 (31.09) |
3591 (57.98) |
6193 (100) |
1048 (9.49) |
2543 (23.05) |
7441 (67.44) |
11032 (100) |
|
2015 |
378 (7.75) |
622 (12.75) |
3877 (79.50) |
4877 (100) |
705 (11.45) |
1867 (30.32) |
3584 (41.77) |
6156 (100) |
1083 (9.81) |
2489 (22.55) |
7461 (32.36) |
11033 (100) |
|
2016 |
380 (7.76) |
1349 (27.57) |
3163 (35.33) |
4892 (100) |
1287 (20.82) |
2176 (35.21) |
2716 (43.97) |
6179 (100) |
1667 (15.05) |
3525 (31.83) |
5879 (53.12) |
11071 (100) |
|
Jarque-Bera statistic |
6.93 p=0.03 non-normal data at 5% level |
0.68, p=0.711 normal data at 5% level |
18.6 p=0.00 non-normal data at 5% level |
8.13,p=0.07 normal data at 5% level |
0.57,p=0.75 normal data at 5% level |
0.10, p=0.10 normal data at 5% level |
0.70, p=0.70 normal data at 5% level |
|
0.40,p=0.81 normal data at 5% level |
1.96,p=0.37 normal data at 5% level |
2.92,p=0.23 normal data at 5% level |
8.13,p=0.01 non-normal data |
Metro: 10, 00,000 and above
Urban: From 1, 00,000 to 9, 99,999
Unclassified: Other Places or Rest of places
Figures in parenthesis are percentages
Table 2 (a): Calculation of One Way Annova and t-testafterBox-Cox Transformations of Non-Normal Data
|
|
Public Sector |
Private Sector |
Life Insurance Industry |
Total |
|||||||
|
Year |
Metro ( Rounded value of λ=5) |
Urban |
Unclassified ( Rounded value of λ=0) |
Metro |
Urban |
Unclassified |
metro |
urban |
Unclassified |
Public Sector |
Private Sector |
|
2007 |
686719856393 |
499.00 |
7.35819 |
316 |
848 |
1908 |
549 |
1347 |
3477 |
2301 |
3072 |
|
2008 |
2909390022551 |
468.00 |
7.46336 |
628 |
1169 |
4594 |
939 |
1637 |
6337 |
2522 |
6391 |
|
2009 |
4411471739168 |
529.00 |
7.67925 |
927 |
1594 |
6264 |
1265 |
2123 |
8427 |
3030 |
8785 |
|
2010 |
5030919566507 |
550.00 |
7.76345 |
897 |
1555 |
6316 |
1244 |
2105 |
8669 |
3250 |
8768 |
|
2011 |
6302794178043 |
560.00 |
7.80303 |
769 |
1428 |
5978 |
1132 |
1988 |
8426 |
3371 |
8175 |
|
2012 |
6478348728125 |
563.00 |
7.83479 |
741 |
1393 |
5578 |
1106 |
1956 |
8105 |
3455 |
7712 |
|
2013 |
6748994797568 |
614.00 |
7.84149 |
703 |
1519 |
4537 |
1071 |
2133 |
7081 |
3526 |
6759 |
|
2014 |
7123848901632 |
617.00 |
8.25583 |
676 |
1926 |
3591 |
1048 |
2543 |
7441 |
4839 |
6193 |
|
2015 |
7717186558368 |
622.00 |
8.26282 |
705 |
1867 |
3584 |
1083 |
2489 |
7461 |
4877 |
6156 |
|
2016 |
7923516800000 |
1349.00 |
8.05928 |
1287 |
2176 |
2716 |
1667 |
3525 |
5879 |
4892 |
6179 |
|
Jarque-Bera statistic |
1.59,p=0.45 data is normal at 5% level of significance |
0.68,p=0.71 data is normal at 5% level of significance |
0.31,p=0.85 data is normal at 5% level of significance |
0.57,p=0.75 normal data at 5% level of significance |
0.10, p=0.10 normal data at 5% level of significance |
0.70, p=0.70 normal data at 5% level of significance |
0.40,p=0.81 normal data at 5% level of significance |
1.96,p=0.37 normal data at 5% level of significance |
2.92,p=0.23 normal data at 5% level of significance |
0.76 p=0.68 normal data at 5% of significance level |
1.30 p=0.51 normal data at 5% level of significance |
|
Levene’s statistic |
10.68, p=0.00 equality of variances not assumed |
14.34, p=0.00 equality of variances not assumed |
6.32, p=0.00 equality of variances not assumed |
1.55, p=0.22 equality of variances assumed |
|||||||
|
Welch F-statistic |
56.06, p=0.00 significant at 5% level of significance |
38.61 p=0.00 significant at 5% level of significance |
76.36 p=0.00 significant at 5% level of significance |
|
|||||||
|
t-statistic |
|
|
|
-5.22 degrees of freedom=18,p=0.00 |
|||||||
Source: Author’s own calculations
Table 2(b): Test of Mean Differences throughGames HowellPost-HocTest
|
|
Public Sector |
Private Sector |
Life Insurance Industry |
||||||
|
Metro Versus Urban |
Metro Versus unclassified |
Urban Versus unclassified |
Metro Versus Urban |
Metro Versus unclassified |
Urban Versus unclassified |
Metro Versus Urban |
Metro Versus unclassified |
Urban Versus unclassified |
|
|
Mean difference |
5533318999362.90 |
5533318999992.16 |
629.26 |
-782.60 |
-3741.70 |
-2959.10 |
-1074.20 |
-6019.90 |
-4945.70 |
|
Sig. |
0.00 |
0.00 |
0.00 |
0.00 |
0.00 |
0.00 |
0.00 |
0.00 |
0.00 |
Source: Author’s own calculations
FIGURE 3: GRAPH REPRESENTING SECTOR-WISE SHARE OF OFFICES IN METRO REGION/AREAS
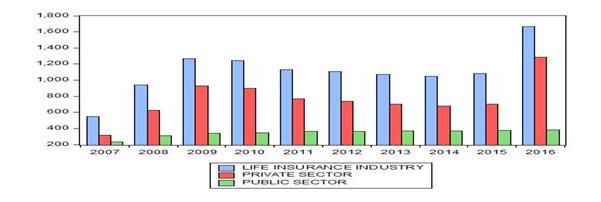
FIGURE 4: GRAPH REPRESENTING SECTOR-WISE SHARE OF OFFICES IN URBAN REGION/AREAS
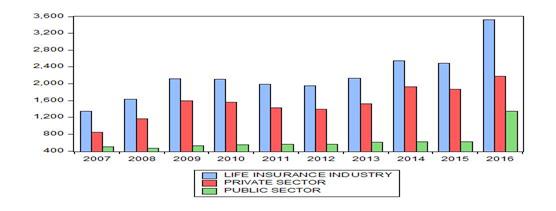
FIGURE 5: GRAPH REPRESENTING SECTOR-WISE SHARE OF OFFICES IN UNCLASSIFIED REGION/AREAS
urban areas showed a fluctuating trend. In 2016, the share of unclassified areas was recorded to be 35.33 per cent. The urban areas recorded share of 27.57 per cent in the last year of the study.A very small proportion (7.76%) of offices of LIC was in metro cities in 2016. In case of private sector majority of offices were situated in unclassified areas till 2012. After 2012, the share of unclassified areas started declining and reached to 43.97 per cent in 2016. The metro and urban areas did not show uniformity in their share in terms of offices of private sector during the period of the study. Only 20.82 per cent of the offices of private sector were situated in metro areas during 2016. In the last year of the study the urban areas had only 35.21 per cent offices of private sector life insurers.
The normality of the data has been verified with the help of Jarque-Bera normality test. All the data except offices in metro and unclassified region/areas are found to be normal at 5 per cent level of significance. To transform non-normal data into normal data Box-Cox transformation technique has been used. The optimal value of lambda comes to be 5 for metro areas and 0 for unclassified areas.
For public sector,the value of Levene’s statistic (20.15, p=0.00) reveals that the assumption of equality of variances between three groups is not met. Therefore, totest the significance of difference between the mean of officesof public sector in three groups of regions (metro, urban and unclassified), WelchAnovahas been applied. The Welch F-statistic (56.06, p=0.00) reveals that there is a significant differencebetween the mean of three groups. Hence the null hypothesis that there is no significant difference in the mean of officesof public sectorlife insurer inthree groups of regionsduring the period of the study stands rejected and the alternative hypothesis that there is significant difference inmean of officesof public sectorlife insurer inthree groups of regionsduring the period of the study is accepted at 5 per cent level of significance. To test which group is significantly different Games Howell post hoc test has been applied.The results of the test reveals that mean difference of offices of metro areas versus urban areas, metro areas versus unclassified areas and urban versusunclassified areasis significantly different at 5 per cent level of significance.
For private sector, the value of Levene’s statistic (14.34, p=0.00) reveals that the assumption of equality of variances between three groups is not met. To test the significance of difference between the mean of officesof private sector in three groups of cities/areas (metro, urban and unclassified), Welch Anova has been applied. The Welch F-statistic (38.61, p=0.00) reveals that there is a significant differencebetween the mean of three groups. Hence the null hypothesis that there is no significant difference in the mean of officesofprivate sectorlife insurer inthree groups of regionsduring the period of the study stands rejected and the alternative hypothesis that there is significant difference inmean of officesofprivate sectorlife insurer inthree groups of regions during the period of the study is accepted at 5 per cent level of significance. To test which group is significantly different Games Howell post-hoc test has been applied. The results of the test reveals that mean difference of offices of metro areas versus urban areas, metro areas versus unclassified areas and urban versusunclassified areas is significantly different at 5 per cent level of significance.
For life insurance industry, the value of Levene’s statistic (6.32, p=0.00) reveals that the assumption of equality of variances is not met. Therefore, to test the significance of difference between the mean of officesof total life insurance industry in three groups of regions (metro, urban and unclassified), Welch Anova has been applied. The Welch-statistic (76.36, p=0.00) reveals that there is a significant differencebetween the mean of three groups. Hence the null hypothesis that there is no significant difference in the mean of officesof life insurance industry inthree groups of regions during the period of the study stands rejected and the alternative hypothesis that there is significant difference inmean of officesoflife insurance industry inthree groups of regions during the period of the study is accepted at 5 per cent level of significance. To test which group is significantly different Games Howell post-hoc test has been applied. The results of the test reveals that mean difference of offices of metro areas versus urban areas, metro areas versus unclassified areas and urban versusunclassified areas is significantly different at 5 per cent level of significance.
To test the significancedifference in the mean of number of offices of public and private sector life insurers, t- test has been applied. The value of Levene’s statistic (1.55, p=0.22) reveals that the assumption of equality of variances between two groups is met.The value of t (-5.22, p=0.00) reveals that there is significant difference in the mean of number of officesof public and private sector life insurers. Hence the null hypothesis that there is no significant difference in the mean ofnumber of offices of public and private sector life insurers’ during the period of the study stands rejected and the alternative hypothesis that there is significant difference in the mean of number of offices of public and private sector life insurers during the period of the study is accepted at 5 per cent level of significance.
Relationship between Total Premium with Number of Policies and Offices of Life Insurers
The Pearson Correlation Coefficient is estimated to understand the relationship betweentotal premium (dependent variable), number of policies and number of offices (independent variables)of Life Insurers. Table 3 presents the relationship between the variables.
Table 3: Inter-Correlation between Total Premium, Policies and Offices
|
Variables |
Public Life Insurance |
Private Life Insurance |
Life Insurance Industry |
|
Total Premium |
Total Premium |
Total Premium |
|
|
Total Premium |
1 |
1 |
1 |
|
Sig. |
|||
|
Policies |
-0.731* |
-0.280^ |
-0.705* |
|
Sig. |
0.01 |
0.432 |
0.023 |
|
Offices |
0.953** |
0.539^ |
0.680* |
|
Sig. |
0.00 |
0.108 |
0.030 |
*Correlation is significant at 5 per cent level of significance
**Correlation is significant at 1 per cent level of significance
^Correlation is not significant at 5 per cent level of significance
Dependent variable is total premium
The results in the above table reveal that significant positive correlation exists between total premium and offices (0.953, p=0.00) of public sector life insurer. Hence null hypothesis stands rejected and alternate hypothesis that there is significant relationship between total premium and policies is accepted at 5 per cent level of significance . The strong negative correlation is found between total premium and policies (-0.731, p=0.01)of public sector life insurer. Hence null hypothesis stands rejected and alternate hypothesis that there is significant relationship between total premium and offices is acceptedat 5 per cent level of significance . The results in the same table reveal that moderate positive insignificant correlation exists between total premium and offices (0.539, p=0.108) of private sector life insurers. Hence null hypothesis stands accepted that there is no relationship between total premium and policies at 5 per cent level of significance . The week and insignificant negative correlation is found between total premium and policies (-0.280, p=0.432)of private sector life insurers. Hence null hypothesis stands accepted that there is no relationship between total premium and offices at 5 per cent level of significance. The results in the above table reveal that strongpositive correlation exists between total premium and offices (0.680, p=0.030) of life insurance industry. Hence null hypothesis stands rejected and alternate hypothesis that there is significant relationship between total premium and policies is acceptedat 5 per cent level of significance . Thestrong negative correlation is found between total premium and policies (-0.705, p=0.023) of life insurance industry. Hence null hypothesis stands rejected and alternate hypothesis that there is significant relationship between total premium and offices is acceptedat 5 per cent level of significance .
Impact of Number of Policies and Offices on Total Premium of Public Sector Life Insurer (LIC)
The multiple regression analysis is carried out to study the impact of two independent variables namely total policies issued and total offices ontotal premium (dependent variable). The assumption of normality of residuals has been tested through Jarque-Bera Test (Table 5). From the table it is clear that residuals are normally distributed at 5 per cent level of significance. The assumption of no auto correlation is tested through Durbin-Watson Test. According to rule of thumb, the value of Durbin-Watson statistic should be less than or equal to 2.50.The Durbin-Watson statistic (1.60) confirms that no auto correlation exists in the data.The assumption of no multicollinearity in data is tested throughvalue ofTolerance and Variation Inflation Factor. The value ofTolerance and Variation Inflation Factor (Table 7) reveals that there is no Multicollinearity in the data. The multivariate regression analysis is presented in Tables 6 and 7.
Table 5: Level of Normality of Residuals for Public Life Insurer through Jarque-Bera Normality Test
|
|
2006-07 |
2007-08 |
2008-09 |
2009-10 |
2010-11 |
2011-12 |
2012-13 |
2013-14 |
2014-15 |
2015-16 |
|
Predicted Values |
1402.27 |
1500.46 |
1725.34 |
180033.35 |
1882.82 |
1917.11 |
1952.20 |
2539.56 |
2515.45 |
2523.32 |
|
Residual value |
-124.05 |
-2.57 |
-152.46 |
27.41 |
151.90 |
111.77 |
135.82 |
-170.14 |
-118.78 |
141.11 |
|
Jarque-Bera- Statistic |
1.18, p=0.55 Normally distributed at 5 per cent level of significance. |
|||||||||
Table 6: Regression Statistics Model Summary and Calculated Value of Durbin-Watson
|
Regression Statistics Model Summary
|
Calculated Value of Durbin-Watson |
|||
|
R |
R Square |
Adjusted R square |
Standard error of the estimate |
|
|
0.953 |
0.909 |
0.883 |
149.46 |
1.60 |
The analysis reveals that the value of R is 0.953 which shows that there is very high degree of correlation exists between studied variables. The value of adjusted R square is 0.883 which means that 88.30 per cent variation in the total premium is explained by two independent variables namely total policies issued and total offices.
The value of F (34.89, p=0.00) in Table 7 reveals that the model used in this problem is statistically significant. Hence it supports the validity of the regression model. The relative importance of each variable in the model has been depicted through t-value presented in Table 7.
Table 7: Impact of number of offices and Policies on Total Premium of LIC through Multiple Regression Analysis
|
Coefficients |
t value |
Sig. |
F value |
Sig |
Collinearity Statistics |
|||||
|
Independent Variable |
Dependent Variable |
Unstandardized Coefficients |
Standardized Coefficients |
34.89 |
0.00 |
Tolerance |
Variation Inflation Factor |
|||
|
B |
Standard Error |
Beta |
||||||||
|
Constant |
Total Premium(` Billion) |
251.39 |
651.74 |
0.386 |
0.711 |
|||||
|
Policies (in Lakhs) |
0.288 |
1.14 |
0.04 |
0.252 |
0.808 |
0.382 |
2.61 |
|||
|
Offices |
0.452 |
0.08 |
0.99 |
5.35 |
0.001 |
0.382 |
2.61 |
|||
The developed regression equation is as follows:
The Regression Equation= Y = a + β1 (X1) + β2(X2)
Where
Y= Dependent Variable (Total Premium)
a= Constant
β1=Unstandardized coefficient
β2= Unstandardized coefficient
X1= number of policies
X2=number of offices
Based on Table 7 we can derive the following equation:
Total premium =251.39+0.288(Number of Policies Issued) +0.452((Number of offices)
The value of t for policies (0.252, p=0.808) reveals that the number of policies issued has no statisticallysignificant impact on total premium at 5 per cent level of significance. It means that one unit increase in policies does not have any significant impact on total premium. Thus the null hypothesis that the total premium is independent of number of new policies issued stands accepted at 5 per cent level of significance. The t value for number of offices (5.35, p=0.00) depicts that the number of offices has significant direct impact on total premium at 5 per cent level of significance.Thus one unit increase in offices will increasetotal premium by ` 45.20 crore. Hence the null hypothesis that the total premium is independent of number of officesstands rejected and alternative hypothesis that the total premium is dependent on number of offices is acceptedat 5 per cent level of significance.
Impact of Number of Policies and Offices on Total Premium of Private Life Insurers
The multiple regression analysis is carried out to study the impact oftotal policies issued and total offices on total premium (dependent variable) of private life insurers. The Jarque-Bera test statistic confirms the normality ofresiduals (Table 8).To test that no autocorrelation exists in the data; Durbin-Watson statistic has been calculated. The Durbin-Watson statistic (1.34) shows that no auto correlation exists in the data. The value ofTolerance (0.63) and Variation Inflation Factor (1.56) shows that there is no Multicollinearity in the data. The multivariate analysis is presented in Tables 9 and 10.
Table 8: Level of Normality of Residuals for Private Life Insurer through Jarque-Bera Normality Test
|
|
2006-07 |
2007-08 |
2008-09 |
2009-10 |
2010-11 |
2011-12 |
2012-13 |
2013-14 |
2014-15 |
2015-16 |
|
Predicted Values |
318.18 |
475.86 |
707.25 |
741.23 |
841.41 |
927.25 |
854.20 |
834.83 |
864.60 |
842.31 |
|
Residual value |
-35.65 |
39.74 |
-62.28 |
52.45 |
40.23 |
-85.43 |
-70.22 |
-61.24 |
19.72 |
162.67 |
|
Jarque-Bera Statistic |
1.03, p=0.59 Normally distributed at 5 per cent level of significance. |
|||||||||
Table 9: Regression Statistics Model Summary and Calculated Value of Durbin-Watson
|
Regression Statistics Model Summary
|
Calculated Value of Durbin-Watson |
|||
|
R |
R Square |
Adjusted R square |
Standard error of the estimate |
|
|
0.929 |
0.864 |
0.825 |
87.77 |
1.34 |
Table 9 reveals that the value of R is 0.929whichdepicts that there is strong degree of correlation exists between dependent and independent variables. The calculated value of adjusted R square is 0.825.The value of adjusted R Square reveals that82.50 per cent variation in the total premium (dependent variable) is explained by two independent variables of the study.
The value of F (22.20, p=0.00) in Table 10 reveals that the model used in this problem is statistically significant. It means that the model of regression used to solve this problem is valid. To know the relative importance of each variable in the model, the value of t has been calculated and given in Table 10.
Table 10: Impact of number of offices and Policies on Total Premium of Private Life Insurers through Multiple Regression Analysis
|
Coefficients |
t value |
Sig. |
F value |
Sig |
Collinearity Statistics |
|||||
|
Independent Variable |
Dependent Variable |
Unstandardized Coefficients |
Standardized Coefficients |
Tolerance |
Variation Inflation Factor |
|||||
|
B |
Standard Error |
Beta |
22.20 |
0.00 |
||||||
|
Constant |
Total Premium(` Billion) |
338.90 |
121.57 |
2.78 |
0.02 |
|||||
|
Policies (in Lakhs) |
-5.59 |
1.03 |
-0.94 |
-5.42 |
0.00 |
0.63 |
1.56 |
|||
|
Offices |
0.13 |
0.02 |
1.10 |
6.35 |
0.00 |
0.63 |
1.56 |
|||
The developed regression equation is as follows:
Y = a + β1 (X1) + β2(X2)
Where
Y= Dependent Variable
a= Constant
β1=Unstandardized coefficient
β2= Unstandardized coefficient
X1= number of policies
X2=number of offices
Based on Table 9 we can derive the following equation:
Total Premium =338.90+ (-5.59) (Number of Policies Issued) +0.13((Number of offices)
The value of t for policies is-5.42 (p=0.00) which shows that that the number of policies issued has significant inverse impact on total premium at 5 per cent level of significance. Thus one unit increase in policies will lead to decreasein total premium by `559 crore. Hence the null hypothesis that the total premium is independent of number of new policies issued stands rejected and alternative hypothesis that the total premium is dependent on number of new policies issued is accepted at 5 per cent level of significance. On the other hand thevalue of t for offices is (6.35, p=0.00) which depicts thatthe number of officeshas direct impact on total premium at 5 per cent level of significance. It means that with one unit increase in offices, the total premium increases by `13 crore. Thus the null hypothesis that the total premium is independent of number of officesstands rejected and alternative hypothesis that the total premium is dependent on number of offices is accepted at 5 per cent level of significance.
Impact of Number of Policies and Offices on Total Premium of Life Insurance Industry
Before conducting the regression analysis for life insurance industry, theassumption of normality of residuals has been confirmed through Jarque-Bera Normality test (Table 11). There is no auto correlation exists in the data which is confirmed through Durbin-Watson statistic (1.98). The value ofTolerance (0.99) and Variation Inflation Factor (1.00) shows that there is no Multicollinearity in the data.
Table 11: Level of Normality of Residuals for Public Life Insurer through Jarque-Bera Normality Test
|
|
2006-07 |
2007-08 |
2008-09 |
2009-10 |
2010-11 |
2011-12 |
2012-13 |
2013-14 |
2014-15 |
2015-16 |
|
Predicted Values |
1594.69 |
2092.44 |
2662.82 |
2605.17 |
2727.45 |
2820.77 |
2647.04 |
2935.14 |
3570.66 |
3542.87 |
|
Residual value |
-33.94 |
-78.94 |
-444.97 |
49.28 |
188.92 |
49.93 |
224.96 |
207.86 |
-289.66 |
126.55 |
|
Jarque-Bera Statistic |
1.40, p=0.49 Normally distributed at 5 per cent level of significance. |
|||||||||
Table 12: Regression Statistics Model Summary and Calculated Value of Durbin-Watson
|
Regression Statistics Model Summary
|
Calculated Value of Durbin-Watson |
|||
|
R |
R Square |
Adjusted R square |
Standard error of the estimate |
|
|
0.937 |
0.877 |
0.842 |
250.64 |
1.98 |
The calculated value of R (0.937) in Table 12 shows that there is high correlation among variables of study. The value of adjusted R Square reveals that 84.20 per cent variation in the total premiumis caused by two independent variables used in this study.
The value of F (24.98) presented in Table 13 is significant at 5 per cent level of significance which shows thatthe regression model used in this problem is valid. The t-value presented in Table 13 is used to know the relative importance of each variable in the model.
Table 13: Impact of number of offices and Policies on Total Premium of Life Insurance Industry through Multiple Regression Analysis
|
Coefficients |
t value |
Sig. |
F value |
Sig |
Collinearity Statistics |
|||||
|
Independent Variable |
Dependent Variable |
Unstandardized Coefficients |
Standardized Coefficients |
Tolerance |
Variation Inflation Factor |
|||||
|
B |
Standard Error |
Beta |
24.98 |
0.00 |
||||||
|
Constant |
Total Premium(` Billion) |
294.21 |
612.67 |
4.07 |
0.0 |
|||||
|
Policies (in Lakhs) |
-4.24 |
0.87 |
-0.64 |
-4.85 |
0.00 |
0.99 |
1.00 |
|||
|
Offices |
0.19 |
0.04 |
0.61 |
4.65 |
0.00 |
0.99 |
1.00 |
|||
The developed regression equation is as follows:
Y = a + β1 (X1) + β2(X2)
Where
Y= Dependent Variable
a= Constant
β1=Unstandardized coefficient
β2= Unstandardized coefficient
X1= number of policies
X2=number of offices
Based on Table 9 we can derive the following equation:
Total Premium =294.21+ (-4.24) (Number of Policies Issued) +0.19((Number of offices)
Table 13 reveals that the value of t for total policies (-4.85, p=0.00) is significantat 5 per cent level of significance which means that new policiesissued has significant inverse impact on total premium of life insurance industry.It means that one unit increase in policies will lead to decreasein total premium of`424 crore. Hence the null hypothesis that the total premium is independent of number of new policies issued stands rejected and alternative hypothesis that the total premium is dependent on number of new policies issued is accepted at 5 per cent level of significance. Thevalue of t for offices is 4.65 (p=0.00) which shows thatthe number of total officeshas significant directimpact on total premium of life insurance industry at 5 per cent level ofsignificance.It meansthat one unit increase inoffices will enhance the total premium by `19 crore. Hence the null hypothesis that the total premium is independent of number of officesstand rejected and alternative hypothesis that the total premium is dependent on number of officesat 5 per cent level of significance.
The growth of life insurance industry is mainly assessed through the amount of premium income received and number of policies issued by the life insurance industry. After the entry of private players in the life insurance industry, the life insurance industry witnessed a remarkable growth in the total premium received in India. During the period of the study the total premium of the life insurance industry grew at the rate of 8.92 per cent. Sector-wise, the private sector recorded much higher growth of 13.52 per cent as compared to the growth of LIC of 7.62 per cent in terms of total premium. The inter-year variation was also found to be lesser in case of LIC than that of private players in case of total premium received for all the periods of the study. In case of total policies issued, the life insurance industry recorded a negative growth of 5.31 per cent during the period of the study. Although both public and private sector players also showed a negative growth in terms of policies issued but private sector players showed less negative growth as compared to public sector. The significant difference in the mean of total premium of public and private sector has been found at 5 per cent level of significance. Similarlythe significant difference in the mean of total policies of public and private sector has been found at 5 per cent level of significance. The study reveals that the life insurance industry has expanded itself mainly in the areas other than urban and metropolis. The same trend has been found in the public and public and private sector. The significant difference is found in the mean of number of offices set up in urban, metro and unclassified areas both for public and private sector as well as for life insurance industry. Therefore the life insurers should also expand in metro and urban areas in order to increase the reach of life insurance business in these areas.
The results of regression analysis depicts that the total policies issued by life insurance industry has significant but inverse impact on life insurance premium while number of offices has significant positive impact on total premium of life insurance industry. In case of public sector, the total policies issued have no statistically significant impact on total premium whereas the number of offices has significant and positive impact on total premium. In case of private life insurers, the total policies issued have significant inverse impact while offices have significant positive impact on total premium. Therefore, it is suggested that the life insurers should try to increase the number of policies by covering more people with life insurance. Moreover,IRDA should start mass campaign to educate people regarding the need of life insurance which will help the life insurance companies to tap untapped market.
References
1. .Rao, D. T., “Life Insurance Business in India: Analysis of Performance”, Economic and Political Weekly , Vol. 34, No. 31, Jul. 31 - Aug. 6, 1999, pp. 2174-2181.
2. Krishnamurthy, S, Moni, S.V., Jhaveri, Nani, Bakshi, Sandeep, Bhat, Ramesh, Dixit, M.R. and Maheshwari, Sunil “Insurance Industry in India- Structure Performance and Future Challenges”, Vikalpa , Vol. 30, No. 3, 2005, pp. 93-119.
3. Bhatia, B.S. and Sharma, Dhiraj, “India’s Growth Road through Services Sector: Review and Assessment,” contained in Management of Service Sector , Deep and Deep publication Pvt. Ltd., New Delhi, 2008, p. 22.
4. Singh, Raghbir and Garg, Arunesh, “Insurance the way of Success”, contained in Management of Services Sector by Bhatia, B.S, Deep and Deep publication, New Delhi, 2008, pp. 29-36.
5. Pasricha, G.S. and Arora, R.S., “Life Insurance Industry in India: Current Scenario”, Apeejay Journal of Management and Technology, Vol. 4, No 2, July 2009, pp. 120-131.
6. .Rajindren, R. and Natrajan, B., “The Impact of LPG on Life Insurance Corporation of India (LIC)”, Asia Pacific Journal of Finance and Banking Research , Vol. 3, No. 3, 2009, pp. 41-52.
7. .Pasricha, Singh, Gursharan, Performance of Life Insurance Corporation of India (LIC) - An Appraisal, a Ph.D. thesis submitted to Faculty of Business Studies, Punjabi University Patiala, 2009.
8. Selvakumar, M., and Priyan, Vimal, J., “Indian life Insurance Industry: Prospect for Private Sector,” The Journal of Insurance Institute of India, January- June 2010, pp. 52-57.
9. Chaudhary, Sonika and Kiran, Priti, “Life Insurance Industry in India - Current Scenario,” International Journal of Management and Business Studies, Vol. 1, Issue 3, September 2011, pp. 146-150.
10. Arif, Mohd., “Life Insurance Industries in India: Trends and Patterns”, European Academic Research, Vol. II, Issue 11, February 2015, pp. 14105-14122.