Pacific B usiness R eview I nternational

A Refereed Monthly International Journal of Management Indexed With THOMSON REUTERS(ESCI)
|
Dr. Debasish Joddar Assistant Professor Department of Economics Vidyasagar Evening College University of Calcutta, India |
Worldwide expansion of microenterprise development programme as a strategy for rural development through sustainable livelihood by raising the level of financial support under microfinance calls for an in-depth evaluation of the questions of sustainability and desired impacts of these programmes. Under this perspective, the study attempts to measure as well as compare the level of sustainability of micro enterprises and understand the performance of sustainable enterprises by investigating efficiency. Comparing the level of sustainability among Survival-oriented enterprises and Growth-oriented enterprises through the score of Composite Sustainability Index it can be concluded that sustainability suffers most for Survival-oriented enterprises and least for Growth-oriented enterprises. The findings also suggest that more than 97% of sustainable microenterprises have performed at higher level of scale efficiency.
Key Words: Sustainability, Efficiency, Microfinance, Microenterprise, Development.
Micro credit, as a tool of rural development through the development of micro enterprises, was introduced to the economy as a means of non-farm sources of income. The rural non-farm economy plays a significant role in providing employment and income for the poor in the land-scarce developing countries. As a consequence of worldwide change with the introduction of liberalization and globalization and of course market integration of the economy coupled with the increase in population pressure in the developing countries, the growth in agricultural production cannot absorb the increasing rural labour force in agricultural employment. At the same time, the urban industrial sector cannot grow fast enough to absorb the surplus labour released from agriculture. Thus, the issue of development of microentrepreneurship through microfinance has gained momentum in the development policy dialogue of Third World Economies since the year 2000 with the announcement of Millennium Development Goals (MDGs) by the United Nations Organisation (UNO).
As far as Indian Economy is concerned, poverty coupled with inequality is a perennial problem since the ancient days. The situation did not change much even after the journey of about seven decades. It has been observed that the two third of the Indian are the rural people and obviously majority of them are poor, especially women, SCs and STs, suffering from deprivation. Poverty that leads to a lower standard of living has prompted our policy makers to adopt poverty alleviation policies, primarily for income generation and also for target oriented measures as a part of Indian economic development and planning process. But most of the policies that have been taken during twelve five years planning are not effective in accordance with their targets. This is perhaps due to absence of internal coherence of the social, environmental, cultural and regional factors. Even after the enactment of new economic policy or liberalization and the repeated failure of percolation theory of development have led to vast inequalities and thus the significance of the aforesaid issues seems to be very important.
Sustainability is a multi-dimensional concept which varies within differing contexts. It has different dimensions like financial or economic, social, cultural, legal, environmental, technological, etc. The sustainable development is referred to as “economic development that meets the needs of the present generation without compromising the ability of future generations to meet their own needs (WCED, 1987). Thus, in the context of global development agenda, two vital aspects of sustainability emerge: economic and environmental sustainability. Sustainable development bears a lot of importance to the developing nations due to the greater role of public policy to generate secured livelihoods through productive employment. Most of the people in developing countries are entrenched by the “Vicious Circle of Poverty” due to lack of access to financial institutions, either for credit or savings. Microfinance serves as a means to empower as well as to uplift these vulnerable people, and provides a valuable tool to assist economic development process in a balanced manner.
The concepts of ‘sustainable’ and ‘enterprise’ can be defined separately but it becomes very difficult to agree on a common definition of what ‘sustainable enterprise’ really means. The promotion of sustainable enterprises is also a wide-ranging subject according to size, sector and spatial dimensions of enterprises. Sustainable development of an enterprise is a dynamic process that can be defined as “ adopting business strategies and activities that meet the needs of the enterprise and its stakeholders today while protecting, sustaining and enhancing the human and natural resources that will be needed in future” (Deloitte and Touché, 1992 cited in Kinderyte, 2011). This dynamic ongoing process is about strengthening the institutions and governance systems which nurture enterprises by ensuring that human, financial and natural resources are combined equitably and efficiently to facilitate innovation and productivity (ILO, 2007). On the other hand, these enterprises are part of our society; therefore, they shape and are shaped by the communities in which they operate. Thus, the sustainability of entrepreneurship and sustainability of enterprise are complementary to each other. In order to measure the performance of production units irrespective of their size, it is inevitable to consider all the aspects of both enterprise and entrepreneur simultaneously. The task of sustainability measurement is the guidance for enterprises as well as entrepreneurs for achieving the better level of sustainability but not the solutions of their problem of unsustainability. There is no such available model depending on which a firm can became more sustainable. Therefore, the empirical studies are to integrate various tools into sustainability measurement model. In doing such measurement, some attributes of both enterprise and entrepreneurs are difficult to evaluate in terms of either qualitative or quantitative units. Therefore, the assessment methodology has been developed including both quantitative and qualitative aspects concurrently (Szekely et al., 2005; Diakaki et al. 2006; Kinderyte, 2010 and 2011; Staniskis and Arbaciauskas, 2009).
The study has focused its attention mainly on the determinants of sustainability from existing literature. Moreover, the study has tried to examine the theory of microentrepreneurship on different dimensions and to relate with other contemporary approaches. After considering theoretical ideas, the study has made a conceptual model of sustainability of microenterprises by combining different attributes of both enterprise and entrepreneurs.
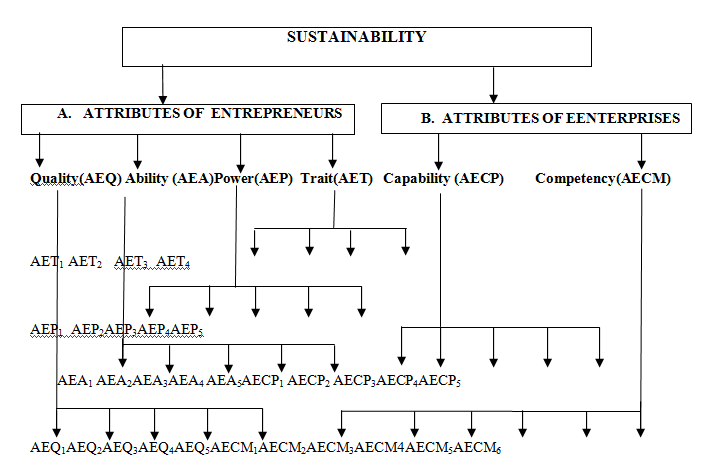
Schematic Representation of Attributes
A) Attributes of Entrepreneurs
I. Attributes of Entrepreneurial Quality (AEQ)
1. Education (AEQ1)
2. Training and Experience (AEQ2)
3. Knowledge of Book-keeping (AEQ3)
4. Scientific Knowledge (AEQ4)
5. Family Background (AEQ5)
II. Attributes of Entrepreneurial Ability (AEA)
1. Perform Basic Duties (AEA1)
2. Resolve Conflict (AEA2)
3. Analytical Skill (AEA3)
4 Negotiations and Communication Skill (AEA4)
5. Leadership (AEA5)
III. Attributes of Entrepreneurial Power (AEP)
1. Innovative Power (AEP1)
2. Decision Making Power (AEP2)
3. Risk Taking Power (AEP3)
4. Marketing Power (AEP4)
5. Bargaining Power (AEP5)
IV. Attributes of Entrepreneurial Trait (AET)
1. Self-Confidence (AET1)
2. Attitude (AET2)
3. Commitment (AET3)
4. Ethical View (AET4)
B) Attributes of Enterprises
V. Attributes of Capability to Start Enterprise (AECP)
1. Pre Start-up Market Survey (AECP1)
2. Support Services (AECP2)
3. Supply of Raw-Materials (AECP3)
4. Nature of Output (AECP4)
5. Competitiveness (AECP5)
VI. Attributes of Competency of Enterprise (AECM)
1. Competency in Operation (AECM1)
2. Competency in Use of Marketing Tools and Costs (AECM2)
3. Competency in Use of Finance (AECM3)
4. Competency in Application of Pricing Method (AECM4)
5. Competency in Application of Production Technique (AECM5)
6. Competency in Use of Growth Potential (AECM6)
Conceptual Model of Composite Sustainability
Rural microenterprises are small, informal and privately owned by poor people and exclude crop production by convention. The entrepreneurs have only rudimentary skills in management; technologies used are a mix of traditional and modern; access to capital is often a limitation, as is market access and the level of employment, ranging up to 10 workers (Nair,1998).Though it is not easy to define the concept of sustainability, various social thinkers expressed the concept from different points of view. Sustainability is permanence (Navajas,et.al 2000). It matters because society cares about the poor now as well as for the future (Schreiner, 2000). Its dimensions include continued flow of benefits, longevity and ability to cover recurrent cost and institutional capacity and performance (Ereda, 2007). Sustainable development implies that the progress in poverty reduction would be lasting and households would not depend on external support (Conning, 1999). World Business Council for Sustainable Development (WBSCD) defines sustainable entrepreneurship as the “continuing commitment of business to behave in an ethical way and contribute towards economic development while improving the quality of life of the workforce, their families, and the local and global community, as well as future generations”. Thus, the concept sustainability has different dimensions - financial or economic, social, political, cultural, legal, environmental and technological (ILO, 2007). But, it should be mentioned here that in most of the research undertaken in this field environmental sustainability is not so important. This is perhaps due to the nature of the livelihood microenterprises operated in rural areas which usually have little harmful effects on the environment (IDB, 2003).
As far as Indian microentrepreneurship is concerned, a study examining the sustainability of microenterprises in Orissa have found that due to the availability of technological training and support services provided to the entrepreneur, the microenterprises set up by the members of the SHG promoted by NGOs and banks were more viable and sustainable as compared to those formed by District Rural Development Agency (DRDA) in the state. However, it was also recognized that often institutional and programme sustainability is achieved at the cost of the poor borrowers (Kumaran, 2002).Solanki (2008), in the study on rural artisans of India, expressed his views that unorganized sectors would be sustainable through the government intervention through the provision of training, interaction meets, technical education, marketing facilities, social security, etc, to them. Guha (2010), in her study, opined that in order to achieve sustainability, it is necessary to continue group membership. She has also estimated financial viability of investment of rural non-farm sector by the estimation of return rate on investment. Banerjee and Duflo (2011) have discussed on cost effectiveness of rural micro enterprises of 18 countries, by comparing marginal return and overall return on investment of capital. Samphantharak and Townsend (2012) have investigated the indicators of productivity in their analysis and finally explained the return on assets (ROA) from household enterprise as crucial for understanding the wellbeing and productivity of households in developing economies. World Bank Research Development Group (Khandker, et al. 2013) has tried to measure the growth in microenterprise sector in Bangladesh, through estimation of rate of return on investment. To assess the causality between credit access and productivity of microenterprise sector, Khalily and Khaleque (2013) have shown that return on investment is the best indicator of performance. The important point mentioned here is that all of these studies have identified an inverse relation between rate of return and size of investment in their research findings.
The research method may be qualitative and/or quantitative depending on the goal of the researcher. Scientific research operates at two levels; theoretical level i.e. inductive research and empirical level i.e. deductive research. The goal of inductive research is to infer the theoretical concepts and patterns from observed data, whereas in deductive research the goal of the researcher is to use empirical data to check the concepts and patterns known from theory (Bhattacharjee, 2012).
4.1 Objectives of the Study
From the previous analysis it is clear that worldwide expansion of microenterprise development programme as a strategy for rural development through sustainable livelihood by raising the level of financial support under microfinance programmes, calls for an in depth evaluation of the questions of sustainability and desired impacts of these programmes.
In the light of the above research question, the objectives of the study are –
i) to measure as well as to compare the level of sustainability of micro enterprises and
ii) to understand the performance of sustainable enterprises by investigating efficiency.
4.2 Sampling Design
We have selected West Bengal for our present study on the ground that although microfinance movement was initiated later in this state as compared to the southern states of India, it has gained a momentum quickly and has secured its position in the schedule of priority states in India. The Micro and Small Enterprise sector (MSE) in West Bengal is one of the key sectors in the State’s economy. After the introduction of MSMED Act 2006, the process of registration was replaced with the filing of Entrepreneur Memorandum (EM).
The nineteen districts under four industrial zones of West Bengal have been classified into three categories (high, medium and low) according to the concentration of EM in the districts during the year 2012-13. For this study, 6 districts ( Howrah, Hooghly, North 24 Paraganas from Howrah Zone; Birbhum from Durgapur Zone; Coochbehar from Siliguri Zone and Nadia from Berhampur Zone) have been selected in such a way that at least one district is included from each of the four industrial zones of West Bengal as well as from each of the three groups of concentration. The selected microenterprise owner households for survey are those who have been operating for at least five years or more. The selection has been done keeping in mind that most major categories of unorganized rural microenterprises were captured in the primary survey. Thus, the districts have been chosen purposively.
At the next step, we have selected 12 blocks from the above mentioned 6 (six) districts and 25 (12*2+1) Gram Panchayats (GP) under these 12 blocks on the basis of simple random sampling method. Finally, 1000 [i.e. 40 * 25 GP] households have been randomly selected from 25 GPs. The household survey, thus, has been conducted on the basis of simple random sampling method.
4.3 Methods of Data Collection
The Primary data were collected with the help of a structured questionnaire through direct interview at the household level. The questionnaire was formulated keeping the theoretical foundation of the study in mind. Data collection had been done in two stages, pilot survey (on 50 households) and final survey (on 1000 households).
Structure of the Questionnaire
In both sets of questionnaires, the questions were grouped into different modules. The modules of the first set (for core group) were as given below.
I) Household Identification (district, block, GP, etc.)
II) Demographic Particulars (name, age, sex, education, etc.),
III) Particulars of Enterprise (memorandum status or others, product type, use of labour and raw materials, etc.),
IV) Entrepreneurs’ Profile (personality, traits, ability, power, etc.),
V) Household Status (asset, amenities, access, etc.).
4.4 Research Tools
The present study had used some research tools to facilitate the evaluation process.
In order to assess the level of “sustainability of microenterprises”, the following tools were used.
1. Identification of indicators:
Thirty indicators (e.g. financial, human capital and socio-economic) under six attributes of the enterprise and the entrepreneur have been identified in order to assess the sustainability of the micro enterprises. These six (6) main attributes are –
(i) entrepreneurial quality in terms of education, training and experience, knowledge of book keeping, scientific knowledge and family background(Haynes, 2000; Kumar, 1990),
(ii) entrepreneurial ability to perform basic duties including the ability to resolve conflict(Ketkar et al., 2012; Colings and Mellahi, 2009; Havinal, 2009; Haynes, 2000),
(iii) entrepreneurial power implying powers of innovation, decision making, risk taking, marketing and bargaining(Krizner, 1997; Drucker, 1985; Knight, 1967),
(iv) entrepreneurial trait that includes self confidence regarding self-efficiency, optimistic attitude(Harper,2002; Haynes, 2000; Kumar, 1990),
(v) capability to start an enterprise (Ketkar et al., 2012; Kumar, 1990)and
(vi) competency of the enterprise highlighting on operational competency, competency in the use of marketing tools and techniques, in the use of finance, in the use of pricing method etc.(Baran and Velickaite,2008; Haynes, 2000) .
2. Construction of ‘Sustainability Indices’ and the “Composite Sustainability Index” (CSI ):
The attributes are specific on the basis of 30 characteristic indicators that qualify entrepreneurs as well as enterprises. Every qualitative indicator of sustainability has been measured in the five-point Likert Scale: very high (5), high (4), medium (3), fair (2) and low (1). All the attributes leading to sustainability are assumed to have equal weights (i.e., exogenous weights). The sustainability index has been determined by aggregating these 30 indicators under six attributes. The study assumes that if the level of sustainability is greater than or equal to 4 (80% or more), the enterprises would be considered to be “highly sustainable”. If the level of sustainability is less than 4 but greater than 3 (60% or more but less than 80% of the scale), the enterprises would be regarded as “moderately sustainable”. Otherwise, the enterprises would be considered as “unsustainable” (having lower level of sustainability), having an index value less than 3.However, the method of assigning equal weights in the indicators has often been criticized for its arbitrariness. Practical experience tells us that all the indicators do not have equal weights, and equal weighting implies perfect substitutability between components of a composite index. The statistical technique such as the Principal Component Analysis (PCA) provides a convenient way of aggregating the indicators into a composite index where the weights assigned to the indicators are determined ‘endogenously’ on the basis of the given data set (Dunteman, 1989; OECD, 2008; Mehta. and Siddiqui, 2005-06; Hotelling, 1933).
The PCA has been used in the present study in two stages to determine the composite index of sustainability. At the first stage, with the help of PCA, six (6) sub-indices have been constructed on the basis of 30 indicators (which have been treated as variables in PCA) of sustainability by dividing these into 6 categories according to their nature of relation with the enterprise and the entrepreneur. These indices include-Entrepreneurial Quality Index (EQI), Entrepreneurial Ability Index (EAI), Entrepreneurial Power Index (EPI), Entrepreneurial Trait Index (ETI), Enterprise Capability Index (ECPI) and Enterprise Competency Index (ECMI). Finally, in the second stage, Composite Sustainability Index (CSI *) is determined on the basis of the value of the above six sub-indices.
3. Measurement of efficiency:
On the basis of the score of sustainability index some enterprises have been identified as ‘sustainable’ and some others as ‘unsustainable’. But after this identification one important question arises whether these identified sustainable enterprises have performed well with respect to productivity or efficiency i.e. is there any trade-off between sustainability and productivity or efficiency? To understand the performance of sustainable microenterprises, efficiency measurement was carried out. Producers or enterprises are said to be efficient if they have produced as much as possible with the inputs they have actually employed and/or if they have produced that output at minimum cost (Greene, 1997). The study has tried to measure the efficiency of sustainable microenterprises. In order to compare the efficiency among different type of activities, Scale Efficiency, Technical Efficiency and Pure Technical Efficiency have been measured by using non-parametric “Data Envelopment Analysis” method (Coelli, 1996).
4.5 Hypothesis
In order to fulfill the above objectives, the study assumes the following specific hypotheses:
a) The “growth-oriented” micro-enterprises are more sustainable compared to “survival-oriented” microenterprises.
b) The sustainable microenterprises are efficient.
4.6 Limitation & Scope of the Study
The study is limited by the size of samples. Primary data is the fundamental part of this empirical research, which is essential to fulfill the gap of the secondary data and to obtain the answers to the research questions. It was not possible to collect a large number of primary samples by the researcher as primary data collection is a time consuming and pain staking job. The concept of sustainability has multifaceted dimensions - financial or economic, social, political, cultural, legal, environmental and technological etc. But, it should be mentioned here that the study has considered all sorts of sustainability except the environmental one. Obviously, there is a scope of evaluating the extent of environmental sustainability of microenterprises in future research.
Sustainability
In order to compare the sustainability among different groups the sample microenterprises have been categorized according to –
(I) potential for growth of enterprises: subsistence/ survival-oriented and progressive/growth oriented and (II) nature of activities: animal husbandry, food processing, handicrafts, manufacturing, pottery-terracotta-clay modeling, readymade garments and service.
I. Potential for growth
The first category of microenterprises is most useful from the policy point of view with respect to their needs and the constraints they face. This classification is made between “subsistence” (survival-oriented) enterprises on the one hand and “progressive” (growth-oriented) enterpriseson the other. A “subsistence” enterprise is said to be one into which the entrepreneur is often pushed in the hope of earning an amount barely sufficient for mere subsistence. This may be due to death of the original entrepreneur (father/husband) or because there is no other way of earning. On the other hand, one is attracted or pulled into a “viable” enterprise as an entrepreneur by choice and by consideration of more profitable alternative (ADB, 1997).
Regarding category-I, it has been observed that 84.75% of sample enterprises belong to “subsistence” group and only 15.25% of sample enterprises are in the group of “progressive. In Table 1, we have discussed percentage distribution of enterprises with different levels of sustainability. Here, the CSI* shows that the “growth-oriented” enterprises are more sustainable compared to the “subsistence” enterprises. It shows that 49.2% of growth-oriented enterprises are highly sustainable, which is almost thrice as much as the percentage of highly sustainable enterprises (only 13.6%) belonging to the other group. On the other hand, while only 11.5% of growth-oriented enterprises are unsustainable, almost half (49.0%) of the subsistence group are so. It is also seen (Table 1) that the total percentage of sustainable enterprises (i.e. with high and medium value of the CSI*≥3) is as high as 88.5% for the growth-oriented group compared to that (51%) of the subsistence-group of enterprises. The same pattern is also discernible for all sub-indices. As far as average value of indices are concerned (Table 2), two sub-indices (EAI and ETI) of growth- oriented enterprises are high (4.23 and 4.18) while four others are moderate with none in the low category, while for the “survival-oriented” enterprises three of the six sub-indices are moderate with the other three in the low category (Table 2). Thus, the study supports the hypothesis that the “growth-oriented” microenterprises are more sustainable compared to “survival-oriented” microenterprises. Thus the “growth-oriented” or “progressive” enterprises seem to perform well, in terms of both average value of indices and percentage of sustainable enterprises compared to “survival-oriented” (“subsistence”) enterprises. This significant though expected, disparity between the two types of enterprises arises due to better entrepreneurial quality, ability and power of progressive entrepreneurs with “growth-oriented” enterprises and the fact that these enterprises enjoy a high degree of capability and competency.
Percentage Distribution of Enterprises with Different Levels
Sustainability for Survival-oriented and Growth-oriented Enterprises
|
Percentage
Indices |
Survival-oriented Enterprises |
Growth-oriented Enterprises |
||||||
|
Total |
High |
Moderate |
Low
|
Total |
High |
Moderate |
Low |
|
|
EQI |
100 |
16.2 |
40.7 |
43.1 |
100 |
45.9 |
44.3 |
09.8 |
|
EAI |
100 |
31.0 |
29.2 |
39.8 |
100 |
77.0 |
18.1 |
04.9 |
|
EPI |
100 |
20.4 |
27.7 |
51.9 |
100 |
59.0 |
26.2 |
14.8 |
|
ETI |
100 |
33.6 |
36.9 |
29.5 |
100 |
68.9 |
24.5 |
06.6 |
|
ECPI |
100 |
08.0 |
24.4 |
67.6 |
100 |
34.4 |
41.0 |
24.6 |
|
ECMI |
100 |
02.4 |
21.8 |
75.8 |
100 |
19.7 |
49.2 |
31.1 |
|
CSI* |
100 |
13.6 |
37.4 |
49.0 |
100 |
49.2 |
39.3 |
11.5 |
Source: Sample Survey
Level of Indices: High ≥ 4; 3 ≤ Moderate < 4; Low < 3
Table-2
Average Level of Sustainability of Enterprises into
Survival-oriented and Growth-oriented Enterprises
|
Average Indices |
Survival-oriented Enterprises |
Growth-oriented Enterprises |
||||
|
High |
Moderate |
Low |
High |
Moderate |
Low |
|
|
EQI |
- |
3.05(3) |
- |
- |
3.93(3) |
- |
|
EAI |
- |
3.20(2) |
- |
4.23(1) |
- |
- |
|
EPI |
- |
- |
2.98(4) |
- |
3.88(4) |
- |
|
ETI |
- |
3.44(1) |
- |
4.18(2) |
- |
- |
|
ECPI |
- |
- |
2.71(5) |
- |
3.63(5) |
- |
|
ECMI |
- |
- |
2.56(6) |
- |
3.31(6) |
- |
|
CSI* |
- |
3.00 |
- |
- |
3.86 |
- |
Source: Sample Survey
Level of Indices: High ≥ 4; 3 ≤ Moderate < 4; Low < 3
Figures in parentheses indicate rank of sub-indices
II. Nature of activities
In this category, enterprises are subdivided on the basis of the nature of microenterprise activities. It includes seven types of micro enterprise activities, namely: i) animal husbandry; ii) food processing; iii) handicrafts; iv) manufacturing; v) pottery-terracotta-clay modelling; vi) readymade garments and vii) service.
It may be observed (Table 3) that in terms of percentages of sustainable enterprises, manufacturing enterprises rank first (73% = 27% high + 46% medium) followed by service (66%) ; enterprises belonging to animal husbandry follows last (with the CSI* ≥ 3) equaling only 43%. Handicrafts, food processing, readymade garments and pottery-terracotta-clay modeling ranking from 2 to 5 are bunched near each other having sustainable enterprises (CSI*≥ 3) varying between 51% and 56%.
It is interesting to note here that the percentage of highly (CSI *≥4) sustainable enterprises of pottery is highest (28.2%) though it secure only the sixth position as far as percentage of CSI * rank (in terms of sustainable enterprises) is concerned. This disparity arises due to various reasons. One reason may be that the whole pottery- microenterprises are dichotomized into two distinct types. One small but significant group is characterized by highly developed infrastructure and are managed by skilled and competent entrepreneurs producing higher quality and exportable goods. These are often highly sustainable, progressive and profitable. This group is of course smaller in number of enterprises. The larger part of the enterprises, however, seems to belong to the group with low technology, semi-skilled, small scale of operation which are operated only at the subsistence level. As a result, almost half (49%) of these activity type are unsustainable.
As far as the average level of sustainability (Table-4) is concerned, manufacturing enterprises are in the first (CSI*=3.40) position followed by the other six types of enterprises – service (3.27), handicrafts (3.14), pottery-terracotta-clay modeling (3.06), food processing and readymade garments (3.05) and animal husbandry (2.92) in descending order. The findings suggest that all types of enterprises except the enterprise of animal husbandry (CSI*<3) scored the moderate level (3≤ CSI*<4) of sustainability. The poor performance of animal husbandry, food processing and others is due to their employment of lower capital, lower marketing ability
and poor scientific knowledge under own account enterprises. It is also remarkable to note that the manufacturing enterprises stood first not only in terms of the value of CSI* but also in terms of the value of almost all sub-indices. The distinguishing feature of manufacturing enterprises arises due to its growth oriented nature, large scale production, use of modern technique and efficient marketing of products.
|
Indices
Enterprises |
Level of Sustainability
|
EQI |
EAI |
EPI |
ETI |
ECPI |
ECMI |
CSI* |
Rank (Sust. Entp. in %) |
|
Animal Husbandry |
High |
16.2 |
21.6 |
18.9 |
27.0 |
02.7 |
00.0 |
13.5 |
7 (43.2)
|
|
Moderate |
29.7 |
29.7 |
27.0 |
37.9 |
32.4 |
27.0 |
29.7 |
||
|
Low |
54.1 |
49.7 |
54.1 |
35,1 |
64.9 |
70.1 |
56.8 |
||
|
Total |
100 |
100 |
100 |
100 |
100 |
100 |
100 |
||
|
Food Processing |
High |
20.4 |
37.0 |
27.8 |
38.9 |
07.4 |
03.7 |
14.8 |
4 (55.6) |
|
Moderate |
37.0 |
31.5 |
29.6 |
31.5 |
29.6 |
16.7 |
40.8 |
||
|
Low |
42.6 |
31.5 |
42.6 |
29.6 |
67 |
79.6 |
44.4 |
||
|
Total |
100 |
100 |
100 |
100 |
100 |
100 |
100 |
||
|
Handicrafts |
High |
20.7 |
35.7 |
25.0 |
35.7 |
14.3 |
04.7 |
19.3 |
3 (56.4) |
|
Moderate |
44.3 |
30.0 |
27.9 |
37.9 |
29.9 |
25.0 |
37.1 |
||
|
Low |
35.0 |
34.3 |
47.1 |
26.4 |
55.8 |
70.3 |
43.6 |
||
|
Total |
100 |
100 |
100 |
100 |
100 |
100 |
100 |
||
|
Manufacturing |
High |
24.3 |
51.4 |
29.7 |
56.8 |
16.2 |
02.7 |
27.0 |
1 (73.0) |
|
Moderate |
46.0 |
24.3 |
40.6 |
29.7 |
27.0 |
43.2 |
46.0 |
||
|
Low |
29.7 |
24.3 |
29.7 |
13.5 |
56.8 |
54.1 |
27.0 |
||
|
Total |
100 |
100 |
100 |
100 |
100 |
100 |
100 |
||
|
Pottery-Terracotta- Clay Modeling |
High |
30.8 |
35.9 |
35.9 |
38.5 |
20.5 |
02.6 |
28.2 |
6 (51.3) |
|
Moderate |
30.7 |
30.8 |
10.3 |
30.7 |
12.8 |
33.3 |
23.1 |
||
|
Low |
38.5 |
33.3 |
53.8 |
30,8 |
66.7 |
64.1 |
48.7 |
||
|
Total |
100 |
100 |
100 |
100 |
100 |
100 |
100 |
||
|
Readymade Garments |
High |
14.3 |
37.5 |
19.6 |
39.3 |
03.6 |
03.6 |
12.5 |
5 (53.6) |
|
Moderate |
46.4 |
19.6 |
25.0 |
32.1 |
30.3 |
16.0 |
41.1 |
||
|
Low |
39.3 |
42.9 |
54.4 |
28.6 |
66.1 |
80.4 |
46.4 |
||
|
Total |
100 |
100 |
100 |
100 |
100 |
100 |
100 |
||
|
Service |
High |
25.5 |
51.1 |
34.0 |
44.7 |
17.0 |
12.8 |
21.3 |
2 (66.0) |
|
Moderate |
38.3 |
19.1 |
25.6 |
36.2 |
23.4 |
27.6 |
44.7 |
||
|
Low |
36.2 |
29.8 |
40.4 |
19.1 |
59.6 |
59.6 |
34.0 |
||
|
Total |
100 |
100 |
100 |
100 |
100 |
100 |
100 |
|
Table-3
Percentage Distribution of Enterprises with Different Levels of
Sustainability for Various Types of Activities
Source: Sample Survey;
Level of Indices: High ≥ 4; 3 ≤ Moderate < 4; Low < 3
Sust.Entp.indicates sustainable enterprises (i.e. moderate + high).
Table-4
Average Level of Sustainability for Different Types of Activities
|
Indices Types of Enterprises |
EQI |
EAI |
EPI |
ETI |
ECPI |
ECMI |
CSI* |
|
Animal Husbandry |
2.86(L) |
2.99(L) |
2.97(L) |
3.30(M) |
2.80(L) |
2.61(L) |
2.92(L) |
|
Rank |
7(4) |
7(2) |
5(3) |
7(1) |
5(5) |
5(6) |
7 |
|
Food Processing |
3.05(M) |
3.33(M) |
3.19(M) |
3.46(M) |
2.77(L) |
2.52(L) |
3.05(M) |
|
Rank |
6(4) |
5(2) |
3(3) |
5(1) |
6(5) |
7(6) |
5.5 |
|
Handicrafts |
3.21(M) |
3.44(M) |
3.06(M) |
3.54(M) |
2.94(L) |
2.66(L) |
3.14(M) |
|
Rank |
4.5(3) |
3(2) |
4(4) |
3(1) |
2(5) |
3(6) |
3 |
|
Manufacturing |
3.41(M) |
3.78(M) |
3.47(M) |
3.94(M) |
2.99(L) |
2.83(L) |
3.40(M) |
|
Rank |
1(4) |
1(2) |
1(3) |
1(1) |
1(5) |
2(6) |
1 |
|
Pottery-Terracotta-Clay Modelling |
3.21(M) |
3.32(M) |
2.95(L) |
3.43(M) |
2.82(L) |
2.65(L) |
3.06(M) |
|
Rank |
4.5(3) |
6(2) |
7(4) |
6(1) |
4(5) |
4(6) |
4 |
|
Readymade Garments |
3.23(M) |
3.40(M) |
2.96(L) |
3.49(M) |
2.63(L) |
2.60(L) |
3.05(M) |
|
Rank |
3(3) |
4(2) |
6(4) |
4(1) |
7(5) |
6(6) |
5.5 |
|
Service |
3.29(M) |
3.57(M) |
3.35(M) |
3.73(M) |
2.83(L) |
2.84(L) |
3.27(M) |
|
Rank |
2(4) |
2(2) |
2(3) |
2(1) |
3(6) |
1(5) |
2 |
Source: Sample Survey; Level of Indices: High ≥ 4; 3 ≤ Moderate < 4; Low < 3
Figures in parentheses indicate ranks in row wise (intra enterprise rank of sub-indices)
Figures in bold indicates rank in column wise (inter enterprise rank of particular sub-index)
Efficiency of Sustainable Enterprises
On the basis of the score of sustainability index some enterprises have been identified as ‘sustainable’ and some others as ‘unsustainable’. But after this identification one important question arises whether these identified sustainable microenterprises have performed well or not. In order to evaluate the performance of a production unit, “efficiency” measurement is commonly used. Thus, in this sub-section the study will go through a measurement of efficiency of sustainable microenterprises.
Technical efficiency of sustainable microenterprises is calculated by assuming both CRS and VRS technology. The results (Table-5) show that 35.7% of animal husbandry enterprises are technically efficient (TE=1) followed by pottery-terracotta-clay modelling, manufacturing, service, readymade garments, food processing and handicrafts activities. This indicates that all of the enterprises with TE=1 are efficient under both CRS and VRS i.e. they are operating at their optimal scale irrespective of the scale. In addition, 71.6% of handicraft enterprises are lying in the region of IRS in the production frontier followed by animal husbandry, pottery-terracotta-clay modelling and food processing, manufacturing, readymade garments and service related enterprises. Moreover, results (Table-5) suggest that around 64% enterprises of both service and readymade garments are in the region of DRS, followed by enterprises of food processing, manufacturing, handicrafts, pottery-terracotta-clay modelling and animal husbandry .It implies that the enterprises may be too small in their scale of operation for which they might fall within IRS part of the production frontier. In the same way, the enterprises may be too large and they may operate within the DRS part of the production frontier. Therefore, in both of these cases, to improve the efficiency (or to reach on the CRS frontier) of these enterprises scale of operations should be changed i.e. changes should be made in scale of operations by keeping same input mix (Coelli et al., 2005).
Table- 5
Distribution of Various Types of Activities under Different Returns to Scale
|
Activities Returns to Scale |
Animal Husbandry |
Food Processing |
Handi- Crafts |
Manu- facturing |
Pottery-terracotta-clay modeling |
Readymade Garments |
Service |
|
CRS |
05(35.7) |
03(10.0) |
05(6.8) |
05(27.8) |
05(31.3) |
06(18.2) |
06(19.4) |
|
IRS |
08(57.1) |
15(50.0) |
53(71.6) |
07(38.9) |
08(50.0) |
06(18.2) |
05(16.1) |
|
DRS |
01(7.2) |
12(40.0) |
16(21.6) |
06(33.3) |
03(18.7) |
21(63.6) |
20(64.5) |
|
Total |
14(100) |
30(100) |
74(100) |
18(100) |
16(100) |
33(100) |
31(100) |
Source: Primary Survey
Figures in Parentheses Indicate Percentage
The average level of efficiency (SE, TE and PTE), Standard Deviation (SD) and Coefficient of Variation (CV) have been presented in Table-6 and accordingly the Figure-1 for CV of enterprises under different categories has been drawn. It is also worthwhile to mention that the mean efficiency for SE, TE and PTE of sustainable enterprises under ‘manufacturing’ is the highest having the least variation, followed closely by the sustainable enterprises under ‘pottery-terracotta-clay modeling’ whereas the sustainable enterprises under ‘handicrafts’ enterprises have the least mean efficiency and maximum variation. Moreover, the sustainable enterprises belonging to ‘pottery-terracotta-clay modelling’ category have turned out to be the most efficient as well as consistent when compared by coefficient of variation (CV) of SE; those under ‘manufacturing’ enterprises have been found to be the most efficient and most consistent ,when compared by CV of technical and pure technical efficiency. Average output-oriented PTE suggests that enterprises under ‘manufacturing’ activities can increase their revenue by only 3% with existing level of input through the efficient utilization, followed by animal husbandry(4%), pottery-terracotta-clay modelling (7%), service (10%), food-processing(14%), readymade garments (15%) and handicrafts (30%). On the other hand, the average of value of TE has been observed to be greater than or equal to 0.90 for sustainable enterprises operating under ‘manufacturing’, ‘pottery-terracotta-clay modelling’ and ‘animal husbandry’; average TE almost lying between 0.75 to 0.85 for ‘readymade garments’, ‘food-processing’ and ‘services’ related enterprises and it is only 0.6 for ‘handicraft’ enterprises. It signifies the fact that technical inefficiency occurs to some extent in some types of activities due to higher pure technical inefficiency rather than scale inefficiency among all types of enterprises.
Thus, the summary of findings indicates that all types of sustainable microenterprises are scale efficient at optimal level or the efficiency in the “frontier region” (SE ≥ 0.9) but there exists pure technical inefficiencies to some extent in few microenterprise activities. According to performance in respect of efficiency, the growth-oriented enterprises “manufacturing” and “pottery-terracotta-clay modelling” seem to perform well, perhaps due to larger amount of investment, use of skilled hired labour, large scale of operation and use of modern technique. As far as ‘handicraft’, ‘food processing’ and ‘readymade garments’ are concerned, the enterprises are subsistence in nature and in most of the cases entrepreneurs are female. Most of the activities where female entrepreneurs are engaged are lagging behind in terms of application of modern production technique.
Table-6
Distribution of Mean and CV of SE, TE and PTE of Various Types of Activities
|
Activities Mean |
Animal Husbandry |
Food Processing |
Handi- Crafts |
Manu- facturing |
Pottery-terracotta-clay modeling |
Readymade Garments |
Service |
|
Mean –SE |
0.94 |
0.90 |
0.89 |
0.98 |
0.97 |
0.97 |
0.95 |
|
SD |
0.075 |
0.141 |
0.136 |
0.039 |
0.033 |
0.054 |
0.067 |
|
CV |
8.0 |
15.7 |
15.3 |
4.0 |
3.4 |
5.6 |
7.1 |
|
Mean-TE |
0.90 |
0.77 |
0.61 |
0.95 |
0.90 |
0.82 |
0.85 |
|
SD |
0.110 |
0.163 |
0.185 |
0.056 |
0.087 |
0.115 |
0.114 |
|
CV |
12.2 |
21.2 |
30.3 |
6.0 |
9.7 |
14.1 |
13.4 |
|
Mean-PTE |
0.96 |
0.86 |
0.70 |
0.97 |
0.93 |
0.85 |
0.90 |
|
SD |
0.065 |
0.166 |
0.205 |
0.046 |
0.091 |
0.123 |
0.102 |
|
CV |
6.8 |
19.3 |
29.3 |
4.8 |
9.8 |
14.5 |
11.3 |
Source: Authors calculation
Figure-1: CV of SE, TE and PTE of Various Types of Activities
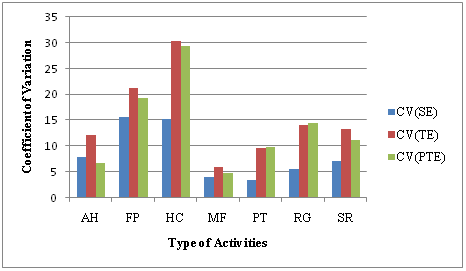
Source: On the basis of table 7
AH: Animal Husbandry, FP: Food Processing, HC: Handicrafts, MF: Manufacturing,
PT: Pottery-Terracotta-Clay Modelling, RG: Readymade Garments and SR: Service.
The basic objective of the study has been to examine the performance of microenterprises in West Bengal in terms of sustainability and efficiency. To understand the performance of enterprises the study has revisited the issue from different viewpoints.
The study basically supports the criticism that a small business owner is not a “natural entrepreneur” – rather they are the “self employed”. Actually, they are forced to engage in self-employment in absence of a more conventional employment opportunity. Obviously self-employment has some possible benefits to help the poor but in most of the cases, it is the way of “ salvation rather than solution ”. As a result, the pattern of job creation has shifted to more casual, part-time employment and has become more insecure. Development of sustainable micro entrepreneurship and modernization of traditional rural enterprises perhaps have been considered as ideal paradigm to uplift the rural masses by reducing their vulnerability. Thus, the policy recommendations should be specifically formulated to increase the level of sustainability of microenterprises that would help the entrepreneurs’ households to attain a decent way of living. Some of these strands of a policy package are presented here:
i. In order to enhance employment opportunity through development of microentrepreneurship and to ensure longevity the microenterprise development projects should be designed regionally or even better, locally, as per the requirements and constraints of not only different sectors but also different subsectors within sectors and activities within subsectors.
ii. The provision of repeat loans and even consumption loan to the tiny entrepreneurs during their emergencies and a variety of financial services to the non-borrowers should necessarily be included in the policy.
iii. The training programmes should be reoriented and repackaged in such a way that survival-oriented subsistence entrepreneurs can be upgraded in terms of productivity through the implementation of product diversification and modern production techniques, or even sometimes only by simple tips like do’s and don’ts regarding entrepreneurship.
iv. Finally, as a consequence of world-wide change in technology, globalization and market integration of the economy, survival of microentrepreneurs facing a competitive market is a big challenge. Government should intervene by providing technical assistance, and market and other infrastructure at a reasonable cost to them that may help sustain them in the long run.
ADB, (1997). Microenterprise Development: Not by Credit Alone, Manila, Philippines: Asian Development Bank.
Baran, D. and Velickaite, R. (2008). Building the Theoretical Framework of Entrepreneurship , Presented at 5th International Scientific Conference on Business and Management,Vilnious Lithuania, 16-18 May 2008.
Banerjee, A.B and Duflo, E. (2011). Poor Economics. Noida , India: Random House.
Bhattacherjee, A. (2012). Social Science Research: Principles, Methods, and Practices , Textbooks Collection. Book 3, University of South Florida, USA: Scholar Commons, downloaded from http://scholarcommons.usf.edu/oa_textbooks/3 , accessed on 2nd January, 2014.
Coelli, T. J. (1996). A guide to DEAP version 2.1: A data envelopment analysis (computer) program (Working paper 96/8). Armidale, Australia: Centre for Efficiency and Productivity Analysis, University of New England.
Collings, D. G. & Mellahi, K. (2009). ‘Strategic Talent Management: A Review and Research Agenda’. Human Resource Management Review , 19 (4), 304–313.
Conning, J. (1999). Outreach, Sustainability and Leverage in Monitored and Peer- monitored
Lending. Journal of Development Economics , 60, 51-77.
Drucker, P.F. (1985 ) . Innovation and Entrepreneurship–Practice and Principles .New York: Harper and Row.
Dunteman, G. H. (1989). Principal Components Analysis. Quantitative Applications in the Social Sciences .USA: Sage Publications.
Ereda, A.K.(2007). Outreach and Sustainability of the Amhara Credit and Saving Institution (ACSI) (A Master Thesis). Norway:Department of International Environment and Development Studies, Norwegian University of Life Sciences, Retrieved from http://www.umb.no/statisk/noragric/publications/master/2007_adeno_kidane_ereda.pdf
Greene, W.H., (1997 ).Econometric Analysis (5th Edition). New Jersey: Prentice Hall.
Guha,S. (2010). Microfinance for Micro Enterprises:An Impact Evaluation of Self Help Groups (Occasional Paper, 55).Mumbai: NABARD.
Harper, M. (2002). Promotion of Self Help Groups under the SHG Bank LinkageProgramme in
India , Paper presented at the seminar SHG Bank Linkage Programme, New Delhi, 2002.
Mumbai: NABARD.
Havinal,V. (2009). Management and Entrepreneurship . New Delhi: New Age International (P) Limited Publishers.
Haynes, W. (2000). Principles of Management and Entrepreneurship Development. Kolkata: New Central Book Agency Limited.
Hotelling, H. (1933). Analysis of a Complex of StatisticalVariables into Principal Components. Journal of Educational Psychology , 24(6&7), 417-441 and 498-520.
Inter-American Development Bank, (2003). Guidelines for Environmental and Social Impact Due Diligence for IDB Microenterprise Operations , Washington DC: MSME Division, Sustainable Development Bank (IDB).
International Labour Organization, (2007). The Promotion of Sustainable Enterprises -Sixth item on the agenda, (Report-VI on Internationl Labour Conference -96th Session), Geneva-Switzerland: ILO office.
Jackson, S.E. & Schuler, R.S. (1995).Understanding Human Resource Management in the Context of Organizations and their Environments. Annual Review of Psychology , 46,237- 264.
Ketkar, S., Kock, N.,Parente, R. &Verville, J. (2012).The impact of individualism on buyer–supplier relationship norms,trust and market performance: An analysis of data from Brazil and the U.S.A.. International Business Review, 21(5), 782–793
Khalily, M. A. B. & Khaleque,M. A. (2013). Access to Credit and Productivity of Enterprises in Bangladesh: Is there Causality? (Working paper No. 20). Dhaka: Institute of Microfinance.
Khandker, S., Samad, H. A. & Ali, R. (2013 ). Does Access to Finance Matter in Microenterprise Growth? Evidence from Bangladesh (Policy Research Working Paper 6333).Washington, DC: World Bank.
Knight, K. (1967).A Descriptive Model of theIntra- Firm Innovation Process. Journal of Business, 40, 478-496.
Krizner, I. (1997). Entrepreneurial Discovery and the Competitive market Process: An Austrian Approach. Journal of Economic Literature , 35(1), 60-85
Kumar, S.A. (1990).Entrepreneurship in Small Industry, New Delhi: Discovery.
Kumaran,K.P.(2002).Role of SHGs in Promoting Microenterprises through Microcredit: an Empirical Study. Journal of Rural Development , 21(2), 231-250.
Mehta. A. C. & Siddiqui, S.A.(2007). Educational Development Index (EDI): A Suggsestive Framework forComputation .New Delhi: Department of Educational Management Information System, National University of Educational Planning and Administration.
Nair, T.S. (1998). Meeting the Credit Needs of the Microenterprise Sector: Issues in Focus. Indian Journal of Labour Economics , 41(3), 531-538.
Navajas, S., Schreiner, M., Meyer, R., Gonzalez-Vega, C. &Rodriguez-Meza, J. (2000). Microcredit and the Poorest of the Poor:Theory and Evidence from Bolivia. World Development, 28 (9), 333-346.
OECD, (2008). Handbook on Constructing Composite Indicators-Methodology and User Guide. Paris:OECD-JRC, European Commission.
Samphantharak, K. &Robert M. T. (2012).Measuring the Return on Household Enterprise: What Matters Most for Whom? Journal of Development Economics, 98 (1), 58-70.
Schreiner, M. (2000). Ways Donors can helpthe Evaluation of Sustainable Organization. Savings and Development , 24(4), 423-437.
Solanki, S.S. (2008).Sustainability of Rural Artisans. Economic & Political Weekly, 43(19),24-27.
WCED (World Commission on Environment and Development), (1987). Our Common Future: The Brudtland Report , Oxford, England: Oxford University Press.