Pacific B usiness R eview I nternational

A Refereed Monthly International Journal of Management Indexed With THOMSON REUTERS(ESCI)
|
Mohammad Amir Golshani Department of Accounting Kermanshah Branch Islamic Azad University Kermanshah, Iran |
Babak Jamshidinavid Department of Accounting Kermanshah Branch Islamic Azad University Kermanshah, Iran E-mail:- jamshidinavid@iauksh.ac.ir |
This research investigated the effect of business (commercial) strategy on stock values of selected corporations listed in Tehran Stock Exchange. The population of study has 856 corporations listed in Tehran Stock Exchange, while 142 corporations have been selected by systematic deletion. The time period of the study was from 2012 to 2016. The research is empirical in term of its objective and the data is quantitative. Paneling data method is used based for data collection. Research findings indicate that business (commercial) strategy has meaningful effect on the stock values of the corporations. The study concluded that this effect is positive and direct. The research findings suggest that investors and board of corporations should create supervision plans to have more control on the stock values. They should decrease free cash flows and prevent more investment as excess investment represents a kind of inefficiency.
Keywords: Business (Commercial) Strategy, More Investment, Risk of Stock Price Downfall.
Organization status in industry determined by its profit and an organization which can earn higher profits from its competitors can be stated in better situation in the industry. Moreover, the organization even with unsuitable structure can have high capital return rate.
The competitive advantages of a firm vary as per their structure in each industry. Moreover, different strategies of companies are formed on the basis of trends in the industry or market. The various dimensions of organization in the competitive industry usually results in these three strategies: presentation of the cheapest product to market or cost leadership, Offering different products or variety of products/options available for customers and niche marketing i.e. concentration on a particular part of a market with specific price or variety of product. Investors and creditors need the information to buy, sell or hold the stocks and for giving credit to the corporations. The most important information source for investors and creditors is financial credibility. Each rational decision maker will increase its investment to gain more profit. So, profit is a basic element that affects users` decisions of financial statements. Profit will depict the actual performance of the corporations during financial period of report; moreover, profit is a base of many decisions, evaluation models and stock pricing. Profit on sales and on capital in the financial statement is seen as important parameter for the investor while making decisions. Whereas whenever there is change in the methods of accounting or discrepancies in the financial statement then such companies should be treted with utmost consciousness. The investors and creditors should not concentrate only on profit for taking the decisions. They should investigate the profits and other financial information of corporations in relation to its strategies formulated and the market reactions for the same. These strategies can be performed in different forms such as; increase in operational profit, increase in non-operational profit and etc. Haten & et.al. (2009), believed that in situation of lack of total divulgence in financial reporting (performance to profit management), managers have motivations to keep their occupations with hiding some parts of losses. This process is not divulge of real losses until managers present in corporation continues. After managers leaves corporation, vast mass of non- divulged losses will enter to market that will cause to stock price downfall. In this circumstance this question will be introduced as: How business (commercial) strategy affects the investment decision and stock values?
Rafie Nezhad & Lazemi (2015), in their research investigated relationship between managers` more self-confidences and risk of stock price downfall in the accepted corporations of Tehran Stock Exchange. This research has investigated the effect on managers` self-confidence and risk of cash stock downfall. 132 corporations among the accepted corporations in Tehran Stock Exchange had been chosen as the research statistic samples from 2006 to 2012. The research conclusions indicated that in the research investigating time, managers` with more self-confidence would cause risk of stock price downfall.
Davoodi & Mobaraki (2015), in their research investigated and categorized effective factors on risking behavior of real investors in Tehran Stock Exchange by use of data coverage analytical technique. In this research effective factors on risking of real investment in Tehran Stock Exchange were investigated and categorized. Chosen factors were clarified by experts` discussion about stock exchange and stock market, they were divided into three total clusters such as; personality factors with four components of education, income, age and sex, economical- political factors with flour components of trust to government politics, market consistency, liquidity increase and inflation increase, cultural-social factors with three components of family structure, married status and believing and religious intentions. This research statistic population included all real investment in Tehran Stock Exchange but 57 individual were chosen randomly because of limitation. Questionnaire was used to gather data and data coverage analytical technique and GAMS software were used to categorize factors and analyze data. Research conclusions indicated that factors such as inflation, sex, liquidity were more important effect than income, market constancy and believing and religious intentions on risking of competitors in capital market.
Kafashpoor (2014), in his research investigated the effect of opposition competitive strategies and cost leadership on performance by considering inductor role of pioneer marketing and reaction marketing (case study: big producing corporations and medium industrial towns of Mashhad). The research methodology was analytical- measuring and application oriented. Questionnaire was used to gather data. Then Cronbach Alfa coefficient had been calculated to clarify correlation of each locution (gap) with total score. Research statistic population included all the medium corporations and big industrial town of Mashhad. Sampling design was accidental and simple sampling was used. AMOS software was used to analyze data of 104 respondents collected via questionnaire that represented opposition strategy and cost leadership had direct and meaningful relationship with performance. Moreover, these strategies had positive meaningful relationship with performance through reactional marketing and pioneer marketing.
Tahmasebi & et.al. (2014), in their research investigated strategy of cost optimized management leadership that had been introduced by exhibiting of management in keeping and repairing. This system had been described in three separate parts such as; management, operation and universal net equipment management. Moreover, process of net adoption improvement had been studied as an important sub-collection of universal net system. The research findings indicated that suggested system owned considerable opposition than common systems. It was nearer to system of universal quality management and all organization employees had active partnerships in it. Moreover, suggested system had more advantage based on its emphasis on decimal, adoption improvement and net continuous improvement. Totally, it seemed that management strategy in universal net had relationship not only with net software service but also with other important factors such as; quality, customer satisfaction and financial value.
Risk of fluctuations in Stock value:
If a corporation stock price decreases in investigating year severely, that corporation stock price will fall in that year. While, it may be possible that severe fall in stock price is because of the overall downturn in the market. Public status of market should be considered and severe decrease of stock market should be defined by market return, (Heaten & et.al. 2009).
Different types of Business (Commercial) Strategies:
Cost Leadership Strategy
The aim of cost leadership strategy is that corporation should be a low cost production in an industry. Cost leadership strategy will be realized by experience business, investment in loans of mass production, use of economy and accurate supervision on operational total expenses, (by programs such as; size decrease and management quality), (Kafashpoor, 2014).
Product Variety Strategy
This strategy focuses on production of variety of products or unique services by reliance on customer loyalty to commercial sign. A corporation can exhibit higher quality, better performance, or unique characteristics that each of them can justify higher prices. In strategy of production difference, corporations intend to invest in research and development so that; innovative products can be produced. Moreover, in the strategy of production difference corporations will encounter with more confidence. More emphasis on innovation and variety in production can cause corporation to tap the untouched market and increase their profitability. Commercial units always encounter with more investment situations and they need rational decisions about an optimized investment. In fact, investment of each commercial unit should be done in attention to its limitations of bases and its efficiency. However, the main problem is choice of designs and decisions about investment situations by mangers of commercial units that are done based on personal beneficiaries. In the otherwise, information asymmetry and opposition of beneficiaries can stop an optimized investment. So, commercial units should consider limit or amount of investment in attention to limitations of sources for investment in different designs. This factor is done by investment in one or several designs while it can be justified that pure potential value of the design is positive. So, acceptance of designs with negative pure potential value will caused more investment and non-optimized investment, (Saghafi & et.al. 2010).
First Main Hypothesis
Business (Commercial) Strategy has a meaningful effect on investment decision and risk of stock prices downfall.
Subordinate Hypotheses
Business (Commercial) Strategy has a meaningful effect on investment decision.
Business (Commercial) Strategy has a meaningful effect on risk of stock prices downfall.
The Way of Variables` Measuring
Corporate Strategies
Corporate strategies include cost leadership strategy and product variety strategy.
Cost leadership Strategy: it is received from ratio of total sale to total assets.
Product Variety Strategy: it is received from research and development gathered ratio to total sale.
Risk of Stock Price Downfall (CRASH)
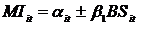
To measure risk of stock price downfall, Hooton Model (2009) will be used. If a corporation encounters this situation one or several times during one financial year, it will be called stock price downfall. Model Hooton (2009), will be as follow:
rjt= β0 + β1 rm,t-2 + β2 rm,t-1+ β3 rm,t+ β4 rm,t+1+ β5rm,t+ 2+ ɛit
In the above model:
rji= stock return of j corporation in t duration
rm,t= indicator return of total market stock in t duration
ϵit= remained of regression model
β= model coefficient
After estimation of above regression model and exist of model regression remains for each corporation, following model will be used to determine downfall durations.
Wit = In(1+ɛit)
Stock season returns use to calculate above estimations and calculations. If w of j corporation is lower than quarter, considered duration will be knows as stock downfall duration, (Moradi & et.al. 2006).
Investment decision
Investigating background of previous studies for more investment determination indicates that most of the researchers use following model to estimate more investment, for example; Yang & Jeiange (2008), follows Richardson (2006) and Bidel & et.al. (2009), with considering capital market level of China in comparison with capital markets of advanced countries used regression model of multi variables with several controlling variable for measuring of more investment. In Iran, Tehrani & Hesarzadeh, (2008), analyzed sensitivity of variables to find suitable variables that can be descriptors of investors. In this research used of Yang & Jeiange (2008), and Tehrani & Hesarzadeh (2008), models were used. In this research, more investment was calculated by the following formula:
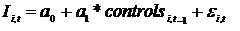
Lit= represents investment of i corporation in t year. In this research, investment has been considered as payment cash flow of i corporation to gain or make fixed assets, unobvious assets or other ling-term assets and it will divided on total assets of the begging of duration to remove the effect of errors. The researches that have been done about using this criterion as an investment measuring criterion are included: Richardson (2006), Verdi (2006), Bidel &Hilar (2006), Yang & Jeiange (2008), Bidel & et.al. (2006), Li & Vange (2010), Chen & et.al. (2011) and in Iran Tehrani & Hesarzadeh (2008).
Control is a synonym for controlling variable and controlsi,t-1 include following factors:
Cashi,t-1 = is reserved cash flow. In this research it is defined as cash flow calculation ratio and short term investment of i corporation in t-1 year to total assets in t-1 year that represents liquidity amount and ability of corporation performance, (Jenses 1986, Yang & Jeiange 2008, Chen & et.al. 2011, Tehrani & Hesarzadeh 2008, Mehrani & Bagherzadeh 2008).
Growi,t-1= it indicates corporation investment opportunities that is calculated by market value ratio to clerical value of assets at the end of duration of i corporation in t-1 year. Bidel & Hilar (2006), believe that corporation growth opportunity should justify corporation investments. Namazi & Zeratgari (2008), believe that this ratio has direct relationship with investment situations.
ROAi, t-1= it is ratio of pure profit and loss to total assets of i corporation in t-1 year. This ratio represents corporation profitability and it is representation of corporation future performance, (Yang & Jeiange, 2008).
Levi, t-1 represents ratio of liabilities to assets of i corporation in t-1 year and amount of corporation financial ability in liability payment, (Yang & Jeiange, 2008, Richardson, 2006).
Sizei, t-1= it is logarithm of i corporation total assets in t-1 year, this variable can be used to control risk. Corporation size is an important factor that effects on liability politics of corporations and risk of corporations, (Yang & Jeiange, 2008, Richardson, 2006).
ϵ Represents remainder, positive remainder indicates more investment and negative remainder represents less investment.
Research statistic population includes 856 corporations in Tehran Stock Exchange from 2011 to 2015, while 142 corporations have been selected for the study by systematic deletion. The research is empirical in term of its performance aim, the data is quantitative and its performance time is sectional and past. The causal relationship has been investigated by using correlation.
Jark – Bera Test:
H0: Data collected for the study was normally distributed.
H1: Data collected for the study was not normally distributed.
Table 1: Jark-Bera Test
|
Description |
Statistic amount of Jark-Bera |
Description |
|
Business strategy |
1372.58 |
0.000 |
|
More investment |
8966.97 |
0.000 |
|
Risk of stock price downfall |
4146.26 |
0.000 |
Jarque-Bera Test is used to investigate normality of research variables. Conclusions of this research tests have been indicated in the above table. Based on this test, meaningful level is less than 0/05 and distribution of dependent variables is not normal. If time of sample measuring is big enough, deviation from normality will usually unimportant and its results will be less. In attention to central limit, it can be understood that in the absent of normality, test statistics will follow suitable distributions.
F Limer Test
In estimation of data paneling model, two total conditions will be introduced. The first status is that cross from origin is the same for all sections, so in this status data pooling model is appeared. In the second status, cross from origin is different for all sections and this status is called data paneling. To recognize these two statuses F-Limer Test should be used.
F Limer Test is used to choose between methods of paneling and modulation data. In F Limer Test, H0 is sameness of cross from origins (modulation data method) that is situated in front of non-sameness of cross from origins (paneling data method). This test conclusion indicates that mixture methods are more suitable. Conclusion of F Limer Test will be as:
Table 2: Conclusions of Chow Test
|
Method |
Test conclusion |
P-Value |
F-statistic |
Description |
|
Mixture (paneling)
|
H0 is rejected |
0.005 |
1.387 |
Research model |
|
Mixture (paneling)
|
H0 is rejected |
0.004 |
1.391 |
Research model |
As indicated in the above table method of mixture (paneling) data technique is used to estimate research models.
Husman Test (Choice between Fixed and Random Effects):
Husman Test is one of the most important tests in paneling studies and it is the second test after Chow test. If it is clarified in a test that for all sections or times in crosses pass origin separately, grouping fixed effect or random effect will be estimated by researcher. Then the choice between fixed effects or random effects can be done by Husman Test. The main hypothesis in fixed effect sample is that error member can be correlated with descriptive variables also by considering fixed error member in time (such as; individual sex that is not changed during time or individual color skin), but in random effect sample it is proposed that correlation doesn`t exist between error member with descriptive variables. Husman Test uses Kay-Du criterion. If probability of test is more than 0.05, in 95 percent meaningfulness level it can be said that random effect is more preferable that fixes effects.
Table 3: Conclusions of Husman Test
|
Description |
Kay-Du Statistic |
P-Value |
Test Conclusion |
Method |
|
Mixture (paneling)
|
3.940 |
0.047 |
H0 is affirmed |
Fixed effects |
|
Mixture (paneling)
|
3.666 |
0.055 |
H0 is affirmed |
Random effects |
Based on received conclusions of Husman Test, fixed effect method for the first model and random effect method for the second model is chosen by estimation of regression model.
Investigation of Research Hypotheses:
First Subordinate Hypothesis: Business (commercial) strategy has meaningful effect on more investment.
Zero hypothesis and contrast hypothesis in Spearman correlation test is as follow:

Table 4: Correlation Coefficient between Business (Commercial) Strategy and More Investment
|
variables |
More investment |
|
Correlation coefficient Business (commercial) strategy Meaningful level |
0.139 0.000 |
Based on received conclusions of above table, meaningful level of test is less than 0/05 and Spearman statistic sign is positive, so there is a positive and meaningful between business (commercial) strategy and more investment.
Second Subordinate Hypothesis: Business (commercial) strategy has meaningful effect on risk of stock prices downfall.
Table 5: Correlation coefficient between business (commercial) strategy and risk of stock price downfall
|
variables |
Risk of stock downfall |
|
Correlation coefficient Business (commercial) strategy Meaningful level |
0.139 0.000 |
Based on received conclusions of above table, meaningful level of test is less than 0/05 and Spearman statistic sign is positive, so there is a positive and meaningful between business (commercial) strategy and risk of stock downfall.
First Subordinate Hypothesis: Business (commercial) strategy has meaningful effect on more investment.
H0: Business (commercial) strategy doesn`t have meaningful effect on more investment.
H1: Business (commercial) strategy has meaningful effect on more investment.
Table 6: Regression Equation Coefficients
|
|
|||||
|
Dependent variable |
Independent variable |
B |
Error standard |
T test |
Meaningful level |
|
More investment |
BS |
0.816887 |
0.186887 |
4.355204 |
0.000 |
|
C |
0.017707 |
0.060450 |
0.292913 |
0.7697 |
|
|
Determination coefficient |
0.271 |
||||
|
Fisher amount |
1.484 |
||||
|
Fisher meaningful level |
0.000 |
||||
|
Watson-Durbin amount |
2.176 |
||||
|
|
|||||
In this hypothesis, determination coefficient amount is 0/271 and this amount represents that independent variable has 27 percent ability to prescribe independent variable. Watson-Durbin is used to investigate the independency of errors. While Watson-Durbin is from 1.5 to 2.5, correlation hypothesis between errors is rejected and regression can be used. In this hypothesis its amount is 2.17 which is situated in this distance. Meaningfulness level of Fisher Test is less than 5 percent and it means that model of this hypothesis is meaningful. In the above table, T test is less than 5 percent, so independent variables have effective abilities on dependent variable. While regression coefficient is meaningful for all variables, it can be concluded that business (commercial) strategy has meaningful effect on more investment.
Second Subordinate Hypothesis: Business (commercial) strategy has meaningful effect on risk of stock price downfall.
H0: Business (commercial) strategy doesn`t have meaningful effect on risk of stock prices downfall.
H1: Business (commercial) strategy has meaningful effect on risk of stock prices downfall.
Table 7: Regression Equation Coefficients
|
|
|||||
|
Dependent variable |
Independent variable |
B |
Error standard |
T test |
Meaningful level |
|
Risk of stock price downfall |
BS |
0.850464 |
0.136395 |
6.235288 |
0.000 |
|
C |
0.138872 |
0.064299 |
2.159797 |
0.0311 |
|
|
Determination coefficient |
0.05 |
||||
|
Fisher amount |
38.732 |
||||
|
Fisher meaningful level |
0.000 |
||||
|
Watson-Durbin amount |
1.798 |
||||
|
|
|||||
In this hypothesis, determination coefficient amount is 0/05 and this amount represents that independent variable has 5 percent ability to prescribe independent variable. Watson-Durbin is used to investigate the independency of errors. While Watson-Durbin is from 1.5 to 2.5, correlation hypothesis between errors is rejected and regression can be used. In this hypothesis its amount is 1.79 which is situated in this distance. Meaningfulness level of Fisher Test is less than 5 percent and it means that model of this hypothesis is meaningful. In the above table, T test is less than 5 percent, so independent variables have effective abilities on dependent variable. While regression coefficient is meaningful for all variables, it can be concluded that business (commercial) strategy has meaningful effect on risk of price downfall.
Table 8: summary of the research results
|
Received conclusions of the research hypotheses |
Amount (intensity) of effectiveness |
Dependent variables |
Independent variable |
|
H0 is rejected |
0/813 |
More investment |
Business (commercial) strategy |
|
H0 is rejected |
0/850 |
Risk of price downfall |
A corporation that has several SBU strategic units should attend to this point that each of the strategic commercial units needs cash flow, in the otherwise; each of the units has ability to create cash. In a non-centralized organization for managers who develop cash flow in commercial units it will be usual to have controls on cash flow of other existence commercial units. The main manager motivation of strategic commercial unit is growth and profitability and manager of each commercial unit should prepare himself to use all the investment opportunities that will cause his commercial unit growth. It may be possible that rapid growth of strategic commercial units can be followed by less profit or even damages, but the existence of powerful potential with frequent liquidity often protect from needed cash flows. It is suggested that they should follow non-centralized politics that persuade strategic commercial units to invest for their growth. One illogical reason is that strategic commercial units have products in their puberty levels, so they may not be suitable choices for investment and only because of frequent cash flow in these units they are invested yet. Profit as one of the main variables in accounting has an important role in decision making, (shareholders, creditors, analyst and other beneficiaries). Profit has important role in financial reporting (operational evaluation, anticipations of incomings and future cash flow in decision models such as; evaluation and etc.). Profit evaluation also has been emphasized as one of the main members of profit by professionals and academic researches. Based on the done researches, evaluation is one of the factors that can decrease risk of stock price downfall, so attention to effective factors on profit evaluation will be suggested for most users. Based on the research findings it is suggested that shareholders and boards of corporations should prevent from more investment, which is indicator of inefficiency in investment, by making more supervision plans to control and decrease cash flow amounts. It is suggested that management of corporations in their plans for reservation of cash flow attend to this point that accumulation of cash flow without return with avoidance aim of outside financial securement cost will decrease efficiency and value of corporation. Portfolio analysis will introduce suggestions about main line of investment strategies for each strategic commercial unit which are bases for business status evaluation and market interests.
- Tehrani, R. Hesarzadeh, R. (2008), “Role of cash flows and limitation in financial securement on more investment and less investment”, Accounting Researches, No. 4, p.p. 10-20
- Saghafi, A., Bolo, Gh., Mohammdian, M. (2010), “Accounting information quality, more investment and cash flow”, Magazine of Accounting Advances, Shiraz University, Third Duration, No. 2, p.p. 37-63, Magazine of Previous Social & Human Sciences
- Davoodi, A.R., Mobaraki, A.R. (2015), “Investigating and categorizing of effective factors on real investors` risking behaviors in Tehran Stock Exchange by use of dada coverage analytic technique, Magazine of Accounting, Financial Management and Economic Studies, Summer, Second Year, No. 2, p.p. 135-155
- Rafienezhad, A., Lazemi, S. (2015), “Investigating relationship of managers` more self-confidences and risk of stock price downfall in the accepted corporations of Tehran Stock Exchange” Magazine of Accounting, Financial Management and Economic Studies, Summer, Second Year, No. 2, p.p. 1-10
- Tahmasebi, R., Karbasizadeh, N., Shamoradifar, M., Ahmadibefrooei, M.R. (2014), “Leadership strategy of expense optimizing by exhibiting management model in reservation and repairing of organization eminence universal efficiency”, International Conference of New Incomings of Economic and Accounting Management researching
- Kafashpoor, A., Shabanboron, O. (2014), “Investigating the effect of difference competitive strategies and expense leadership on operation by considering marketing inductor role and reactional marketing, case study, big producing corporations and average industrial towns of Mashhad,”, M.A Thesis, Performance Mangement, University of Economic & Official Sciences
-Moradi, M., Falahi, M.M., Kami, M. (2006), “Investigating relationship between profit quality and profit reaction coefficient”, Magazine of Knowledge & Development (Scientific-Researching), 18th Year, No. 33
- Mehrani, S., Bagheri, B. (2008), “Investigating the effect of cash flows and institutional shareholders on profit management in the accepted corporations of Tehran Stock Exchange”, Accounting & Auditing Researchers, No. 2, First Year, p.p. 30-50
- Namazi, M., Zaraatgari, R. (2008), “Investigating Q-Toobin application and its comparison with other evaluation standards of managers` performances in the accepted corporations in Tehran Stock Exchange”, Magazine of Accounting Advances of Shiraz University
-Biddle, G.; and Hilary, G. (2006). “Accounting quality and firm-level capital investment”, The Accounting Review, vol. 81, pp. 963-982.
-Chen, L., Dasgupta, S., Sen, R., 2011. Discipline or disruption? Stakeholder relationships and the effect of takeover threat. Working Paper, Hong Kong University of Science and Technology.
-Hutton, A.P., Marcus, A. J. & Tehranian, H. (2009). Opaque financial reports, R2, and crash risk. Journal of Financial Economics, 94, 67-86.
-Jensen, M. C. (1986). “Agency costs of free cash flow, corporate finance and takeovers”, American Economic Review, vol. 76, pp. 323-329.
-Li, Q., Wang, T. (2010). Financial reporting quality and corporate investment efficiency: Chinese experience. Nankai Business Review International, 1 (2): 197-213.
-Richardson, S. (2006), “Over investment of free cash flow”, Review of accounting studies, Vol. 11, pp. 159-189.
-Verdi, R. (2006). “Financial reporting quality and investment efficiency”, Unpublished PhD Dissertation, Faculties of the University of Pennsylvania in Partial Fulfillment, OR Working paper, (on line: www.ssrn.com).
-Yang, J.; and Y. Jiang. (2008). “Accounting information quality, free cash flow and Overinvestment: A Chinese study”, The Business Review, Vol. 11, pp. 159-166.