|
Mr. Tanu Aggarwal Research Scholar Amity University Noida, Sector-125, Noida, Uttar Pradesh 201313 Contact No.:- 9015957880 E-mail:- tanuaggarwal35@gmail.com |
Dr. Priya Soloman CFA(Faculty) Amity University Noida, Noida, Uttar Pradesh 201313 D-788 Saraswati Vihar Pitampura New Delhi-110034 |
The Purpose of this study is to examine different lending interest rates for Real estate loans and on the other hand the influence of Real Estate advances on public sector banks in India by using Path Diagram (Using Maximum Likelihood Model) to analyze whether it leads to Real Estate sector Development in India. The outcome of Maximum Likelihood model shows that there is no influence of Real Estate Advances on Public sector Banks. In other words Public sector banks is contributing less for Real Estate Sector development in India.
Keywords: Real Estate Advances, Interest Rates, Public Sector Banks, Amos, Path Diagram
Jel Codes: L85, R33, G21, C1, R45
The Real Estate Advances plays the pivotal role in the growth of the Real Estate Sector Development in India. The tax incentives given to the Real Estate Sector Finance by the government of India in the annual budget of 2001, the transactions related to the Real Estate buying and selling of the properties has been increased as compare to the other periods.
The buyers are basically the end-users rather than the investors as the new class of buyers are basically young and they have the knowledge of all the legal documents and approvals. As related to the economy of India the Real Estate sector has the capacity to generate the demand and income for the equipments, materials and services [1] .
The realty expansion in India has given a new face to the finance sector in India to the real estate advances. This helps the finance companies to provide the investment for Real estate sector development in India as they are facing competition but leads to increase in investment of the Real Estate Sector Development in India [2] .
The study related to the Real Estate Advances and Interest Rates of Public Sector Banks should be taken into consideration to know the aspects of banks in Real estate sector development in India.
The banks include State bank of India, Punjab National Bank, Canara Bank, Industrial Development bank of India (IDBI) and Indian Bank which provides Real estate advances for development of Real estate sector development in India has been taken into consideration for the study.
Amit Ghosh (2015) examined the real estate loans which reflect regional banking and economic conditions. The purpose of this paper is to examine state-banking industry specific as well as region economic determinants real estate lending of commercial banks across 51 states.
T. Mamata (2010) has analyzed the study on issues related to Housing Finance: an experience with State Bank of India. It highlights certain areas of the banker and customer in specific to state Bank of India in housing finance in comparison with competitors in housing industry and also focuses on recovery system followed by State bank of India.
Sumanta Deb (2012) studies the Indian real estate market and potential of House price Indices as an indicative Tool: Cases and Concepts. The study is based on the management in prices of real estate particularly residential housing is important to the market economy as well as individual household.
Anirudha Durafe and Dr. Manmeet Singh (2015) study the Banks capital buffer and business cycle: Evidence for India. The Regression analysis has been applied both to public and private sector banks which shows business cycle is having insignificant impact on the capital buffer but with different signs.
Dr S.K.S Yadav (2016) analyzes the Performance evaluation of Banks in India. The study is related to the examination of performance of consolidated operations of public and private sector banks in India.
Objectives of the Study:
· To Study the lending Rate of Interest on Real Estate Sector Loans provided by Public Sector Banks in India.
· To Study the influence of Real Estate Advances on Public Sector Banks(Development of Real Estate Sector) in India.
The research is descriptive [3] in nature. The data is collected from the research papers, reports. The data is based on the secondary sources. The sample banks include State bank of India, Punjab National Bank, Canara Bank, Industrial Development bank of India (IDBI) and Indian Bank which provide loans at different (lending) interest rates and real estate advances for the development of Real estate sector has been taken into consideration for the study.
Statistical Tools:
The Maximum Likelihood Model has been employed to study using regression and correlation of public sector Banks in relation to Real Estate Advances in India by using IBM SPSS Amos [4] .
Public Sector Banks Interest Rates for Real Estate Sector Loans in India:
State Bank of India
Table:1
|
Years |
MCLR |
Cash Credit |
Demand Loan |
Term Loan(for all tenures) |
|||
|
Rate of Interest |
Rate of Interest |
Rate of Interest |
|||||
|
Min |
Max |
Min |
Max |
Min |
Max |
||
|
2012 |
9.875 |
6.25 |
16.8125 |
4.875 |
15.875 |
4 |
17.3125 |
|
2013 |
9.8 |
7 |
17 |
6 |
16.45 |
4 |
17.55 |
|
2014 |
9.925 |
7 |
17.025 |
6 |
16.45 |
4 |
17.8 |
|
2015 |
9.675 |
7 |
17.05 |
6 |
16.45 |
4 |
17.95 |
|
2016 |
8.925 |
9 |
17.05 |
7.5 |
16.45 |
4 |
18 |
|
2017E |
9.0325 |
8.9 |
17.145 |
7.65 |
16.68 |
4 |
18.255 |
Source: Reserve Bank of India Database.
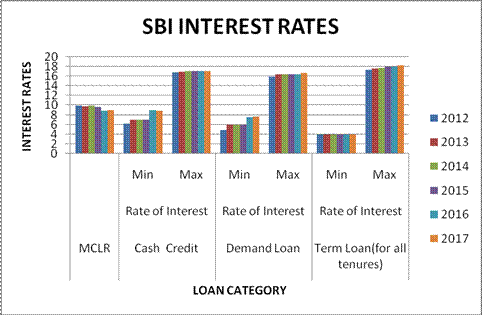
Interpretation:
The Marginal Credit Lending Rate(MCLR) and Rate of Interest shows the increasing trend for providing Loans for Real Estate Sector Development of India by State Bank of India. All the category of Loan interest Rates is showing an increasing trend.
Punjab National Bank
Table:2
|
Years |
MCLR |
Cash Credit |
Demand Loan |
Term Loan(for all tenures) |
|||
|
Rate of Interest |
Rate of Interest |
Rate of Interest |
|||||
|
Min |
Max |
Min |
Max |
Min |
Max |
||
|
2012 |
10.5 |
13.06 |
16.5 |
6 |
16.5 |
13.06 |
17.06 |
|
2013 |
10.25 |
12.75 |
16.25 |
6 |
16.25 |
12.75 |
16.75 |
|
2014 |
10.25 |
12.75 |
16.25 |
6 |
16.25 |
12.75 |
16.75 |
|
2015 |
9.96 |
12.4 |
15.9 |
5.71 |
15.9 |
12.4 |
16.46 |
|
2016 |
9.3 |
10.7 |
14.9 |
6.1625 |
13.9 |
10.7 |
15.3 |
|
2017 |
9.245 |
10.811 |
14.895 |
5.985 |
14.095 |
10.811 |
15.321 |
Source: Reserve Bank of India Database.
Graph:2
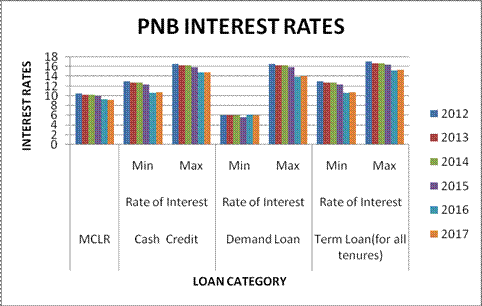
Interpretation:
The Marginal Credit Lending Rate(MCLR) and Rate of Interest shows the increasing trend for providing Loans for Real Estate Sector Development of India by Punjab National Bank. All the category of Loan interest Rates is showing an increasing trend.
IDBI Bank
Table:3
|
Years |
MCLR |
Cash Credit |
Demand Loan |
Term Loan(for all tenures) |
|||
|
Rate of Interest |
Rate of Interest |
Rate of Interest |
|||||
|
Min |
Max |
Min |
Max |
Min |
Max |
||
|
2012 |
10.5625 |
6.25 |
13.75 |
10 |
17.75 |
7.375 |
30.2 |
|
2013 |
10.25 |
3.6875 |
22.625 |
4.9675 |
25.6875 |
8.875 |
36 |
|
2014 |
10.25 |
4.9375 |
20.9375 |
8.2875 |
22.75 |
1 |
36 |
|
2015 |
10 |
6 |
24.6875 |
2.8075 |
21.0625 |
1 |
36 |
|
2016 |
9.2375 |
5 |
27.725 |
4.9125 |
22.25 |
1 |
36 |
|
2017 |
9.1 |
5.1 |
30.9 |
2.4 |
23.2 |
1 |
38.3 |
Source: Reserve Bank of India Database.
Graph:3
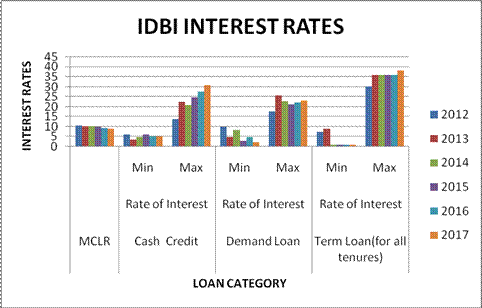
Interpretation:
The Marginal Credit Lending Rate(MCLR) and Rate of Interest shows the increasing trend for providing Loans for Real Estate Sector Development of India by Industrial Development bank of India(IDBI) . All the category of Loan interest Rates is showing an increasing trend.
Canara Bank
Table:4
Graph:4
|
Years |
MCLR |
Cash Credit |
Demand Loan |
Term Loan(for all tenures) |
|||
|
Rate of Interest |
Rate of Interest |
Rate of Interest |
|||||
|
Min |
Max |
Min |
Max |
Min |
Max |
||
|
2012 |
10.5 |
11.06 |
17.75 |
11.06 |
17.75 |
11.06 |
18.31 |
|
2013 |
10.1 |
10.78 |
17.16 |
10.78 |
17.16 |
10.78 |
17.16 |
|
2014 |
10.2 |
10.9 |
17.21 |
10.9 |
17.21 |
10.9 |
17.21 |
|
2015 |
9.9 |
10.15 |
16.96 |
10.15 |
16.96 |
10.15 |
17.525 |
|
2016 |
9.3 |
9.65 |
16.65 |
9.65 |
16.65 |
9.65 |
17.4 |
|
2017 |
9.2 |
9.4 |
16.4 |
9.4 |
16.4 |
9.4 |
17.08 |
Source: Reserve Bank of India Database.
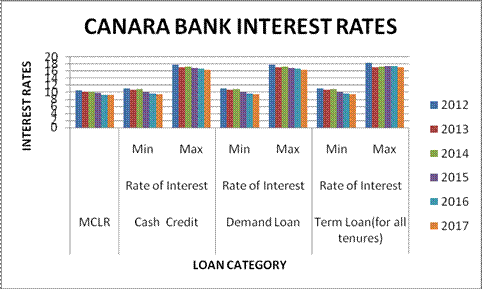
Interpretation:
The Marginal Credit Lending Rate(MCLR) and Rate of Interest shows the increasing trend for providing Loans for Real Estate Sector Development of India by Canara Bank. All the category of Loan interest Rates is showing an increasing trend.
Indian Bank
Table:5
|
Years |
MCLR |
Cash Credit |
Demand Loan |
Term Loan(for all tenures) |
|||
|
Rate of Interest |
Rate of Interest |
Rate of Interest |
|||||
|
Min |
Max |
Min |
Max |
Min |
Max |
||
|
2012 |
10.5625 |
7.9375 |
19.0625 |
10.5625 |
19.0625 |
7.9375 |
19.5625 |
|
2013 |
10.2 |
7 |
19.9 |
10.2 |
19.9 |
4 |
21.4 |
|
2014 |
10.225 |
7 |
19.9 |
10.225 |
19.9 |
4 |
21.4 |
|
2015 |
9.875 |
10.025 |
19.75 |
10.025 |
19.75 |
4 |
21.35 |
|
2016 |
9.425 |
9.725 |
19.6 |
9.725 |
19.6 |
4 |
21.3 |
|
2017 |
9.27 |
10.3 |
19.9 |
9.5 |
19.9 |
2.4 |
22.03 |
Source: Reserve Bank of India Database.
Graph:5
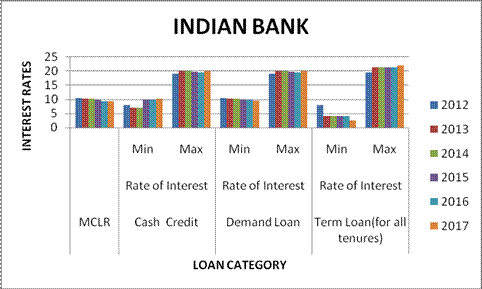
Interpretation:
The Marginal Credit Lending Rate(MCLR) and Rate of Interest shows the increasing trend for providing Loans for Real Estate Sector Development of India by Indian Bank. All the category of Loan interest Rates is showing an increasing trend.
Real Estate Advances by Public Sector Banks(In Million)
Table:6
|
Year |
SBI |
PNB |
IDBI |
CANARA |
INDIAN |
|
2011 |
1346235 |
426878 |
312913 |
164507 |
96519 |
|
2012 |
1446484 |
484746 |
367845 |
176850 |
123100 |
|
2013 |
1735864 |
524140 |
386369 |
157702 |
119404 |
|
2014 |
1911643 |
625422 |
427462 |
265547 |
149937 |
|
2015 |
2233885 |
648919 |
400381 |
294305 |
163657 |
|
2016 |
2636645 |
699958 |
429620 |
381489 |
187254 |
Source: Reserve Bank of India Statistics
Graph:6
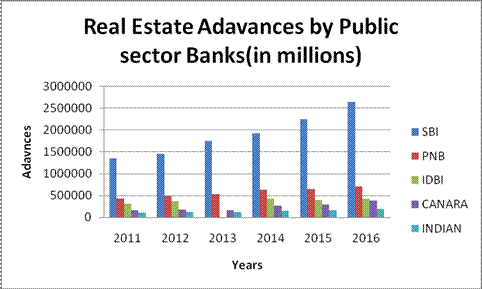
Interpretation:
The Year wise Real Estate Advances shown by State Bank of India, Punjab National bank, Industrial Development Bank of India, Canara Bank and Indian bank which is reflecting the increasing trend every year and is showing the growth of Real Estate Sector Development in India.
Graph:7
Path Diagram for Real Estate Advances by Public Sector Banks
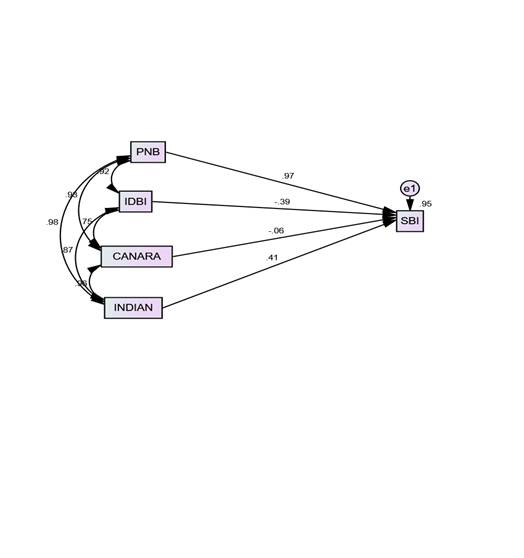 Interpretation:
The State Bank of India is dependent variable and Punjab National Bank, Industrial development Bank of India, Canara Bank, Indian Bank are independent variable which shows the relationship between dependent and independent variables through the use of the Maximum Likelihood Model. This model is adopted using SPSS Amos 21 version. The structural model fit shows that RMR(Root Mean Square Residual) is .097, GFI(Goodness of Fit Model) that is .231 which shows the best fit and Normal Fit Index(NFI), Relative Fit Index is 1 and comparative fit model shows the best fit for the model. They are all within acceptable limits which indicating the good fit.
Estimates (Group number 1 - Default model)
Scalar Estimates (Group number 1 - Default model)
Maximum Likelihood Estimates
Regression Weights: (Group number 1 - Default model)
Table:7
|
Estimate |
S.E. |
C.R. |
P |
Label |
|||
|
SBI |
<--- |
PNB |
4.472 |
2.886 |
1.549 |
.121 |
|
|
SBI |
<--- |
IDBI |
-4.420 |
3.780 |
-1.170 |
.242 |
|
|
SBI |
<--- |
CANARA |
-.318 |
2.639 |
-.120 |
.904 |
|
|
SBI |
<--- |
INDIAN |
6.103 |
9.884 |
.617 |
.537 |
Source: Authors Own Compilation
Interpretation :
The probability of getting a critical ratio as large as 1.549 in absolute value is .121. In other words, the regression weight for PNB in the prediction of SBI is not significantly different from zero at the 0.05 level.
The probability of getting a critical ratio as large as 1.17 in absolute value is .242. In other words, the regression weight for IDBI in the prediction of SBI is not significantly different from zero at the 0.05 level.
The probability of getting a critical ratio as large as 0.12 in absolute value is .904. In other words, the regression weight for CANARA in the prediction of SBI is not significantly different from zero at the 0.05 level.
The probability of getting a critical ratio as large as 0.617 in absolute value is .537. In other words, the regression weight for INDIAN in the prediction of SBI is not significantly different from zero at the 0.05 level.
It reflects that there is no influence on Real estate Advances on public sector banks of India. The other banks have also influence on Real estate advances in India.
Standardized Regression Weights: (Group number 1 - Default model)
Table:8
|
Estimate |
|||
|
SBI |
<--- |
PNB |
.970 |
|
SBI |
<--- |
IDBI |
-.394 |
|
SBI |
<--- |
CANARA |
-.058 |
|
SBI |
<--- |
INDIAN |
.414 |
Source: Authors Own Compilation
Interpretation:
When PNB goes up by 1 standard deviation, SBI goes up by 0.97 standard deviations.
When IDBI goes up by 1 standard deviation, SBI goes down by 0.394 standard deviations.
When CANARA goes up by 1 standard deviation, SBI goes down by 0.058 standard deviations
When INDIAN goes up by 1 standard deviation, SBI goes up by 0.414 standard deviations.
Covariances: (Group number 1 - Default model)
Table:9
|
Estimate |
S.E. |
C.R. |
P |
Label |
|||
|
PNB |
<--> |
IDBI |
3517842863.104 |
2329861489.688 |
1.510 |
.131 |
|
|
IDBI |
<--> |
CANARA |
2440840768.550 |
1817744738.222 |
1.343 |
.179 |
|
|
CANARA |
<--> |
INDIAN |
2378206578.495 |
1534283807.155 |
1.550 |
.121 |
|
|
IDBI |
<--> |
INDIAN |
1048456466.498 |
713667068.362 |
1.469 |
.142 |
|
|
PNB |
<--> |
CANARA |
7342089597.263 |
4822554566.798 |
1.522 |
.128 |
|
|
PNB |
<--> |
INDIAN |
2861158287.578 |
1829380177.029 |
1.564 |
.118 |
Source: Authors Own Compilation
Interpretation:
The probability of getting a critical ratio as large as 1.51 in absolute value is .131. In other words, the covariance between PNB and IDBI is not significantly different from zero at the 0.05 level (two-tailed).
The probability of getting a critical ratio as large as 1.343 in absolute value is .179. In other words, the covariance between IDBI and CANARA is not significantly different from zero at the 0.05 level (two-tailed).
The probability of getting a critical ratio as large as 1.55 in absolute value is .121. In other words, the covariance between CANARA and INDIAN is not significantly different from zero at the 0.05 level (two-tailed).
The probability of getting a critical ratio as large as 1.469 in absolute value is .142. In other words, the covariance between IDBI and INDIAN is not significantly different from zero at the 0.05 level (two-tailed).
The probability of getting a critical ratio as large as 1.522 in absolute value is .128. In other words, the covariance between PNB and CANARA is not significantly different from zero at the 0.05 level (two-tailed).
The probability of getting a critical ratio as large as 1.564 in absolute value is .118. In other words, the covariance between PNB and INDIAN is not significantly different from zero at the 0.05 level (two-tailed).
The p value shows that there is no effect of Real Estate Advances on public sector banks of India.
Correlations: (Group number 1 - Default model)
Table:10
|
Estimate |
|||
|
PNB |
<--> |
IDBI |
.915 |
|
IDBI |
<--> |
CANARA |
.751 |
|
CANARA |
<--> |
INDIAN |
.962 |
|
IDBI |
<--> |
INDIAN |
.871 |
|
PNB |
<--> |
CANARA |
.930 |
|
PNB |
<--> |
INDIAN |
.979 |
Source: Authors Own Compilation
Interpretations
The Correlation table shows that all of them are showing positive relation between them which reflects that all are positively correlated to each other.
Variances: (Group number 1 - Default model)
Table:11
|
Estimate |
S.E. |
C.R. |
P |
Label |
|||
|
PNB |
9337953680.121 |
5905840462.869 |
1.581 |
.114 |
|||
|
IDBI |
1581294457.220 |
1000098427.243 |
1.581 |
.114 |
|||
|
CANARA |
6680144840.210 |
4224894558.978 |
1.581 |
.114 |
|||
|
INDIAN |
915289656.248 |
578880006.508 |
1.581 |
.114 |
|||
|
e1 |
8995756442.083 |
5689415926.623 |
1.581 |
.114 |
Source: Authors Own Compilation
Interpretation
The probability of getting a critical ratio as large as 1.581 in absolute value is .114. In other words, the variance estimate for PNB, IDBI, Canara and Indian Bank is not significantly different from zero at the 0.05 level (two-tailed).
The P value shows that there is no influence of Real Estate advances on public sector Banks in India.
Squared Multiple Correlations: (Group number 1 - Default model)
Table:12
|
Estimate |
|||
|
SBI |
.955 |
Source: Authors Own Compilation
Interpretation
It is estimated that the predictors of SBI explain 95.5 percent of its variance. In other words, the error variance of SBI is approximately 4.5 percent of the variance of SBI itself.
The State bank of India, Punjab National Bank, Industrial Development Bank of India, Canara and Indian bank shows different lending interest rate for Real Estate Loans for different time periods. The influence of Real Estate Advances on public sector banks has been shown using amos 21 version which depict that there is no influence of Real estate Advances on Public Sector Banks in India. The result shows that public Banks sector is contributing less towards Real Estate sector development of India. The State Bank of India comes first for taking Real Estate Loans as it has less lending interest rates in comparison to other banks.
Deb Sumanata(2012),” Indian Real Estate Market and Potential of House price as a indicative tool: Cases and Concepts”, “IUP Journal of Managerial Economics”, Volume X Number 1 2012.
Durafe Anirudha and Singh Manmmet Dr (2015),” Bank Capital Buffer and Business Cycle: Evidence for India”, Anvesha Volume 8 Number 2, 2015.
Ghosh Amit (2015),” Do Real Estate Loans reflect Regional banking and economic conditions”, “Journal of Financial Economic Policy”, volume 8 Number 1 2016.
Mamata. T Kumar Pradeep. D. Dr (2010),” A study on isuues related to Housing finance: An experience with State Bank of India”, “Summer Internship Society”, Volume 2 Issue 1 October 2010.
Yadav S.K.S (2016), “Performance Evaluation of Banks in India”, “Sumedha Journal of Management”, Volume 5 Number 1 January- March 2016.
Web References:
https://www.realestate.com.au/buy
https://www.indianrealestateforum.com
https://housing.com/in/buy/real-estate-new_delhi
[1] Durafe Anirudha and Singh Manmmet Dr (2015),” Bank Capital Buffer and Business Cycle: Evidence for India”
[2] Mamata. T Kumar Pradeep. D. Dr (2010),” A study on isuues related to Housing finance: An experience with State Bank of India”, “Summer Internship Society”
[3] Descriptive research is used to describe characteristics of a population or phenomenon being studied
[4] IBM® SPSS Amos is powerful structural equation modeling software that enables you to support your research and theories by extending standard multivariate analysis methods, including regression, factor analysis, correlation, and analysis of variance.