Pacific B usiness R eview I nternational

A Refereed Monthly International Journal of Management Indexed With THOMSON REUTERS(ESCI)
|
Dr. Neha Verma Assistant Professor Jaipuria Institute of Management Ghaziabad, UP (India) |
Motives predict cognitive styles of Indian executives and add to sustainable development. This study acclaims that motives have impact on team effectiveness too. A comparative analysis across Indian Manufacturing and IT-ITES industries shows predictive associations of need pattern and team effectiveness as a combination of team and task function. Data collected using standardized items revealed prominent associations through step wise regression analysis on a sample on Indian executives (N=407). The design of the study is based on research published in PBRI in November 2014, yet the originality of current study is vested in choice of unique criterion variable of team and task functions as a function of secondary psychological motives.
Employing above 10 million Indians, the Indian IT (Information Technology) and IT enabled Services (ITeS) industry is presently and potentially contributory to social transformation in the country, (IBEF, 2014). ‘Make in India’ program launched by contemporary Prime Minister Mr. Narendra Modi has placed India on the world map as a manufacturing hub. The manufacturing output is to contribute 25 per cent of Gross Domestic Product (GDP) by 2025 (IBEF, 2016). With above prospects, rigorous researches on effectiveness are required in the industries. McGrath’s Input-Process-Output (I-P-O) framework (Mathieu et al. , 2008) direct Team Effectiveness (TE) researches to diagnose the impact of Inputs (Member related, Team related, and Organization related) on Processes (member interactions directed towards task accomplishment), or on Outputs (e.g. Performance, Satisfaction, improvement in processes etc). Present study’s objective is to explore predictors of team functions and task functions across Indian ITES (Information Technology Enabled Service) and Manufacturing industries. Framework includes four secondary motives/needs (Verma, 2014) namely Need for Achievement (nAch), Need for Affiliation (nAff), Need for Power (nPower) and Need for Security (nSec), and TE as a combination of team functioning (TF) and team empowerment (TEmp).
Team Effectiveness
Personality characteristics can be significant variables in TE researches (Mannix & Neale, 2005). Advancing the argument of Ross et al. , (2008) that identifying predictors of TE can be a proactive strategy for making effective teams, Decision making styles stood as significant predictor of TE (Verma et al ., 2016). Motives are yet to be explored as predictors of TE across the aforesaid industries. The TF and TEmp processes (Pareek, 2002b) may be understood as team functions (processes that denote interaction amongst members of team to facilitate task) and task functions (processes those are foremostly undertaken to fulfil tasks). Volmer & Sonnentag (2011) have similar attributions of TE while exploring the impact of member expertise on TE. Team functioning is the combination of Cohesion (tendency to stick together and stay united regardless of difficulties and set-backs), Collaboration (smooth communication enhancing help exchanges and voluntary task sharing) and Confrontation (open, positive and healthy discussion on issues). Team Empowerment is the combination of Task Clarity (sense of clarity about individual roles and tasks), Autonomy (degree of discretion and independence to determine own way of working), Support (sufficient material and human resources, and conducive and favorable environment), and Accountability (willingness or compulsion to accept responsibility for one's actions). Both TF and TEmp are not mutually exclusive, rather have strong inter- linkages (Verma et al ., 2016).
Motives
Needs or Motives determine the direction of an individual’s behavior towards goal as precursors to motivation. Different needs are distinctively valued by different individuals (Gomes, 2011). Employees demonstrate goal-driven behavior to satisfy needs (Carpenter et al. , 2009). David McClelland’s three important motives of achievement, affiliation and power are well recognized and relate to goal striving motivation and performance outcomes (Bipp & Dam, 2014). Security motive is another important motive relevant in organizations. The measurement of these four psychological needs/motives has become a concern at workplace (Pareek 2002a; Pareek & Purohit, 2010). Needs/motives are primary (physiological) and secondary (social and psychological). Secondary needs are the needs of mind and spirit conditioned by experience, vary in type and intensity among people, change within any individual, work in groups rather than alone, and are nebulous unlike primary needs (Sanghi, 1998, Verma, 2014).
Research Hypotheses
Need for achievement, power, affiliation and security are secondary motives/needs learned over the time as the human society develops (Luthans 2002, 2008). Motivational needs like growth, achievement and power are positively related to psychological empowerment (Jha, 2010). Salespeople with high nAch, nAff and nPow were found performing high to contribute to organizational effectiveness (Uduji & Akeli, 2013). McClelland’s needs related with accountability for self and others. Particularly, nAch had greater impact on accountability followed by nAff and nPow. In view of various relational evidences, team and task functions are assumed to be affected by the motivational patterns of team members. Likewise Verma, et al ., (2016), this study is also planned as a mean value research diagnosing impact of average compositional attribute on TE. The main hypothesis is:
H1 : Motivational needs of executives will predict their TE
Security Motive (nSec) symbolizes every individual’s concern about protecting oneself and one’s family from hazards. Security motive begins to manifest even when only modest threat is present in the environment. Higher the nSec, more the person is worried of future, social prestige, financial security, seeks security from friends and feels frightened of being dismissed (Sanghi, 1998). Maslow’s safety needs denote the concerns of being safe from danger, pain, or an uncertain future. In contemporary society, the nSec is too intense with the concerns like payment of installments for durables, work life balance, job security, and present and future security (Luthans 2002, 2008). Many organizations reduce the insecurities by offering insurance programs, personal savings plans, and other benefits to their employees. The nSec incorporates Job Security (Sahu, 2009), Financial Security (Bhat & Shah, 2010), Self and Family Safety (Abdulla et al. , 2011), and Status and Social Prestige (Abu Elanain, 2009). Employment security is one of the key human resource techniques that lead to higher organizational performance and therefore this nSec should be lower amongst the employees, (Khaleque & Choudhary, 1984). Job security is foremost concern in this post liberalized world of contract labor, downsizing and part timers/temporary workers (Verma, 2013). Higher nSec is dangerous. The hypothesis is:
H1a : nSec of executives will negatively predict their TE
Achievement Motive (nAch) is a strive to increase or keep as high as possible one’s own capacity in all activities in which competition with some standards of excellence is thought to be involved, and where the execution of such activity either succeed or fail. Higher the nAch in a person more is the willingness to take responsibility with fore sightedness for success (Sanghi, 1998). The degree to which a person wishes to attain challenging goals, succeeds in competitive situations, and exhibits the desire for unambiguous feedback about performance. Higher degree represents high nAch (Luthans 2002, 2008). The unconscious concern for excellence in accomplishments through individual efforts denotes nAch (Lussier & Achua, 2007). David McClelland posited high nAch people have feature like Moderate risk taking ; Need for immediate feedback ; Satisfied with accomplishment ; and Preoccupied with the task (Johnson et al ., 1981). This need is associated with organizational performance and national economic growth (Kunnanatt, 2008), prosocial behavior (Baruch et al. , 2004), commitment and work focus (Lilly et al. , 2006), success in entrepreneurship (Wu et al ., 2007), accountability for self and others (Royle & Hall, 2012). Therefore, the hypothesis is:
H1b : nAch of executives will positively predict their TE
People with high nPow ( Power Motive) strive to have influence on others, prefer to participate in status oriented situations and control the information channels to improve their self-image. Higher the nPow, more the individual has leadership tendencies and is influential, disciplined, and dominating (Sanghi, 1998). McClelland argued that nPow comprises three element: Control (on people to make sure the developments and plans are being worked upon and to be informed about everything); Influence (on others to make them do what one thinks is right with an urge to change or develop people) and socialized power (for benefits of a large group such as society). Regarding social power, Donhauser et al . (2015) also found that one way through which people high in nPow are socially influential is their enhanced sensitivity to emotional signals in their social environment. Socialized power and social nAch are similar (Mehta, 1994). Use power for social developments is referred as extension motive addressed (Pareek, 1968a&b). Power oriented rewards and employee empowerment are practiced for motivating the employees (Spitzer, 1996). Power motivated executives see organizational goals more clearly and they exhibit more team spirit. Hence, this motive is important (McClelland & Burnham, 1976). To have committed employees, every organization should raise nPow in addition to the nAch amongst the employees (Pareek, 1974). As the nPow relates with Managerial Success (Winter, 2002), Goal Commitment (Sandalgaard et al. , 2011), Work Focus (Lilly et al. , 2006), sensitivity to emotional signals (Donhauser et al ., 2015), the hypothesis is:
H1c : nPow of executives will positively predict their TE
Affiliation Motive (nAff) represents a person’s desire for social contacts or belongingness, and a tendency to receive social rewards of harmonious relationships. It positively relates with humane like encouragement, rewards, altruistic behavior, generosity, caring, friendliness, and kindness to others (van Emmerik et al ., 2010). People with high nAff strive for friendship, prefer to participate in collaborative situation and seek mutual understanding with others. They work better in their favourable attitude and cooperation. Higher the nAff, more the individual is group dependent and social, and hates staying alone (Sanghi, 1998). Affiliation is the degree to which people seek approval from others, conform to others’ wishes, and avoid conflict with others (Luthans 2002, 2008). It is an important part of group dynamics and team (Verma, 2013). Individuals join group to address their intense social needs. Employees’ nAff is met through associating with a group or becoming member of a team. Hawthorn Studies and many contemporary researches revealed that the nAff has a major impact as important group processes (Van Der Vegt & Bunderson, 2005). Being linked with identification (Wiesenfeld et al. , 2001) and collectivism (Taggar & Haines, 2006), nAff is a key to team work (Solansky 2011). It also related with work outcomes in terms of work turnover (Richer et al. , 2002). Henceforth the hypothesis is:
H1d : nAff of executives will positively predict their TE
3.1 The Sample
The responses of 176 executives from Information Technology Enabled Services (ITES) and 231 from manufacturing industry were captured for studying three important variables of motives, decision making and team effectiveness (Verma, 2014; Verma et al ., 2016). Here the responses on motives and team effectiveness were utilized. Table 1 reports the demographic distribution of the sample.
[Insert Table 1 here]
Majority of ITES executives are from Junior age group (81.81%), males (67.61%), have lower annual income levels (52.81%) and Management PG degree (63.63%). Most of the manufacturing executives are from Junior (47.18%) as well as Middle (44.58%) age group. Unlike ITES, few manufacturing executives are also from Senior age group (8.22%). Most manufacturing executives are males, have Management PG degrees (44.15%) as well as Engineering degrees (32.9%) and have lower (59.3%) as well middle (31.17%) annual income levels. Only 9 female respondents belong to manufacturing industry, majority (57) from ITES proves that ITES has a significant proportion of women (The Economic Times, 2009), expected to grow in future. Executives of ITES (12.98%) have higher income levels as compared to manufacturing (9.5%). While, middle income group (31.17%) and lower income group (59.30%) is higher in manufacturing than ITES.
3.2 The instruments
Standardized instruments were used for data collection. Total 24 Items, 6 items each of nSec, nAch, nPow and nAff were adopted from NPS (Need Pattern Scale) by Sanghi (1998) to capture the motives (Verma, 2014). Each item is answered Agreement (1) or Disagreement (0). The sum of agreements items of a particular need give its scores. For TE, 28 item TEAM (Team Effectiveness Assessment Measure) by Pareek (2002b) was used to capture 2 dimensions of Team Functioning (3 Factors: Cohesion, Confrontation, Collaboration) and Team Empowerment (4 Factors: Task Clarity, Autonomy, Support, Accountability). Each item has 5 choices of Not at all True (0), Very Little True (1), Slightly True (2), Fairly True (3), and Highly True (4). The sum of marked choices renders the respective scores on dimensions (Verma et al ., 2016).
After obtaining satisfactory inter-rater agreement i.e. intra class coefficients (ICC) of above 0.7 (James et al ., 1993), industry wise aggregation of scores were used for analyses. Further, descriptive statistics, correlation and regression analyses were obtained using SPSS v17.0. Table 2 reports descriptive scores.
[Inset Table 2 here]
The nAch is highest in both ITES (4.58/6= 76%) and Manufacturing (4.86/6= 81%). The nSec (59.5%) and nAff (59.83%) are almost equal in ITES. While, in manufacturing industry, the nSec (57.66%) is lesser than nAff (61%). Notably, the nSec is least, still considerable (above 50%) in both the industries. TF in ITES (69.5%) is higher than TEmp (68.83%), but TF in Manufacturing (67.92%) is lower than TEmp (67.94%). Table 3 reports significant correlations amongst the study variables.
[Insert Table 3 here]
In ITES, the nSec has significant negative correlation with TEmp (-0.180, p<0.05). The nSec positively correlates with nAch (0.328, p<0.01), nPow (0.288, p<0.01) and nAff (0.332, p<0.01). The nAch correlates significantly positively with TEmp (0.132, p<0.05). The TF and TEmp are also significantly positively correlated. The nAch is correlated positively with nPow (0.510, p<0.01) and nAff (0.209, p<0.01). Here, nPow has no significant correlation with nAff (0.093, p>0.05).
In manufacturing industry, the nSec has negative correlation with TF (-0.196, p<0.01), TEmp (-0.186, p<0.01) and TE (-0.203, p<0.01). The nSec correlates positively with nPow (0.172, p<0.01) and nAff (0.137, p<0.01). The nAch correlates significantly positively with TEmp (0.132, p<0.05), nPow (0.238, p<0.01) and nAff (0.261, p<0.01). The nPow correlates significantly nAff (0.134, p<0.05).
But from correlation only, the strength of association of independent variables with TE cannot be assessed. To examine how much change in the independent variable is associated with how much change in dependent variable, regression analysis is appropriate technique (Levin and Rubin, 2008). Hence stepwise regression analysis has been conducted Industry wise. Needs used as independent variables, and TF, TEmp and TE kept as the dependent variable (DV) in different runs. The method of entry set as stepwise in regression analyses. The significant results are reported in Table 4.
[Insert Table 4 here]
Table 4 shows the predictive power i.e. beta (β) coefficients of various needs as independent (predictor) variables towards the dependent (criterion) variable Team Effectiveness (TE). The R2 denotes % variance explained by styles and needs in TE, and F statistics reflect the significance of model. In ITES industry, the only significant model is Model 1. Here, the nSec negatively predicts TEmp (β= -0.180, p<0.05). In manufacturing, incremental to the correlation results, many models were found significant. The nSec (β= -0.217, p<0.01) and nAff (β= 0.157, p<0.05) had significant prediction towards TF in Model 2b. Adjusted R 2= 5.4% and F= 7.602, p<0.01. Moreover, nSec (β= -0.199, p<0.01) and nAch (β= 149, p<0.05) significantly predicted TEmp in Model 3b. Adjusted R2= 4.8% and F= 7.6.824, p<.01. With TE as DV in Model 4b, nSec (β= -0.216, p<0.01) and nAch (β= 0.147, p<0.05) had significant predictive association. Adjusted R2= 5.5% and F= 7.6.824, p<0.01. Significant change in variances (ΔR2) and F have been noticed for Model 2a to 2b, 3a to 3b and 4a to 4b. The significant predictive associations and regression coefficients are visualized in Figure 1.
[Insert Figure 1 here]
As shown in Figure 1, the sub-hypothesis H1a (nSec of executives will negatively predict their TE) is fully supported in both the industries. The sub-hypothesis H1b (nAch of executives will positively predict their TE) is partially supported (only in manufacturing industry nAch predicted TEmp and TE). The sub-hypothesis H1d (nAff of executives will positively predict their TE) is also partially supported (only in manufacturing industry nAff predicted TF dimension of TE). Whereas, the sub-hypothesis H1c (nPow of executives will positively predict their TE) has failed to fetch any support. Eventually, the main hypothesis H1 (Motivational needs of executives will predict their TE) has received partial support.
The inter-correlated motives reflected non-mutual exclusivity (Verma, 2014). Correlation of nAch and nSec in ITES (but not in manufacturing) points that the face to face production oriented functions might not make executive insecure for target completion, while the virtual working environment of ITES bring in insecurities about goal accomplishments. ITES executives have high nAch with desire to master complex tasks, and surpass others (Daft, 2008), thus they have a big concern for maintaining their success that enhances their nSec against loss to performance (Verma et al. , 2012).
In ITES, none of the motives significantly predicted TE. Perhaps in such settings some other factors are more important for TE dimensions. Though, nSec had negative prediction towards team empowerment. This justifies that higher nSec reflects lower empowerment. Vulnerability of executives with high nSec doesn’t let them feel autonomy and support. It also causes lack of task clarity and accountability. Furthermore, in manufacturing industry also a higher level of nSec is associated with a lower level of TE and its dimensions. The increase in nSec degrades TE via reduced empowerment perception. The vulnerability cause setbacks, conflicts and helpless attitude of the executives and deteriorate their team function. Too much concern about security makes the individuals panic and disturbed that they turn incapable of contributing towards either team function or task function.
In Manufacturing, the nSec and nAff together predict team functioning. While the impact of security motive here is still negative, the affiliation motive is seemed to facilitate the team tasks. Affiliation motive brings identification and belongingness in the executives (Desivilya & Eizen, 2005), thereby causing better cohesiveness, collaboration/help exchanges and constructive confrontation despite their insecurities. Collectivism and cooperative orientation provides improvement in team functions adding to the notion that affiliation motive is the key to teamwork (Solansky, 2011). Executives high on nAff have concern for needs of team members and followers (Steinmann et al ., 2015). Moreover, the nSec and nAch together predict team empowerment and team effectiveness. Manufacturing executives unlike ITES are into production of tangible units of products with specific targets. Their nAch is a tendency to be effortful to attain their objectives, to surpass their targets and to excel in their assignments. This tendency get boosted with group oriented affiliation (nAff) and zeal to have control (nPow). Despite the negative impact of nSec, the nAch makes the executives feel empowered and adds to their TE. While, this is in contradiction with Khan et al ., (2015) who contend that lower mean value of nAch improves team effectiveness, but it is congruence with Michou et al . (2014) that nAch is also positively related with positive affect.
The findings bear implications for Respondents and Executives, Employers, Practitioners, and Academicians as well Researchers. Insights are for learning appropriate need orientation. Awareness about the advantages and drawbacks of need orientation can help in taking steps to overcome the drawbacks and to attain benefits out of advantages of need orientation in work fields (Carpenter et al. , 2009). In manufacturing having less security motive and high achievement motive enhances task clarity, accountability, and autonomy and support perceptions. Also, identifying (nAff) with other team members, enhances cohesiveness, collaboration and confrontation. Furthermore, security motive lessens task functions i.e. empowerment (in ITES).
The inquisitiveness of investigating novel compositional attributes in TE researches, laid the foundation of this research work. The study provides empirical evidence that TE of Indian executives is significantly predicted by their motivational needs. Despite variation in predictive associations across ITES and Manufacturing industries, motives have explained significant variance in TE dimensions. In all, the main hypothesis of the study is partially supported. The quantitative findings of this research may further fetch support from workplace cases. Other motives and TE models may be used in future researches. Further generalization of findings could be done with longitudinal research design. Additionally, different contextual settings may be used.
Abdulla, J., Djebarni, R. & Mellahi, K. (2011). Determinants of job satisfaction in the UAE: A case study of the Dubai police. Personnel Review , 40 (1), 126–146. http://dx.doi.org/10.1108/00483481111095555
Abu Elanain, M.H. (2009). Job characteristics, work attitudes and behaviors in a
non-Western context. Journal of Management Development , 28 (5), 457-477.
http://dx.doi.org/10.1108/02621710910955985
Baruch, Y., O’Creevy, M.F. & Vigoda-Gadot, E. (2004). Prosocial Behavior and Job Performance: Does the need for control and the need for achievement make a difference? Social Behavior and personality, 32 (4), 399-412. http://citeseerx.ist.psu.edu/viewdoc/download?doi=10.1.1.486.1141&rep=rep1&type=pdf
Bhat, S. & Shah, H. (2010). Managing Work Motivation at the Bottom- A Case from Footwear Manufacturing Organization in India, Vilakshan, XIMB Journal of Management , March, 141-156. http://connection.ebscohost.com/c/articles/48870397/managing-work-motivation-bottom-case-from-footwear-manufacturing-organization-india
Bipp, T. & Dam, K. V. (2014), Extending hierarchical achievement motivation models: The role of motivational needs for achievement goals and academic performance. Personality and Individual Differences, 14 , 157-162. http://dx.doi.org/10.1016/j.paid.2014.02.039
Carpenter, M., Bauer, T. & Erdogan, B. (2009). Principles of Management . Washington, DC: Flat world Knowledge Inc.
Daft, R. L. (2008). The leadership experience (4th ed.). Mason, OH: South- Western, Cengage Learning.
Desivilya, H.S. & Eizen, D. (2005). Conflict management in work teams: the role of social self-efficacy and group identification. International Journal of Conflict Management , 16 (2), 183–208. http://dx.doi.org/10.1108/eb022928
Donhauser, P.W., Rösch, A.G. & Schultheiss, O.C. (2015). The implicit need for power predicts recognition speed for dynamic changes in facial expressions of emotion. Motivation and Emotion, 39 (5), 714-721. DOI: 10.1007/s11031-015-9484-z
Gomes, O. (2011). The hierarchy of human needs and their social valuation. International Journal of Social Economics , 38 (3), 237–259. http://dx.doi.org/10.1108/03068291111105183
IBEF (India Brand Equity Foundation, 2014). IT and ITeS Industry in India. Retrieved from http://www.ibef.org/industry/information-technology-india.aspx , on 6 Feb, 2015.
IBEF (India Brand Equity Foundation, 2016). Manufacturing Sector in India. Retrieved from http://www.ibef.org/industry/manufacturing-sector-india.aspx , on 12 Dec, 2016.
James, L.R., Demaree, R.G. & Wolf, G. (1993). rwg: an assessment of within-group interrater agreement. Journal of Applied Psychology , 78 (2), 306-309. DOI: 10.1037/0021-9010.78.2.306
Jha, S. (2010). Need for Growth, Achievement, Power and Affiliation: Determinants of Psychological Empowerment. Global Business Review, 11 (3), 379–393. Available at http://journals.sagepub.com/doi/abs/10.1177/097215091001100305
Johnson, D.W., Maruyama, G., Johnson, R., Nelson, D. & Skon, L. (1981). Effectiveness of Cooperative, Competitive and Individualistic Goal Structures on Achievement: A Meta Analyses. Psychological Bulletin , 89 (1), 47-62. DOI: 10.1037/0033-2909.89.1.47
Khaleque, A. & Choudhary, N. (1984). Job facets and overall job satisfaction of industrial managers, Indian Journal of Industrial Relations , 20 (1), 55-64. http://www.jstor.org/stable/27768798
Khan, M.S., Breitenecker, R.J. & Schwarz, E.J. (2015). Adding fuel to the fire: Need for achievement diversity and relationship conflict in entrepreneurial teams. Management Decision, 53 (1), 75–99. http://dx.doi.org/10.1108/MD-02-2014-0066
Kunnanatt, J.T. (2008). Strategic question in Indian banking sector: are Indian bank managers achievement oriented?. Journal of Management Development, 27 (2), 169-186. http://dx.doi.org/10.1108/02621710810849317
Levin, R.I. & Rubin, D.S. (2008). Statistics for Management , Licensees of Pearson Education in South Asia: Dorling Kindersley (India) Pvt. Ltd.
Lilly, J.D., Duffy, J.A. & Virick, M. (2006). A gender-sensitive study of McClelland's needs, stress, and turnover intent with work-family conflict. Women in Management Review , 21 (8), 662–680. http://dx.doi.org/10.1108/09649420610712045
Lussier, R. & Achua, C. (2007). Leadership: Theory, Application, & Skill Development. Mason, OH: Thomson South- Western.
Luthans, F. (2002). Organizational Behavior, 9th ed. New York: Mc Graw-Hill.
Luthans, F. (2008). Organizational Behavior, 11th ed. Singapore: Mc Graw-Hill.
Mannix, E. & Neale, M.A. (2005).What Differences Make a Difference ? The Promise and Reality of Diverse Teams in Organizations. Psychological Science in the Public Interest , 6 (2), 31–55. doi: 10.1111/j.1529-1006.2005.00022.x. Epub 2005 Oct 1.
Mathieu, J., Maynard, M.T., Rapp, T. & Gilson, L. (2008), Team Effectiveness 1997-2007: A Review of Recent Advancements and a Glimpse into the Future, Journal of Management , 34 (3), 410–476. DOI: 10.1177/0149206308316061
McClelland, D.C. & Burnham, D.H. (1976), Power is the great motivator, Harvard Business Review , 54 (2), 159–166. https://hbr.org/2003/01/power-is-the-great-motivator
Mehta, P. (1994). Social Achievement Motivation: Needs, Values and Work organization . New Delhi: Concept Publishing Company.
Michou, A., Matsagouras & Lens, W. (2014). Dispositional achievement motives matter for autonomous versus controlled motivation and behavioral or affective educational outcomes. Personality and Individual Differences, 69 , 205-211. http://dx.doi.org/10.1016/j.paid.2014.06.004
Pareek, U. (1974). A Conceptual Model of Work Motivation. Indian Journal of Industrial Relations , 10 (1), 15-31. http://www.jstor.org/stable/27765425
Pareek, U. (1968a). Motivational Paradigm of Development. Journal of Social Issues , 24 (2), 115-122. DOI: 10.1111/j.1540-4560.1968.tb02659.x
Pareek, U. (1968b). Motivational pattern and planned Social Change. International Social Science Journal , 20 (3), 464-473. http://unesdoc.unesco.org/images/0002/000246/024644eo.pdf#nameddest=24650
Pareek, U. (2002a). Training Instruments in HRD and OD, (2nd ed.). New Delhi, India: Tata McGraw Hill Publishing Company Limited.
Pareek, U. (2002b). Team Effectiveness Assessment Measure, in Training Instruments, in HRD and OD (2nd ed.) New Delhi, India: Tata McGraw Hill Publishing Company Limited.
Pareek, U. & Purohit, S. (2010), Training Instruments in HRD and OD, 3rd ed. , New Delhi, India: Tata McGraw Hill Publishing Company Limited.
Richer, S.F., Blanchard, C. & Vallerand, R.J. (2002). A Motivational Model of Work Turnover. Journal of Applied Social Psychology , 32 (10), 2089-2113. DOI: 10.1111/j.1559-1816.2002.tb02065.x
Ross, T.M., Jones, E.C. & Adams, S.G. (2008). Can team effectiveness be predicted?, Team Performance Management , 14 (5/6), 248–268. http://dx.doi.org/10.1108/13527590810898518
Royle, M.T. & Hall, A.T. (2012). The relationship between McClelland’s Theory of Need, Feeling Individually Accountable, and Informal Accountability for Others. International Journal of Management and Marketing Research. 5 (1), 21-Available at https://papers.ssrn.com/sol3/papers.cfm?abstract_id=1957209
Sahu, S. (2009). Motivation of executives an empirical study in service sector, Delhi Business Review , 10 (1), 89–99. http://www.delhibusinessreview.org/vn1/vxn1g.pdf
Sandalgaard, N., Bukh, P.N. & Poulsen, C.S. (2011). The interaction between motivational disposition and participative budgeting: Evidence from a bank. Journal of Human Resource Costing and Accounting , 15 (1), 7–23. http://dx.doi.org/10.1108/14013381111125297
Sanghi, S. (1998). Need Pattern Scale . Agra, India: National Psychological Corporation.
Solansky, S.T. (2011). Team identification: a determining factor of performance. Journal of Managerial Psychology , 26 (3), 247–258. http://dx.doi.org/10.1108/02683941111112677
Spitzer, D.R. (1996). Power Rewards: Rewards that really motivate. Management Review , 85 (5), 45-50. http://connection.ebscohost.com/c/articles/9605073643/power-rewards-rewards-that-really-motivate
Steinmann B., Dörr S. L., Schultheiss O. C. & Maier G. W. (2015). Implicit motives and leadership performance revisited: what constitutes the leadership motive pattern?. Mot. Emot. , 39 , 167–174. Doi: 10.1007/s11031-014-9458-6.
Taggar, S. & Haines, V.Y. (2006). I need you, you need me: a model of initiated task interdependence. Journal of Managerial Psychology , 21 (3), 211-230. http://dx.doi.org/10.1108/02683940610659560
The Economic Times (2009, 13 May), "Number of Women Working in IT-BPO Sector Up 60 Percent”, Retrieved from http://articles.economictimes.indiatimes.com/2009-05-13/news/28389401_1_gender-inclusivity-hr-practices-bpo , on 19 July, 2014.
Uduji, J. & Ankeli, M.O. (2013). Needs for Achievement, Affiliation, and Power: the Possible Sales Manager’s Actions for Exceptional Salesforce Performance. Research Journal of Finance and Accounting , 4 (9), 96-103. Available at: http://pakacademicsearch.com/pdf-files/ech/519/96-103%20Vol%204,%20No%209%20(2013).pdf
Van der Vegt, G.S. & Bunderson, J.S. (2005). Learning and performance in multidisciplinary teams: the importance of collective team identification. Academy of Management Journal , 48 (3), 532-547. doi:10.5465/AMJ.2005.1740791.
van Emmerik, H, Gardner, W.L, Wendt, H. & Fischer, D. (2010). Associations of Culture and Personality With McClelland’s Motives: A Cross-Cultural Study of Managers in 24 Countries. Group & Organization Management , 35 (3), 329–367. DOI: 10.1177/1059601110370782.
Verma, N. (2013). General Decision Making Style and Need Pattern as Predictors of Team Effectiveness. PhD Thesis, Department of Management Studies, IIT Roorkee.
Verma, N. (2014). Impact of Motives on Cognitive Styles: A comparative study as an opportunity for Sustainable Development. Pacific Business Review International , 7 (5), 47-55.
Verma, N., Rangnekar, S. & Barua, M.K. (2012). Analyzing Need Pattern to Achieve Organizational Excellence: Study in Indian Contexts, in Shekhawat, H. and Tak, P. (Eds.), Business Strategies and Economic Growth: The Way Forward , pp. 32-44, New Delhi, India: Excel Books.
Verma, N., Rangnekar, S. & Barua, M. K. (2016). Exploring decision making style as a predictor of team effectiveness. International Journal of Organizational Analysis , 24 (1), 36–63. http://dx.doi.org/10.1108/IJOA-01-2012-0547
Volmer, J. & Sonnentag, S. (2011). The role of star performers in software design teams. Journal of Managerial Psychology , 26 (3), 219–234. http://dx.doi.org/10.1108/02683941111112659
Wiesenfeld, B.M., Raghuram, S. & Garud, R. (2001). Organizational identification among virtual workers: the role of need for affiliation and perceived work-based social support. Journal of Management , 27 (2), 213-229. http://dx.doi.org/10.1016/S0149-2063(00)00096-9
Winter, D.G. (2002). The Motivational Dimensions of Leadership: Power, Achievement and Affiliation, in Riggio R.E, Murphy S.E and Pirozzolo F.J (Eds.), Multiple Intelligences and Leadership , Mahwah, NJ: Lawrence Erlbaum.
Wu, S., Matthews & Dagher, G.K. (2007). Need for achievement, business goals, and entrepreneurial persistence. Management Research News, 30 (12), 928–941. http://dx.doi.org/10.1108/01409170710833358
Figure 1: Significant Predictive Associations in ITES and Manufacturing industry
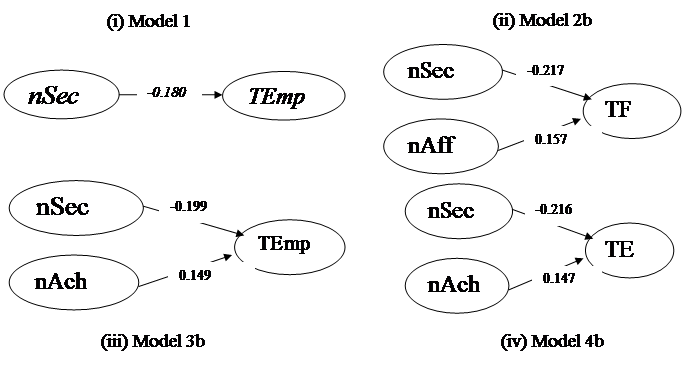
Table 1: The Demographic Profile of Respondents
|
ITES (N=176) |
Manufacturing (N=231) |
||||
|
Group |
Sub Group |
Number |
Percentage |
Number |
Percentage |
|
Age (in years) |
Less than 30 (Junior) |
144 |
81.81% |
109 |
47.18% |
|
30 to 44 (Middle) |
32 |
18.18% |
103 |
44.58% |
|
|
45 and above (Senior) |
- |
- |
19 |
8.22% |
|
|
Gender |
Male |
119 |
67.61% |
222 |
96.10% |
|
Female |
57 |
32.38% |
9 |
3.89% |
|
|
Annual Income |
Upto 5 Lac (Lower) |
122 |
52.81% |
137 |
59.30% |
|
(INR) |
5 to 10 Lac (Middle) |
24 |
13.6% |
72 |
31.17% |
|
Above 10 Lac (Higher) |
30 |
12.98% |
22 |
9.5% |
|
|
Education |
Simple Graduates |
15 |
8.5% |
30 |
12.98% |
|
Engineers |
28 |
15.90% |
76 |
32.90% |
|
|
Post Graduates (PG) |
21 |
11.93% |
23 |
9.95% |
|
|
Management PG |
112 |
63.63% |
102 |
44.15% |
|
Table 2: Industry-wise Descriptive Statistics
|
IT-ITES Industry |
Manufacturing |
|||||
|
Minimum |
Maximum |
Mean |
Std. Dev. |
Mean |
Std. Dev. |
|
|
nSec |
0 |
6 |
3.57 |
1.60 |
3.46 |
1.49 |
|
nAch |
0 |
6 |
4.58 |
1.37 |
4.86 |
1.08 |
|
nPow |
0 |
6 |
4.33 |
1.52 |
4.43 |
1.25 |
|
nAff |
0 |
6 |
3.59 |
1.69 |
3.66 |
1.59 |
|
TF |
0 |
48 |
33.36 |
7.28 |
32.6 |
6.84 |
|
Temp |
0 |
64 |
44.05 |
9.89 |
43.48 |
9.48 |
|
TE |
0 |
112 |
77.41 |
16.23 |
76.09 |
15.25 |
Table 3: Correlation amongst Cognitive Style & Motivational Need ( ITES and Manufacturing)
|
nSec |
nAch |
nPow |
nAff |
TF |
TEmp |
TE |
|
|
nSec |
1 |
.086 |
.172** |
.137* |
-.196** |
-.186** |
-.203** |
|
nAch |
.382** |
1 |
.238** |
.261** |
.103 |
.132* |
.128* |
|
nPow |
.288** |
.510** |
1 |
.134* |
.028 |
-.009 |
.007 |
|
nAff |
.332** |
.209** |
.138 |
1 |
.127 |
.089 |
.112 |
|
TF |
-.082 |
.059 |
.093 |
.047 |
1 |
.739** |
.908** |
|
TEmp |
-.180* |
.037 |
.034 |
.020 |
.783** |
1 |
.953** |
|
TE |
-.146 |
.049 |
.063 |
.033 |
.925** |
.960** |
1 |
Note 1: **p<0.01, *p<0.05, Rat= Rational, Int= Intuitive, Dep= Dependent, Avoi= Avoidant, Spon= Spontanoeus, TF= Team Functioning, TEmp= Team Empowerment, TE= Team Effectiveness
Note 2: Italic figures show correlation in ITES industry , others show correlation in Manufacturing Industry
Table 4: Predictive associations of needs towards team effectiveness and its constituents
|
IT-ITES |
Manufacturing |
|||||||
|
Model 1 |
Model 2a |
Model 2b |
Model 3a |
Model 3b |
Model 4a |
Model 4b |
||
|
Antecedents |
DV TEmp |
DV TF |
DV TF |
DV TEmp |
DV TEmp |
DV TE |
DV TE |
|
|
Needs or Motives |
nSec |
-.180 * |
-.196** |
-.217** |
-.186** |
-.199** |
-.203** |
-.216** |
|
nAch |
- |
- |
- |
- |
.149* |
- |
.147* |
|
|
nPow |
- |
- |
- |
- |
- |
- |
- |
|
|
nAff |
- |
- |
.157* |
- |
- |
- |
- |
|
|
R2 |
.032 * |
.038** |
.063* |
.034** |
.056* |
.041** |
.063* |
|
|
Adjusted R2 |
.027 * |
.034** |
.054* |
.030** |
.048* |
.037** |
.055* |
|
|
ΔR2 |
- |
- |
.024* |
- |
.022* |
- |
.021* |
|
|
F |
5.827 * |
9.123** |
7.602** |
8.163** |
6.824** |
9.856** |
7.632** |
|
|
Δ F |
- |
- |
5.886* |
- |
5.331** |
- |
5.226* |
|
**p<0.01, *p<0.05
Note 1: DV= Dependent Variable, TF= Team Functioning, TEmp= Team Empowerment, TE= Team Effectiveness
Note 2: Only significant models of step wise regression analyses have been reported