Pacific B usiness R eview I nternational

A Refereed Monthly International Journal of Management Indexed With THOMSON REUTERS(ESCI)
|
K.D.V. Prasad, Faculty of Commerce, Kamala Nehru Mahavidyalaya, Sakkardara, Rashtrasant Tukdoji Maharaj Nagpur University, Nagpur |
Rajesh Vaidya, Associate Professor & Head, Department of Management and Technology, Shree Ramdeobaba College of Engineering and Management, Ramdeo Tekdi, Gittikhadan, Katol Road, Nagpur |
V Anil Kumar Visiting Scientist, Biometrics, ICRISAT, Patancheru |
This study reports the results on the association among occupational stress factors and employee performance at workplace using a survey of 756 employees of agricultural research sector in Hyderabad Metro, India. The seven independent occupational stress causing factors shift work, working hours, high on job demand, lack of job control, social support, job insecurity, lack of salary rewards and the dependent variable employee performance measured. The data collected using the structured self-reported and undisguised questionnaire on agricultural research sector employees working in and around Hyderabad Metro. Using the questionnaire data was collected on general characteristics, health related issues using dichotomous variables and job characteristics – that is occupational stress factors using statements measured on a 5-point likert type scale. The chi-square test and multivariate logistic regression analysis were applied to measure to observe if any statistically significant association among the seven occupational stress factors and employee performance. The reliability of the scale used for the study and internal consistencies of the study instrument were measured using the reliability statistic Cronbach’s alpha (C-Alpha). The overall C-Alpha value for the measured at Men 0.83 and for women 0.79 and for all eight factors the C-alpha values ranged from 0.67 to 0.83 for Men and from 0.64 to 0.86 for Women. The results suggested that there was a statistically significant association between occupational stress factors like working hours/week (51-60 hrs, OR=1.41, 95% CI 1.09-1.71, p <0.01; >60 hrs/week, OR=1.94, 95% CI 1.65-2.44, p <0.01), job insecurity (OR=3.42, 95% CI 2.86-6.83, p <0.01 and social support (OR=4.42, 95% CI, 2.76-6.74, p <0.01)) effecting the performance. There are no significant differences were observed on odd rations in adjusted model.
Keywords: Performance, Occupational stress, Working hours, Shift work, Social support
Occupational stress or job stress is one of the major factor causing physiological, psychological and behavioural effects on employees at workplace and in turn severely effecting the employee performance. In the recent past several studies reported the ill effects of occupational stress like diabetes, hypertension, coronary artery diseases, musculoskeletal disorders. The occupational stress has been great concern to employees and stakeholders of the organizations because the job stress has been linked to low productivity, absenteeism, behavioural changes, employee dissatisfaction and health problems. The International Labour Organization Reports that the effect of occupational stress roughly costs up to 10 percent of a country’s gross national product (Midgley, 1996). The technological changes, redesign of jobs and advent of scientific management principles led to the simplification and fragmentation of jobs into highly repetitive and routine tasks (Rosenstock et al. 2005).
According to the National Institute for Occupational Safety and Health, occupational stress is defined as the stress that occurs when the needs of job is not aligned with the employee’s abilities, available resources, and expectation of the employer and causing physical and emotional responses (NIOSH, 2014). Stress is man’s adaptive reaction to an outward situation which would lead to physical, mental and behavioural changes. The environment, social stressors, physiological and thoughts are the four basic sources a personal can experience the stress (Matthews 2001). Levi (1998) studied the influence of psychological stressors influence on health through emotional, cognitive, behaviour and psychological factors. The workload, lack of job control, job insecurity, inadequate social support, extended working hours and lack of rewards also cause occupational stress and effect the performance (Loosemore and Waters, 2004, Prasad et al. 2015, 2016, 2017). Burton et al. 2006 reported that risk factors of occupational stress include smoking, hypertension, obesity, and job type in his study with financial services company. The long working hours, shift work, occupational stress lead to unhealthy habits like smoking, alcohol abuse, and disinterest in work and effect the performance at work place (Uehata 1991).
The stress is not escapable in modern life and the workplaces are becoming volatile stress factories. Though stress harms human beings in several ways, however appropriate amount stress can actually trigger one’s passion for work tap his/her latent abilities and ignites inspiration, thus yields positive results. Stress exists in every aspect of the life and employees from while collared employees, workers, teachers, supermarket employees and professionals. As the stress exists everywhere, we have conducted this study surveying agricultural research sector employees in and around Hyderabad. The data was collected from the employees of state agricultural universities, national agricultural research centers, international agricultural research institutes, and agricultural seed industries.
The Austrian Endocrinologist settled in Canada, Hans Selye first introduced the concept of stress into the life sciences in 1936. Pareek (1983) identified the different types of organizational role stresses. Hans Selye (1956) explained the stress phenomenon with General Adaptation Syndrome which is widely accepted across the globe. Osipow and Spokane (1987) proposes the six work roles that were stressful regardless of an individual’s vocational choice. Prasad et. al. (2015) reported the medium level stress at the work place using his study in the International Agricultural Research Institute, Hyderabad. Prasad et. al. (2016) concluded that woman employee will experience more stress than the men because of their dual role as employee and taking the responsibility of the family, using comparative analysis on the causes of occupational stress among men and women employees and its effect on performance. A comparative analysis was made on occupational stress among IT sector with reference to agricultural research institute employees and concluded that both sectors employees experience medium level stress (Prasad et al. 2016).
Sung-Hwan Jeon et. al. (2014) concluded that long working hours and occupational stress are significantly related to presentism surveying more than 6000 wage works in Republic of Korea. Kang Ho Lee et al. (2015) explained the association among anxiety symptoms and occupational stress among young Korean female manufacturing workers. The work environment, economic problems, task type and family issues are the causes of occupational stress among the while collar employees in Esfahan Streel Company, Iran (Masoud Lotfizadeh, 2014). Yasuhiko Deguchi et. al. (2017) demonstrated the relationships between worker’s anxious temperament, role conflict and sleeplessness among Japanese workers using logistic regression analysis. Further this study suggested the reduction in role conflict by supervisors and co-workers will reduce the stress related issues at workplace.
Prasad et. al. (2016) identified the causes the occupational stress, its effect on performance and ill-health effect on supermarket employees. In an investigation on causes of occupational stress, coping strategies adopted and their relationship with the teachers’ performance in CBSE affiliated school teachers in and around Hyderabad, this study explained the factors associated with occupational stress, coping strategies and their relationship with the performance (Prasad et. al. 2016). The significant differences between the teachers those who received social support and who followed the coping strategies who experienced less occupational stress compared to those teachers who do not have required social support and coping. The medium level stress exists at workplace and is manageable with job design changes, adjusting school environment which improve performance (Prasad et. al. 2016). Goyal (2017) studied the assessed the severity of stress being faced by the employees working in ICT sector. The findings of the study are revealing one. All respondents are found aware of stress; most of them are suffering from negative tress, whereas only a few feel positive tress. This study further suggested that coping strategies like yoga and meditation will help to reduce the stress among the ICT sector employees. Suraksha and Kuldip Chikkara (2017) studied the factors of occupational study in Banking Industry applying confirmatory analysis and reported that 11 factors like role overload, role ambiguity, poor peer relation low status, etc. will significantly influence the causing occupational stress.
To study the association among Occupational Stress factors and Performance at workplace among Agricultural Research Sector Employees at Hyderabad, India.
The exploratory and descriptive research method was followed, with agricultural research sector employees being the universe of population. The sample size was determined using Cochran (1977) formula assuming p=0.05 maximum variability and 95% CI level with 3.5% precision being set (Malhotra and Dash, 2010). The simple random sampling without replacement being followed where all samples have equal chance of being selected.
Cochran (1977) developed a formula to calculate a representative sample for proportions as

Where no is sample size, z is the selected critical value of desired confidence level, p is the estimated proportion of an attribute that is present in the population, q =1 – p and e is the desired level of precision.
Assuming the maximum variability, which is equal to 50% ( p =0.5) and taking 95% confidence level with ±5% precision, the calculation for required sample size will be as follows:
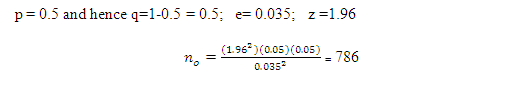
Subjects: During June 2016-March 2017 the structured questionnaire was circulated through google form link and hard copy wherever required to over 900 employees of agricultural research sector and received 826 responses and 756 responses was selected and 70 responses were not considered because the response were not complete.
General characteristics : The general characteristics examined are respondents age, gender, marital status and level of education. Age was stratified into four groups: 20-29 years, 30-35 years, 36-40 years and >40 years.
Health behaviours and work-related factors : The participants were asked to fill about smoking habits, whether diabetic or not, suffer from hypertension, employment tenure, working hours per week, depressive symptoms for examining the psychological factors, work-related factors that cause stress – physiological factors, job insecurity, lack of control, lack of rewards, excessive job demand and social support. The statements of like “Over the past six months have you experienced any stress? Did stress effect your job performance?” used and measured using dichotomous variables Yes/No for measuring the general characteristics smoking, diabetic, hypertension, etc.
Assessment of occupational stress and its effect on performance: The occupational stress scale based on occupational stress index constructed and standardized by Srivastava and Singh (1984); the modified version of the performance scale (Campbell 1990) and coping strategies scale constructed and standardized by Srivastava (2001) was used for assessing the occupational stress and its effect on employee performance.
| Demography of the sample | ||
| Gender | Frequency | Percent |
| Women | 381 | 50.40 |
| Men | 375 | 49.60 |
| Total | 756 | 100 |
| Sample description | ||
| Age group (Years) | No of respondents | Percentage |
| 20-29 | 226 | 29.9 |
| 30-35 | 265 | 35.0 |
| 36-40 | 173 | 22.9 |
| >40 | 92 | 12.2 |
Research instrument used for the survey is a standardized, structured undisguised questionnaire, the main source of primary data collection. Secondary data was collected from archives of websites, journals, and conference papers. The questionnaire was divided into two sections and in the Section I the information related to the general characteristics was gathered. The occupational stress levels and their impact on employee performance was measured using the Section II of the questionnaire. To measure the each factor a range of 5-8 statements related to the occupational stress factors and employee performance were used to gather data using a 5-point likert type scale. The questions were systematically mixed to avoid the bias. The factor analysis was used to reduce the factors to 7 with the help of SAS 9.4 ver (Table 1)
| Table 1. Occupational stress factors causing effect on employee performance | ||
| Factor | Description | Factors |
| 1 | Work in shifts | 6 factors –Shift work, reliever issues, transport issues during late shifts |
| 2 | Job demand | 6 factors- Seasonal job demand, several job assignment, job place, excessive work pressure, time management, etc. |
| 3 | Working Hours | 5 factors – late hours, transport issues, continue to work more than 8 hours/day, issues of late hours, food |
| 4 | Lack of Control | 8 factors – Job independency, decision making issues, sub-ordinate control etc. |
| 5 | Social Support | 8 factors – social support issues like instrumental support, emotional support, support from family, tangible support, informational support etc., |
| 6 | Job Insecurity | 6 factors- termination, pink slip, place insecurity, transfer, job stability etc. |
| 7 | Lack of reward | 6 factors – appreciation, cash rewards, promotions, involving in decisions, etc., |
| 8 | Performance | 5 Factors – Experience Stress, effect on output, absenteeism, poor work relations |
Reliability of the research instrument: The Likert-type scale with items 1-5 was used (where 1=Strongly disagree, 2=Disagree, 3=Neutral, 4=Agree and 5=Strongly agree) in this study. The reliability statistic C-alpha coefficient value was calculated to test the internal consistency of the instrument, by determining how all items in the instrument related to the total instrument (Cronbach, 1951; Gay, Mills, and Airasian, 2006). This instrument was tested on a pilot group of 100 employees each among both men and Women. They were asked to fill out the 55-questions, and requested to select the appropriate answer on 5-point Likert Scale. After analysing their responses from the pilot study with SAS program, the C-alpha statistic was found to be 0.62 and 0.75 respectively for Men and Women with overall C-alpha 0.73, suggesting a strong internal consistency. Three months later, the same instrument was used with 756 employees, 375 Men and 391Women to collect the responses. Five questions were dropped out from a set of 50 questions because of unsatisfactory C-Alpha coefficient values. The C-Alpha values for the seven independent and one dependent factor ranged from 0.67 to 0.83 for Men and from 0.64 to 0.86 for Women, whereas the overall C-alpha values are, 0.87 and 0.79 for respectively for Men and Women. The increase in C-alpha values is an effect of dropping the five questions with low C-Alpha values (Table 2).
|
Table 2. Cronbach’s alpha values for factors used in this study |
|||
|
Sl. No |
Factor |
Cronbach’s alpha |
|
|
Women |
Men |
||
|
Overall independent Stress Factors (1-8) |
0.79 |
0.83 |
|
|
1 |
Shift work |
0.64* |
0.67 |
|
2 |
Working Hours |
0.71 |
0.81 |
|
3 |
Lack of control |
0.72 |
0.83 |
|
4 |
Social Support |
0.82 |
0.71 |
|
5 |
Job-insecurity |
0.80 |
0.73 |
|
6 |
Lack of reward |
0.78 |
0.74 |
|
7 |
Social support |
0.84 |
0.70 |
|
8 |
Performance |
0.76 |
0.77 |
|
Overall: C-alpha: 0.83; Women: 0.79; Men: 0.83(*very few women work in shifts) Source: Primary Data |
|||
Statistical analysis
The chi-squared test was applied to study the if any statistically significant association between occupational stress factors, general characteristics and its effect on performance. Univariate and multivariate logistic regression analysis carried out to test the statistical association between seven occupational stress causing factors – Shift work, Demanding job (excessive work demand), Working Hours, Lack of Control, Social Support, Job Insecurity, Lack of reward and their effect of employee performance. The univariate logistic regression analysis was carried out to determine the influence of occupational stress factors and employee performance, and the multivariate logistic regression analysis was carried out to adjust the variables showing statistically significant association in the univariate analysis. All the statistical analyses were conducted using Statistical Analysis System (SAS) ver. 9.4.
Results
Influence of general characteristics and health behaviours on employee performance : The association between general characteristics, physiological and psychological factors are presented in Table 3. In this study Women (50.4%) and men 49.6%) participants more or less equal. There was a high correlation between gender parity ( p =0.028), Age group (p<0.001), Marital status (p =0.009), having children ( p <0.01), diabetes ( p <0.01), physiological factors ( p <0.001), psychological factors (p=0.003) and experience (tenure of employment, p<0.01) shown significant association with employee performance. The employee health factor hypertension shown no statistically significant association with employee performance ( p =0.612). Therefore except, hypertension all other factors effecting the employee performance, however the association between the general characteristic age group, having children, health factor diabetes and tenure of employment more significant effect on employee performance.
|
Table 3: The association between general characteristics, occupational stress factors physiological and psychological factors, and its effect of employee performance |
|||||
|
Effect on Performance |
|||||
|
Gender |
N2 |
% |
Numbers |
% |
p-value1 |
|
Women |
381 |
50.4 |
236 |
61.9 |
0.028 |
|
Men |
375 |
49.6 |
208 |
55.5 |
|
|
Age (Years) |
|||||
|
20-29 |
226 |
29.9 |
26 |
11.5 |
<0.01 |
|
30-35 |
265 |
35 |
157 |
59.2 |
|
|
36-40 |
173 |
22.9 |
87 |
50.2 |
|
|
>40 |
92 |
12.2 |
57 |
62.0 |
|
|
Marital status |
0.009 |
||||
|
Married |
623 |
82.4 |
444 |
71.3 |
|
|
Unmarried |
123 |
17.6 |
56 |
45.5 |
|
|
Children |
<0.001 |
||||
|
Yes |
542 |
71.7 |
431 |
79.5 |
|
|
No |
224 |
29.3 |
13 |
5.8 |
|
|
Diabetic |
|||||
|
Yes |
348 |
46.0 |
296 |
85.0 |
<0.001 |
|
No |
408 |
54.0 |
148 |
36.2 |
|
|
Hypertension |
|||||
|
Yes |
287 |
38 |
165 |
57.5 |
0.612 |
|
No |
469 |
62 |
287 |
61.2 |
|
|
Physiological |
<0.01 |
||||
|
Yes |
375 |
49.6 |
221 |
58.9 |
|
|
No |
381 |
50.4 |
112 |
29.4 |
|
|
Psychological |
0.003 |
||||
|
Yes |
175 |
23.1 |
81 |
46.3 |
|
|
No |
581 |
76.9 |
164 |
28.22 |
|
|
Experience (Years) |
<0.01 |
||||
|
0-5 |
188 |
24.9 |
16 |
8.5 |
|
|
6-10 |
318 |
42.1 |
196 |
62.2 |
|
|
11-15 |
159 |
21.0 |
85 |
53.5 |
|
|
>15 |
91 |
12.0 |
56 |
61.5 |
|
|
1Comparison by chi-square test 2All numbers are based on weighed frequencies\ |
|||||
The univariate analysis of occupational stress factors and employee performance are presented in Table. The performance of the employees who work in shifts slightly more effected than non-shift workers as the shift workers were more prone to occupational stress than the non-shift employees, however the differences were not statistically significant ( p =0.55). The performance of the group whose job is more demanding (64.0%) significantly affected when compared with low demand of job (29.1%) and the differences are statistically different (p=<0.01). The group of employees who worked >60 workers per week (53.8%) showed high occupational stress so more effect on their performance when com compared with <40 hrs per week (13.8%), 41-50 hours per week (19.1%), 51-60 hrs (17.1%) and the differences are statistically different (p=<0.01). Occupational stressors like lack of control, social support, job insecurity and lack of reward have statistically significant association with performance. The stress factor lack of control (p<0.01) effects performance significantly when compared with other factors (social support p =0.029, job insecurity p =0.024 and lack of reward ( p =0.042) Table 4.
|
Table 4: The association between occupational stress factors and performance |
|||||
|
Effect on Performance |
|||||
|
N2 |
% |
Numbers |
% |
p-value1 |
|
|
Shift work |
|||||
|
No |
671 |
88.75 |
135 |
20.1 |
0.55 |
|
Yes |
85 |
11.25 |
20 |
23.5 |
|
|
Demand Job |
|||||
|
Low |
423 |
55.5 |
123 |
29.1 |
<0.001 |
|
High |
333 |
44.5 |
213 |
64.0 |
|
|
Working hours/week |
|||||
|
<40 |
362 |
47.9 |
50 |
13.8 |
<0.01 |
|
41-50 |
220 |
29.2 |
42 |
19.1 |
|
|
51-60 |
105 |
14.1 |
18 |
17.1 |
|
|
>60 |
69 |
8.8 |
35 |
53.8 |
|
|
Lack of control |
|||||
|
Low |
521 |
68.9 |
123 |
23.6 |
<0.01 |
|
High |
235 |
31.1 |
111 |
47.2 |
|
|
Social Support |
|||||
|
Low |
587 |
77.65 |
233 |
39.7 |
0.029 |
|
High |
169 |
22.35 |
45 |
26.6 |
|
|
Job insecurity |
|||||
|
Low |
616 |
81.48 |
400 |
64.9 |
0.024 |
|
High |
140 |
18.52 |
67 |
47.85 |
|
|
Lack of reward |
|||||
|
Low |
456 |
60.32 |
245 |
53.7 |
0.042 |
|
High |
300 |
39.68 |
123 |
41.0 |
|
|
1Comparison by chi-square test 2All numbers are based on weighed frequencies |
|||||
The multivariate analysis of occupational stress factors and their association with employee performance at 95% CI is shown in Table. Working in shifts (p=0.39, OR) demanding job (p=0.54, OR), lack of control (p=0.67, OR) and lack of reward (p=0.29, OR) has no statistically significant relationship on its association with performance. However, working for long hours has significant risk factor and effect employee performance. Compared with the reference group of <40 hours/week, the ORs for working >60 hours 1.94 (95% CI 1.65-2.44), 51-60 hrs 1.41 (95% CI 1.09-1.71); and 41-50 hours 1.12 (95% CI 1.02-1.41) and P<0.01 for unadjusted model, whereas 1.87 (95% CI 1.54-1.62), 1.52 (95% CI 0.97-1.76), and 1.17 (95% 1.03-1.61) (p<0.01) in adjusted model respectively, indicating statistically significant association between working hours and effect on employee performance.
We also found statistically significant association between occupational stress factors and employee performance were significant for Job insecurity and social support. The odds ratios for job insecurity 3.42 (95% CI 2.86-6.83) social support 4.47 (95% CI 4.38-5.98) for unadjusted model and 4.27 (95% CI 2.86-6.87) and 4.47 (95% CI 4.38-5.98) respectively. Lack of inadequate support and high job insecurity significantly influence on the occupational stress and employee performance (Table 5.)
Discussion
In this study we identified the association between occupational tress factors and its effect on employee performance using the large representative data collected through a survey questionnaire circulated among the agricultural research sector employee in and around the Hyderabad. We have observed a strong association between employee performance and factors like gender, age, health factor, diabetes, marital status. The women experience more stress than the men because of their dual roles as employee and handling the family. The physiological factors like back/neck pain, short of breathlessness, nervousness, relaxing issues, psychological factors like anxiety, sleep disorders, health conditions and depression will cause the stress and effect the performance. This hypothesis was supported by recent studies (de Graaf et al. 2012). We also found significant relationship between working hours and effect on performance. Those who worked more than 60 overs per week had nearly a 2-fold higher odds ration than those who worked 40 or less hours per week. Respondents working 51-60 higher odds ration followed by 41-50 hours. This explains the adverse health effects of long working hours and this is in line with the studies carried out by (Kivimaki et al. 2011 and Karasek R, 1981).
|
Table 5: Univariate and multivariate logistic regression analysis of occupational stress factors and their association with employee performance (the odds ratios and 95% CI levels) |
||||||
|
Unadjusted OR |
Adjusted OR1 |
|||||
|
OR |
(95% CI) |
p |
OR |
(95% CI) |
p |
|
|
Shift work |
||||||
|
No |
1.00 |
1.00 |
||||
|
Yes |
1.21 |
0.92-1.36 |
0.45 |
1.10 |
0.81-1.41 |
0.39 |
|
Demanding Job |
||||||
|
Low |
1.00 |
|||||
|
High |
1.76 |
1.54-2.25 |
0.68 |
1.62 |
1.47-2.92 |
0.54 |
|
Working hours/week |
||||||
|
<40 |
1.00 |
1.00 |
||||
|
41-50 |
1.12 |
1.02-1.41 |
1.17 |
1.03-1.61 |
||
|
51-60 |
1.41 |
1.09-1.71 |
<0.01 |
1.52 |
0.97-1.76 |
<0.01 |
|
>60 |
1.94 |
1.65-2.44 |
1.87 |
1.54-2.67 |
||
|
Lack of control |
||||||
|
Low |
1.00 |
1.00 |
||||
|
High |
0.97 |
0.87-1.14 |
0.55 |
0.98 |
0.84-1.31 |
0.67 |
|
Social support |
||||||
|
Low |
1.00 |
1.00 |
||||
|
High |
4.42 |
2.76-6.74 |
<0.01 |
4.47 |
4.38-5.98 |
<0.01 |
|
|
||||||
|
Low |
1.00 |
1.00 |
||||
|
High |
3.42 |
2.86-6.83 |
<0.01 |
4.27 |
2.86-6.87 |
<0.01 |
|
Lack of reward |
||||||
|
Low |
1.00 |
1.00 |
||||
|
High |
1.72 |
1.67-3.86 |
0.34 |
1.67 |
1.32-2.94 |
0.29 |
|
1Adjusted model for all listed variables ; OR: odds ratio; CI: Confidence interval |
||||||
The other stress causing factors which have strong association with the employee performance are job insecurity and social support. There was an increase in odds ration with increase in social support indicating the adequate social support will reduce the stress and improves the performance. The similar results were reported in a study carried on CBSE teacher in and around Hyderabad (Prasad et al. 2016). The insecurity was studied the factors of job displacement, change of work place in the same organization, unable to code the new technologies. The job insecurity is one of the major factors of occupation stress in our study and this confirm the studies carried out by (Prasad et al. 2015). Most of our results are in confirmatory with the results of the several studies of the recent past published in referred journal articles.
The main reason for conducting this study is that authors are unable to find sufficient literature for finding the association between occupational stress factors and its relationship with performance. We made a sincere attempt to use multivariate logistic regression analysis and univariate logistic regression to analyse dichotomous data and like odd ratios using adjusted and unadjusted models.
The limitation of the study is that the authors are not aware that the responses are submitted are top of the mind decision and are own, not influenced by other factors. We have used the Cronbach Alpha reliability statistic to measure the internal consistencies of the research instrument. However, survey research other limitation like the authors have no idea the environment and mood of the respondent when submit the questionnaire. We are surprised by the active participation of the women employees and receipt of the responses were quick and frank compared with men employees. We recommend this type of studies considering gender-related parity on each and every occupational stress factor and its effect on performance.
Burton, W.N., Chen, C.Y., Conti, D.J., Schultz, A.B., & Edington, D.W. 2006. The Association Between Health Risk Change and Presenteeism Change. Journal of Occupational and Environmental Medicine. 26, 252–263. doi: 10.1097/01.jom.0000201563.18108.af.
Campbell, J.P., 1990. Modelling the performance prediction problem in industrial and organizational psychology. In S.M. Jex, Stress and Job Performance TheorY, Research and Implications for Managerial Practice, Sage Publications (1998).
Cochran, W.G. (1977). Sampling techniques (3rd ed.). New York: John Wiley & Sons.
Cronbach, L.J. (1951). Coefficient alpha and inter structure of tests. Psychometrika 16, 297-334.
de Graaf, R., Tuithof, M., van Dorsselaer, S., ten Have M., (2012). Comparing the Effects on Work Performance of Mental and Physical Disorders. Soc Psychiatry Psychiatr Epidemiol. 26(11), 1873–1883. doi: 10.1007/s00127-012-0496-7.
Deguchi, Y., Iwasaki, S., Ishimoto,H., Ogawa, K., Fukuda, Y., Nitta, T., et al. (2017) Relationships between temperaments, occupational stress, and insomnia among Japanese workers. PLoS ONE 12(4): e0175346. https://doi.org/10.1371/journal.pone.0175346.
Gay, L.R., Mills, G.E. & Airasin, P. (2009) Educational Research: Competencies for Analysis.
Goyal, K.C, 2017. Stress Audit of Employees working in Information Communication and Technology Industry. Pacific Business Review International. 9(10):81-87.
KaraseK, R., Baker, D., Marxer, F., Ahlbom, A., Theorell, T. (1981). Job Decision Latitude, job Demands, and Cardiovascular Disease: a Prospective Study of Swedish men. Am J Public Health. 26(7), 694–705. doi: 10.2105/AJPH.71.7.694
Kivimaki, M., Batty, G.D., Hamer, M, Ferrie, J.E., Vahtera, J., Virtanen, M., Marmot, M.G., Singh-Manoux, A., Shipley, M.J., (2011). Using Additional Information on Working Hours to Predict Coronary Heart Disease: a Cohort Study. Ann Intern Med. 26(7), 457–463. doi: 10.7326/0003-4819-154-7-201104050-00003
Lee, K.H., Ho Chae C., Ouk Kim Y, et al. (2015). Anxiety symptoms and occupational stress among young Korean female manufacturing workers. Annals of Occupational and Environmental Medicine . 2015;27:24. doi:10.1186/s40557-015-0075-y.
Levi, L. (1998), Preface: “Stress in organizations theoretical and empirical approaches”, in Cooper C L (Eds.),Theories of Organizational Stress, OxfordUniversity Press, New York.
Loosemore, M., & Tom Watrs, T. (2004). Gender differences in occupational stress among professional in construction Industry. Journal of Management in Engineering 20(3), 126.
Lotfizadeh, M., Maimaiti, N., & Ismail, NH. 2014. Occupational stress among white collar employees in Esfahan Steel Company, Iran. Malaysian Journal of Public Health medicine 14(1):79-81.
Malhotra, S., and Dash, N.K. (2010). Marketing Research. 6th Edition. Pearson Education.
Matthews, G. (2001). Levels of transaction: A cognitive science framework for operator stress”, In P A Hancock and P A Demond (Eds.), Stress, Workload and Fagigue, Mahwah: NJ Erlbaum, pp 5-33.
Midgley, S. (1996). Pressure Points (managing job stress)”, Journal of People Management, Vol. 3, No. 14, pp.36.
National Institute for Occupational Safety and Health (NIOSH). 2014. NIOSH working group: DHHS (NIOSH) Publication Number 99-101, Stress at Work [http://www.cdc.gov/niosh/docs/99-101/] Access date: November 28th, 2014.
Osipow, S.H., & Spokane, A.R. (1987). Occupational stress inventory manual (research vision). Odessa, FL: Psychological assessment resources.
Pareek, U. (1983). Organizational role stress scale, ORS Scale Booklet, Answer Sheet and Manual. Ahmedabad: Navin Publications.
Prasad, K.D.V. & Vaidya, R. 2017. Causes of Stress Among PhD Research Scholars with Reference to Rashtrasant Tukadoji Maharaj Nagpur University: An Empirical Analysis. International Review of Management and Research 6(2), 472-480.
Prasad, K.D.V., Vaidya, R., & Anil Kumar V. (2016). Study on The Causes of Stress Among The Employees In It Sector and Its Effect on The Employee Performance at The Workplace With Special Reference To International Agricultural Research Institute, Hyderabad: A Comparative Analysis. International Journal of Management, 7(4), 2016, pp.76–98.
Prasad, K.D.V., Vaidya, R., & Anil Kumar, V. (2015). A study on causes of stress among the employees and its effect on the employee performance at the workplace in an International Agricultural Research Institute, Hyderabad, Telangana, India. International Journal of Management Research and Business Strategy, 4(4), 68-82.
Prasad, K.D.V., Vaidya, R., & Kumar, V. A. (2016). Teacher’s Performance as a Function of Occupational Stress and Coping with Reference to CBSE Affiliated School Teachers in and around Hyderabad: A Multinomial Regression Approach. Psychology , 7, 1700-1718. http://dx.doi.org/10.4236/psych.2016.713160
Prasad, K.D.V., Vaidya, R., and Anil Kumar, V. (29016). An empirical study on the causes of occupational stress and its effect on performance at the workplace of Supermarkets in Hyderabad. Innovative journal of business and management 94-104.
Rosenstock, L.C., Brodkin, M.R., & Redlich, C.A. (2014). Clinical Occupational and Environmental Medicine. Second (ed), Psychologic Stressors and Work Organization, New York: Elsevier Saunders. Pp. 931-942.
SAS Institute Inc. 2008. SAS/STAT® 9.4 user’s Guide, Cary, NC: SAS Institute Inc.
Selye, H. (1956). “The Stress of Life”, New York: McGraw Hill.
Srivastava, A.K., & Singh, A.P. (1984). The occupational stress index. Mahavaigyanic parikshan Sansthan, Varanasi, India.
Srivastava, A.K., Coping Strategy Scale, (2001), Rupa Psychological Centre, Varanasi, India
Sung-Hwan Jeon, Jong-Han Leem, Shin-Goo Park, Yong-Seok Heo, Bum-Joon Lee, So-Hyun Moon, Dal-Young Jung, and Hwan-Cheol Kim. 2014. Association among Working Hours, Occupational Stress, and Presenteeism among Wage Workers: Results from the Second Korean Working Conditions Survey. Annals of Occupational And Environmental Medicine. 26:6 doi: 10.1186/2052-4374-26-6.
Suraksha and Kuldip chikkara. (2017) An Empirical Study of the Factors of Occupational Stress in Indian Banking Industry 9(8):-40.
Uehata, T. 1991. Long working hours and occupational stress-related cardiovascular attacks among middle-aged workers in Japan. Journal of Human Ergol. 29(2), 147-153.