Pacific B usiness R eview I nternational

A Refereed Monthly International Journal of Management Indexed With THOMSON REUTERS(ESCI)
Rabichandra Singh Elangbam
Research scholar,
Economics Department, The Maharaja University of Baroda
Vadodara, Gujarat.
The economic reforms initiated in the early 90s were a watershed in Indian planning. Never before did we have such systemic and substantial reforms in our economic policies. The reforms were ranging and it was considered that it had covered the aspect of short term crisis management as well as the long term structural changes which can improve the efficiency and the productivity of an economy and also putting the economy to the sustainable path of growth with equity and social justice.
After two decades of the reforms, this paper discuss the relevant changes in terms of employment content all over India as well as the north eastern states of India namely Arunachal Pradesh, Assam, Manipur, Meghalaya, Mizoram, Nagaland, Sikkim and Tripura. Took the help of NSSO rounds from 1993-94 (50th round) to 2011-12 (68th round) and used the Shapeley decomposition method as well as employment elasticity to see the situation.
It has been found that all India as well as NER has been largely jobless growth. It is the increase in output per worker across the country and NER states that have led to the growth in per capita income. The negative contributions of demographic factors imply burden of dependency on the workers. The contribution of growth in employment rate has been negligible.
Keywords: Economic Growth, Jobless Growth, Shapeley Decomposition
I Introduction :
The economic reforms initiated in the early 90s was a watershed in Indian planning. Never before did we have such systemic reforms in our economic policies. The reforms were wide ranging and included short term measures aimed at crisis management as well as longer term measures of structural reform aimed at improving efficiency and productivity and putting the economy back on the path of sustainable growth with equity and social justice.(Economic Survey 2015-16 vol. I :2)
Two characteristics of post reform labour market are
Jobless growth can forfeit an economy the benefits of demographic dividends. “Developing with jobs” was the theme of ‘World of Work Report 2014’. Quality jobs in terms of decent work and social protection would be one of the central goals in the post 2015 development agenda. Employment is the link between growth and poverty alleviation. Income generated through work is critical to poor households. Improved employment outcomes are essential to promoting economic inclusiveness and ensuring that economic growth leads to sustainable reduction in poverty and inequality. Basu & Maertens (2007: 165) has succinctly explained this by saying “ Indeed it is arguable that growth is valuable precisely because it enables a country to banish poverty and achieve greater equality . India’s trajectory over the last 15 years has been remarkable but there will truly be reason to celebrate this when the overall gains filter down to the poorest and most deprived sections of India’s vast population .”
For instance during 2005-12 when the economy grew at 8.3% per annum, employment grew at only 0.4% per annum, adding only 13 million new jobs in 7 years. Economic growth in India has failed to strike a balance between growth of productivity and employment. Unemployment was accumulating during the first three decades of planning ( Papola 2013:2). During the 80s , of the 5.5% growth of GDP , 2% was accounted by growth of employment and in the 90s growth of 6% , 1.8 % was accounted by growth of employment and in the 2000s growth of 7.5% the contribution of employment growth was only 1.5% and the balance came from productivity growth. Thus it shows a growth with low and declining content of employment. bThe availability of detailed information from 1972-73 ( NSSO Quinquennial surveys) changed the official approach to employment and a number of employment generation and poverty alleviation programmes were started since the fifth five year plan (1974-79).
II Selective survey of Post reform labour market scenario :
Deshpande & Deshpande (1998) examined the impact liberalisation had, in the short run in the labour market in India. By use of simple before and after comparisons made by the publication of the 50th survey round of the NSSO on employment and unemployment in India, the impact of' liberalization is assessed. 'The demand for labour increased after liberalisation but the increase was not shared evenly in rural India between men and women, and regular and casual workers. By and large, the demand for casual intermittent work increased faster than regular work. The structure of employment moved away the primary sector for rural men, but rural women lost in employment, real wages and the share of primary in their employment increased. Gender-based inequality in earnings of casual workers was reduced but that the earnings of regular workers increased. Liberalisation has affected casual workers, particularly the female casual workers, more favourably than regular workers.
Chadha & Sahu(2002) examine the pace and pattern of rural employment growth in the 1990s in 17 major Indian states using NSS data They point out at the all India level the decline in LFPR, relatively higher decline in age group 10-14 years and 15-19 years, a higher proportion of rural children, rural adolescents and rural youth becoming a part of labour force, lower WPR for females. At state level LFPR for rural persons declined in 14 states out of 17. It happened both for rural males and rural females reflecting rural people’s changing approach towards investment in human beings. WFPR remained practically unchanged in most parts of rural India. Inter sector shifts of labour slowed down, the pace of rural workers’ shift to non agricultural sectors became halting. Irrespective of the structural shifts, in most states agriculture continues to be the mainstay of rural female workers. Rural workers employment in manufacturing has been of low order. The incidence of self employment in rural India has declined and casualisation has quickened. While for rural male workers the increasing casualisation is accompanied by a decline in share of self employment, for rural female workers there is no such inverse relationship. There is a slowdown in rate of growth of employment, particularly agricultural employment.
Prakash,B.A. (2002) examines urban unemployment in Kerala with special reference to Kochi city using primary data based on a sample survey conducted in Kochi city during the first quarter of 1999. The problem of unemployment is basically the problem of youth, as 73 per cent of the unemployed belong to the age group of 15-24. The incidence of unemployment among the educated with secondary and higher secondary education is also very high. The high rate of unemployment in the city may be attributed to low growth of employment, structure of labour market characterised by informal and casual employment, casualisation of labour, low participation of women in economic activities, preference of educated youth for regular jobs, social factors discouraging participation of unemployed labour in economic activities and the re- cession experienced in Kerala since the second half of the 1990s. The high incidence of unemployment among the educated youth may be due to the large supply of an educated, young labour force leading to excess supply of labour on the one side and the small size and slow growth of the organised sector leading to a low demand for regular employment, on the other.
Bhaumik (2003) examines the magnitude and growth of unemployment based on current daily status concept in post reform India using NSS data from 1983 to 1999-2000 in all India and 15 major states. It also examines the effectiveness of the strategy of attaining maximum GDP/NSDP growth rate for reducing unemployment in the country. There was significant increase in the number of unemployed in all India as well as states in the post reform era. Nearly ¾ of the total unemployed in India were concentrated in seven states viz West Bengal,Tamil Nadu,Maharastra,Andhrapradesh,Bihar,Kerala and Uttarpradesh.. Majority of the unemployed are from rural areas. The cross section evidence shows a reversal of the relationship between growth of NSDP and unemployment rates- changing from negative to positive association bringing up the issue of the quality and composition of growth.
Mahendra & Mahajan (2003) examine the nature of the employment problem in Andhrapradesh using NSS data during 1983 to 1999-2000. The decline in employment growth in the 90s is attributed to decline in participation rates of younger people who try to gain access to education and stay in school longer and also the rising income levels. The work participation rates declined significantly in both rural and urban areas in the 1990s. The incidence of child labour is the highest in the country. - The employment growth recorded a drastic decline during 1993-94 to 1999- 2000 compared with the for the period 1983-84 to 1993-94. The growth of employment in the organised sector has declined over time . since 1983. The diversification of employment has been slower in AP compared with all-India in the 90s. state. The problem of unemployment is more with the educated and youth. - Casualisation has been increasing over time. Labour productivity showed high growth in agriculture and manufacturing in the 1990s.
Hirway &Shah (2011) examine the experience of Gujarat which has emerged as one of the fastest growing states under globalisation in India, particularly after 2000. Though the wpr in Gujarat is better compared to other states, the employment generated is of poor quality, resulting in the state slipping in poverty reduction and human development. The relatively high percentage of working poor in the state is also reflected in the Global Hunger Index brought out by the International Food Policy Research Institute. Gujarat is in the "alarming Category", and ranks 13 among 17 major Indian states for which the index has been compiled .It appears that economic reforms in Gujarat have been translated into denying a fair share to labour and providing extra incentives to industry.
Aggarwal (2014) examined , using Shapely decomposition, growth employment linkages at the aggregate level and by sectors in India using NSS data for 1972-73,1983,1993-4,2004-05 and 2011-12. She also examined the sources of labour productivity growth in terms of total factor productivity growth, movements of employment from one sector to another and changes in the capital-output ratio. The results suggest that growth of per capita income in India has been largely driven by labour productivity growth. Employment effects have been small. Intersectoral shifts in which workers move from low productivity to higher productivity sectors have worsened over time.
III Selective survey of Post reform labour market scenario in NER of India
Chadha & Sahu(2002:2000) argue that “ given the size and regional diversity in resource structure, technology in use, and ace and pattern of economic ,including agricultural, growth, the employment changes observed at the all India level are likely to hide wide state level variations in employment.” This indicates the need for careful analysis of state level data to understand post reform labour market scenario in India. State level analysis of post reforms employment-unemployment scenario is not as abundant as literature dealing with economic growth in major Indian states. The North-eastern region, in spite of its immense heterogeneity, has been represented by Assam in most of the studies- the other seven states omitted due to their ‘small ness’- in terms of their contribution to national income. In terms of area Arunachal pradesh is larger than Assam despite having the lowest population density in the country and Sikkim, the smallest north-eastern state , has one of the highest per capita incomes in the country.
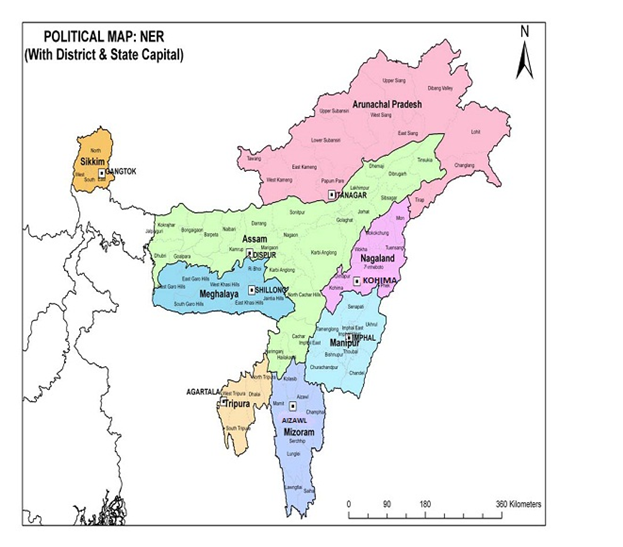
The North Eastern Region (NER) comprises of Arunachal Pradesh, Assam, Manipur, Meghalaya, Mizoram, Nagaland, Sikkim and Tripura and extends to north and east of the narrow Siliguri corridor. These eight states cover an area of 2,62,189 sq. km. constituting 7.98 percent of the country’s total geographical area and account for only around 3.78 percent of the total population. Except for Assam the other states lack in connectivity. The region has 5484 km of international border which is 98% of its border with China and Bhutan in the north, Myanmar in the east and Bangladesh in the south and west. Yet the region became land locked due to geo politics at the time of independence. Except for Nepal and Bhutan, connectivity with other neighbouring countries used to be unstable .Since independence the trade & commerce of the region has been through the narrow 27km wide Siliguri corridor. Now geopolitics has brought this region at the centre stage with the initiation of India’s Act East policy leveraging the region’s growth with the dynamic markets of ASEAN and East Asia.
The standard of living of the people in the region, as measured by real per capita Net State Domestic Product (NSDP), has lagged significantly behind the rest of the country. At Rs. 29119 in 2013-14, it was almost half of all-state average of Rs. 44875 in 2004-5 prices. Available information shows that at the time of independence per capita income in the undivided state of Assam was higher than the national average by 4 percent. Thus, even under the British colonial rule the economic performance of the region was better than the rest of the country and this shows its vast developmental potential ( NER Vision 2020;5). The slow progress of NER’s economy is reflected in the low growth in income. In the following section we review the few available literature dealing with employment and unemployment in the north east.
Table 1 :Unemployment rate in NER of India by current daily status
|
State |
Round(year) |
Rural |
urban |
||
|
Male |
Female |
Male |
Female |
||
|
Arunachal pradesh |
50(1993-94) |
19 |
4 |
18 |
73 |
|
55(1999-00) |
13 |
1 |
22 |
65 |
|
|
61(2004-05) |
16 |
11 |
26 |
119 |
|
|
68(2011-12) |
19 |
22 |
37 |
86 |
|
|
Assam |
50(1993-94) |
70 |
124 |
65 |
256 |
|
55(1999-00) |
60 |
125 |
99 |
219 |
|
|
61(2004-05) |
60 |
87 |
81 |
140 |
|
|
68(2011-12) |
49 |
89 |
58 |
73 |
|
|
Manipur |
50(1993-94) |
22 |
11 |
50 |
31 |
|
55(1999-00) |
24 |
26 |
66 |
76 |
|
|
61(2004-05) |
19 |
11 |
55 |
81 |
|
|
68(2011-12) |
31 |
44 |
58 |
119 |
|
|
Meghalaya |
50(1993-94) |
5 |
2 |
16 |
41 |
|
55(1999-00) |
5 |
5 |
35 |
69 |
|
|
61(2004-05) |
2 |
7 |
37 |
39 |
|
|
68(2011-12) |
9 |
6 |
27 |
46 |
|
|
Mizoram |
50(1993-94) |
10 |
5 |
4 |
5 |
|
55(1999-00) |
19 |
5 |
38 |
31 |
|
|
61(2004-05) |
8 |
3 |
13 |
22 |
|
|
68(2011-12) |
15 |
27 |
42 |
69 |
|
|
Nagaland |
50(1993-94) |
21 |
6 |
69 |
67 |
|
55(1999-00) |
28 |
31 |
98 |
104 |
|
|
61(2004-05) |
40 |
22 |
47 |
104 |
|
|
68(2011-12) |
199 |
302 |
205 |
451 |
|
|
Sikkim |
50(1993-94) |
6 |
17 |
19 |
49 |
|
55(1999-00) |
33 |
25 |
64 |
107 |
|
|
61(2004-05) |
29 |
21 |
33 |
55 |
|
|
68(2011-12) |
29 |
10 |
31 |
2 |
|
|
Tripura |
50(1993-94) |
34 |
104 |
82 |
215 |
|
55(1999-00) |
17 |
57 |
57 |
96 |
|
|
61(2004-05) |
122 |
374 |
189 |
589 |
|
|
68(2011-12) |
123 |
326 |
142 |
586 |
|
|
All India |
50(1993-94) |
56 |
56 |
67 |
105 |
|
55(1999-00) |
72 |
70 |
73 |
94 |
|
|
61(2004-05) |
80 |
87 |
75 |
116 |
|
|
68(2011-12) |
55 |
62 |
49 |
80 |
|
Source: NSSO (1996), NSSO (2001), NSSO (2006),NSSO(2014)
Table 1 shows the dynamics of unemployment by current daily status, the most inclusive measure, in the eight north eastern states during the post reforms period. Rural unemployment rate in general has been lower than urban unemployment rate. The unemployment rates in the NER states are found to be lower than all India except for Tripura ,Nagaland and urban Manipur in 2011-12. The all India pattern is a gradual rise during 1993-4 to 2004-5 and fall during 2004-5 to 2011-12. The falling phase is different in most of the NER states and the rates are lower except in Tripura and Nagaland. The unemployment rate in Nagaland rose suddenly during 2004-5 to 2011-12 . The unemployment situation has worsened except for Assam.
Das, Dubey &Pala (2007) highlighted the gender bias in the employment structure among the North Eastern region of India (excluding Sikkim) using the data generated by 55th round of NSS ( 1999-2000). The proportion of female headed households is very small in all north eastern states except Meghalaya which is a matriarchal society. Most of them are widows. In all the states labour force participation rates for females is lower than that of males . for the region as a whole labour force participation rates for rural females (20.93 %) is considerably lower than that of all India ( 38.13 %). The urban labour force participation for females (19.64%) is almost equal to the national average (19.46%). In the case of males the LFPR for this region are found to be lower but quite close to the national average. There is some evidence of gender bias in unemployment rates (usual principal status) in the North-Eastern region despite inter state variations. The paper also found large wage differentials among the males and females in the region with the average weekly wage of females being significantly lower than their male counterpart. The incidence of child labour is significantly high in case of girls in the urban sector in the North-Eastern region , higher than even the rest of India . the paper concludes that there is indeed some evidence of gender bias in the labour market in the region.
Elangbam B.K.S. (2007) studied the employment implication of globalization in the North –Eastern region of India using census data for 1981,1991 and 2001 and NSS 43 rd round (1987-8),50th round (1993-4) and 55 th round (1999-2000). He points out the inter state differences in labour market experiences in the region both over time and measures of unemployment. He also points out the disconnect between growing tertiarisation of the economies in the region and occupational structure which is dominated by agriculture. This stability in occupational distribution is not consistent with growth of decent and productive employment.
Sahu(2012) examined the employment scenario in the NER during 1993-4 to 2004-5 by using unit level data of various NSS rounds . He examined the changing pattern of work force and labour force participation rates and sectoral distribution of workers by broad sectors and the employment opportunities that have been available to female workers. Other important issues discussed were the changing nature of employment and the trends of poverty and unemployment, changes in employment growth rates and associated development during the period under discussion. He concluded that “ an empirical assessment of various rounds of NSS data suggests that the overall employment situation especially during the post 2000 period has been encouraging” ( Sahu(2012:27)) He raised an important question - why has the overall improvement in economic growth not been translated into generation of gainful employment ?
Tripathi (2016) used multinomial logit model using unit level NSS data on employment and unemployment from the 68th round of NSS (2011-12). the paper investigates the relevant household level economic determinants of employment and unemployment in India by focusing on North East India. he paper also suggests relevant policy options for increasing employment in India in general and North East states of India in particular. He concluded that persons who owned more land had more chance to become self employed and females also had a higher chance to become self employed. The estimated results show that the workers who own land have more chance to become self-employed and workers having higher level of education have less chance to become self-employed. Rural workers have low probability of being regular/salaried employees compared to urban workers. The number of rural women regular/salaried employees is the lowest among all categories. The results show that rural land owning workers have less chance of being casual workers. In addition, higher level of education reduces the chance of being casual labour. The results also show that none of the household factors are responsible for being unemployed. Finally, the results on North-East State show that rural females in 25-34 age group have a positive chance of being self-employed. However, self employment rate decreases with increasing level of higher education of the workers. In recent years, the North East states have experienced an increase in unemployment rate.
IV Objective , Methodology and Data base
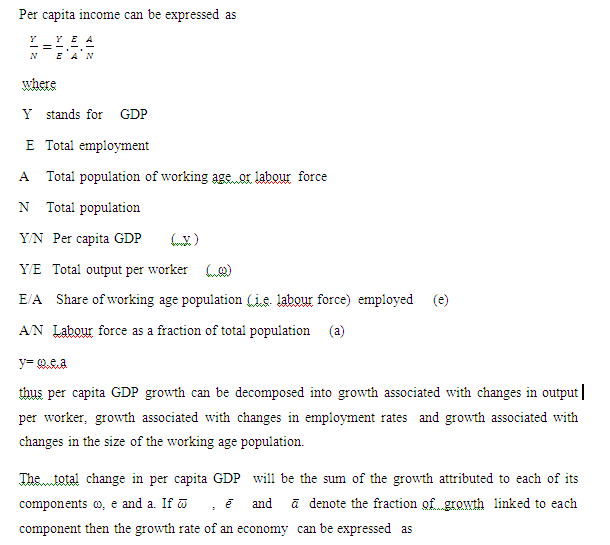
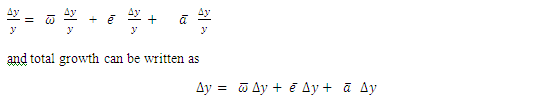
The purpose of this paper is to study the job content of post reforms economic growth in states in North Eastern Region of India by using Shapeley’s decomposition of growth of output.
There are several techniques for decomposing growth in GDP and attributing to each component ( employment, output per worker, capital and TFP) or to each sector a share of total observed growth. Estimation of employment elasticity of growth and TFP growth via regression analysis donor take into account changes in the population structure which may account for a significant share of per capita GDP growth . Total employment elasticity looks at changes in the level of employment, not at changes in employment rates. What matters for poverty reduction is however not the absolute number of employed but the number of employed relative to the labour force. Employment rates needs to be accounted for when population growth accounts for a sizable fraction of labour force growth as in developing countries. Positive employment elasticity may be consistent with growing unemployment rates. In this section, going beyond the traditional approach of using elasticities we use the Shapley decompositions to provide the necessary details about the quality of job created and if there has been increase in productivity. Shapely decompositions is a simple additive method that links changes in a particular component to changes in per capita GDP by taking into account the relative size of the sector or component as well as the magnitude of the change. It presents also a unified way of looking at all the components . However it is an exercise in growth accounting , these are accounting identities and should not be given a causal interpretation. This has been used by Byiers et al ( 2015) in the context of 13 countries i.e. Thailand, South Africa, Brazil, Mauritius, Chile, Vietnam, Indonesia, India, SriLanka, Mongolia, Ethiopia, Cambodia and Uganda. The period covered differ across countries. In the case of India the period covered is 1994-2012. There is no subperiod analysis.
Source : World Bank (PREM) Job Generation and Growth Decomposition Tool Reference Manual and User’s Guide p-5
.V Job content of post reforms economic growth in NER of India
In table 2 we Shapely decompose growth in per capita income into growth associated with output per worker, employment rate and share of working age population across the eight north eastern states in the post reforms era.
Table 2: Decomposition of growth in per capita NSDP(1993-4 to 2011-12)
|
STATES |
Period of study |
Growth linked to |
||
|
Out put per worker |
Employment rate |
Share of working population |
||
|
Arunachal |
1994 to 2000 |
-473.26 |
-314.86 |
888.11 |
|
2000 to 2005 |
13.60 |
-0.12 |
86.52 |
|
|
2005 to 2012 |
154.47 |
-4.36 |
-50.11 |
|
|
1994 to 2012 |
137.97 |
27.77 |
-65.74 |
|
|
Assam |
1994 to 2000 |
150.97 |
68.02 |
-118.99 |
|
2000 to 2005 |
43.61 |
10.41 |
45.98 |
|
|
2005 to 2012 |
149.93 |
-7.42 |
-42.52 |
|
|
1994 to 2012 |
105.65 |
2.47 |
-8.12 |
|
|
Manipur |
1994 to 2000 |
104.48 |
-2.37 |
-2.11 |
|
2000 to 2005 |
25.19 |
5 |
69.82 |
|
|
2005 to 2012 |
159.53 |
-8.80 |
-50.73 |
|
|
1994 to 2012 |
101.87 |
-3.35 |
1.48 |
|
|
Meghalaya |
1994 to 2000 |
154.71 |
-1.65 |
-53.06 |
|
2000 to 2005 |
38.84 |
0.51 |
60.64 |
|
|
2005 to 2012 |
133.68 |
0.50 |
-34.18 |
|
|
1994 to 2012 |
123.27 |
-0.21 |
-23.07 |
|
|
Mizoram |
1994 to 2000 |
n.a |
n.a |
n.a |
|
2000 to 2005 |
69.55 |
1.90 |
28.55 |
|
|
2005 to 2012 |
111.59 |
-6.61 |
-4.98 |
|
|
1994 to 2012 |
123.27 |
-0.21 |
-23.07 |
|
|
Nagaland |
1994 to 2000 |
864.97 |
22.85 |
-787.82 |
|
2000 to 2005 |
0.04 |
-0.46 |
100.42 |
|
|
2005 to 2012 |
157.67 |
-33.09 |
-24.59 |
|
|
1994 to 2012 |
86.13 |
-18.91 |
32.78 |
|
|
Sikkim |
1994 to 2000 |
122.83 |
-12.99 |
-9.84 |
|
2000 to 2005 |
56.21 |
3.44 |
40.35 |
|
|
2005 to 2012 |
81.06 |
1.33 |
17.61 |
|
|
1994 to 2012 |
80.42 |
-0.15 |
19.73 |
|
|
Tripura |
1994 to 2000 |
126.33 |
3.84 |
-30.17 |
|
2000 to 2005 |
83.98 |
-51.04 |
67.07 |
|
|
2005 to 2012 |
57.62 |
9.54 |
32.84 |
|
|
1994 to 2012 |
85.13 |
-9.95 |
24.82 |
|
Source: own computation from census and NSSO data
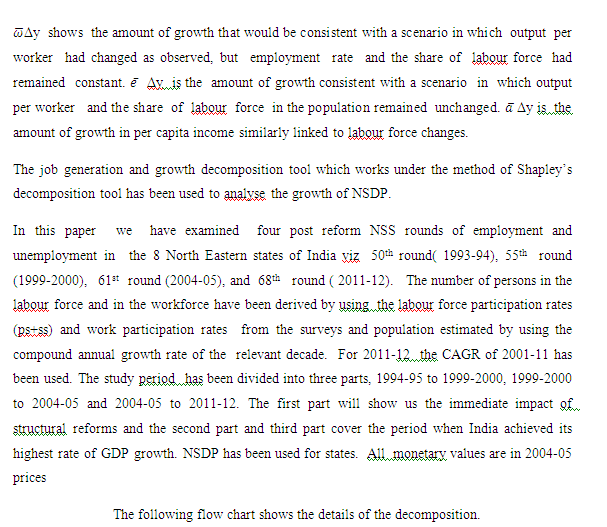
During 1994-2012 output per worker is the main factor behind growth of per capita NSDP in all states . In Nagaland, Sikkim and Tripura increase in participation in labour force played an important role. Growth linked to employment rate played an important role in ArunachalPradesh only. However sub period analysis at sub national level presented a diverse picture. During 1994 to 2000 only in ArunachalPradesh growth linked to share of working population was the dominant factor behind growth in per capita income. This was the strongest factor in Arunachal Pradesh, Assam, Manipur, Meghalaya, Nagaland during 2000-2005. In Nagaland the growth in per capita NSDP during this period came almost entirely from more people joining the labour force and the contribution of output per worker was negligible. In Sikkim the contribution of this component hovered around 80% and despite some flip-flops it was never negative in any state in any sub period except during 1994-2000 in Arunachal Pradesh. The swings were widest in Nagaland. The contribution of the other two factors flip-flopped between positive and negative values. Sikkim and Tripura are the only states in NER where higher participation in labour force consistently contributed to growth in per capita NSDP. Negative contribution implies withdrawal from the labour force , a phenomenon which needs to be looked into. It has implications for inclusivity of growth. From this perspective the quality of growth in Arunachal Pradesh, Assam, Manipur, Meghalaya and Mizoram may be relatively less inclusive than that in Nagaland ,Sikkim and Tripura. Except for Arunachal Pradesh all the NER states have positive contribution of output per worker, which means the productivity of the worker increased during the post reform period. For example if we look at Assam during 1994 -2000 the contribution of output per worker and employment rate to the growth is positive Similarly if we look at the cases of Nagaland and Tripura the share of working population declined,. In case of Manipur, Meghalaya and Sikkim not only there is a decline of share of working population but there is also fall in employment rate as it is shown in the table that the contribution of employment rate is negative. This can imply that as employment rate is falling many people have been discouraged and left the labour force during that period. The data shows classification of the states with similar patterns. For example Manipur, Meghalaya and Sikkim have similar pattern whereas Assam, Nagaland and Tripura have similar patterns too in different ways. However the magnitude is very much different from one state to another. Even the share of working population increased positively in all the states which implies that people became more optimistic of getting a job. It can be because of new openings of opportunity after the reforms of 1990s being implemented. However the employment rate is not all positive as states like Arunachal Pradesh, Nagaland and Tripura had negative contribution to the growth, especially Tripura has a very high magnitude of (-)51.04%.
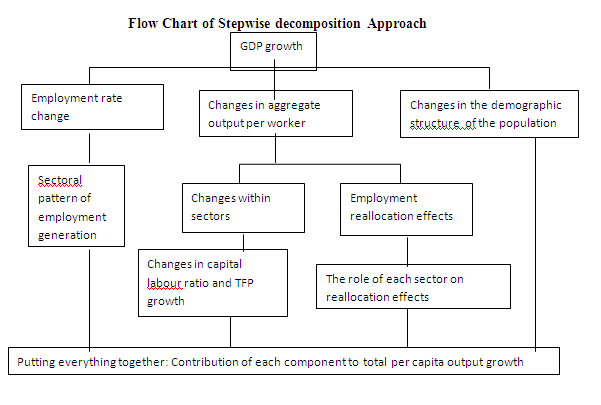
Using the Shapley approach, changes in aggregate output per worker can be decomposed into changes in output per worker within sectors and, movements of labour between sectors. Increases in output per worker within a sector will increase average output per worker.
Relocation of workers across sectors of different productivity levels can increase average output per worker if the final relocation results into a larger share of workers employed in higher productivity sectors. we can calculate the amount of growth in total output per capita that can be linked to changes in output per worker in sector i , and to intersectoral relocation of labour by combining the contribution of each of these components to changes in output per worker, with the contribution of changes in output per worker to total per capita growth The contribution of changes in output per worker within a sector can be interpreted as the total per capita growth consistent with a counterfactual scenario, in which all else (employment rate, demographics, and output per worker in the remaining sectors) had all remained unchanged, and the only change had been the observed change in output per worker in sector i. The contribution of the intersectoral shift component can be interpreted as a counterfactual scenario in which the employment rate, the demographic structure of the population and output per worker in each sector had remained unchanged, and labour had reallocated across sectors as observed.
Table 3 shows the contribution of within sector changes in output per worker and intersectoral shifts in change in per capita NSDP . Per capita NSDP can grow through increase in sectoral productivity and a shift of workers from low productivity sectors to high productivity sector.
Table 3 : Contribution of within sector changes in output per worker and Intersectoral Shifts in change in per capita NSDP (1993-4 to 2011-12)
|
STATES |
Study period |
Agriculture |
Industry |
Service |
Sectoral shift |
Total change in output per worker |
|
Arunachalpradesh |
1994 to 2000 |
-128.2 |
58.6 |
-215.8 |
-187.8 |
-473.3 |
|
2000 to 2005 |
-44.9 |
97.5 |
-22.9 |
-16.1 |
13.6 |
|
|
2005 to 2012 |
42.8 |
25.8 |
70.4 |
15.4 |
154.5 |
|
|
1994to 2012 |
17.8 |
52.0 |
45.5 |
22.7 |
138.0 |
|
|
Assam |
1994 to 2000 |
316.3 |
-426.8 |
-861.8 |
1123.2 |
151 |
|
2000 to 2005 |
-43.2 |
25.8 |
105.7 |
-44.6 |
43.6 |
|
|
2005 to 2012 |
39.2 |
-42.2 |
80.3 |
72.6 |
149.9 |
|
|
1994to 2012 |
16.1 |
-26.9 |
57.3 |
59.1 |
105.6 |
|
|
Manipur |
1994 to 2000 |
-3.4 |
49.9 |
88.0 |
-30.1 |
104.5 |
|
2000 to 2005 |
15.9 |
-79.7 |
9.8 |
79.2 |
25.2 |
|
|
2005 to 2012 |
66.7 |
-159.3 |
111.8 |
140.3 |
159.5 |
|
|
1994to 2012 |
22.9 |
-13.4 |
70.4 |
22.0 |
101.9 |
|
|
Meghalaya |
1994 to 2000 |
38.2 |
41.8 |
76.4 |
-1.7 |
154.7 |
|
2000 to 2005 |
12.7 |
-64.5 |
-18.5 |
109.1 |
38.8 |
|
|
2005 to 2012 |
16.4 |
28.9 |
24.8 |
63.6 |
133.7 |
|
|
1994to 2012 |
20.2 |
17.2 |
33.5 |
52.4 |
123.3 |
|
|
Mizoram* |
1994 to 2000 |
n.a |
n.a |
n.a |
n.a |
n.a |
|
2000 to 2005 |
-51.4 |
54.6 |
111.0 |
-48.3 |
65.9 |
|
|
2005 to 2012 |
26.3 |
-4.3 |
45.2 |
35.5 |
102.8 |
|
|
1994to 2012 |
12.6 |
9.1 |
58.3 |
14.5 |
94.5 |
|
|
Nagaland |
1994 to 2000 |
138.4 |
77.0 |
467.5 |
182.1 |
865.0 |
|
2000 to 2005 |
34.9 |
3.2 |
48.5 |
-5.2 |
81.4 |
|
|
2005 to 2012 |
42.0 |
11.4 |
81.2 |
23.0 |
157.7 |
|
|
1994to 2012 |
26.6 |
4.2 |
53.7 |
1.6 |
86.1 |
|
|
Sikkim |
1994 to 2000 |
-37.6 |
38.1 |
137.2 |
-14.9 |
122.8 |
|
2000 to 2005 |
8.9 |
20.2 |
16.5 |
10.5 |
56.2 |
|
|
2005 to 2012 |
2.4 |
69.4 |
21.0 |
-11.7 |
81.1 |
|
|
1994to 2012 |
0.3 |
57.0 |
27.8 |
-4.7 |
80.4 |
|
|
Tripura |
1994 to 2000 |
28.7 |
49.6 |
50.6 |
-2.6 |
126.3 |
|
2000 to 2005 |
12.0 |
6.0 |
50.4 |
15.5 |
84.0 |
|
|
2005 to 2012 |
19.8 |
33.7 |
49.5 |
3.0 |
106.0 |
|
|
1994to 2012 |
25.1 |
9.0 |
80.5 |
-29.5 |
85.1 |
Source: own computation from census and NSSO data
*Mizoram data is from 1999-2000 to 2011-12
During 1994-2012 growth of productivity in industry dominated in ArunachalPradesh and Sikkim while services dominated in the other six states. In the case of sectoral shifts it was negative in Sikkim and Tripura. It contributed the most in Assam and Meghalaya. If one looks at the period immediately after reforms except for Arunachal Pradesh there had been positive contribution of total change in output per worker, however sector wise it differs from state to state. Here Arunachal Pradesh had shown positive change in output per worker only in industry. In the case of Assam there had been positive change in output per worker only in Agriculture and the industry and service had negative change, but one thing to be noted here is that there had been huge contribution to the output per worker from sectoral shift. Meghalaya and Nagaland had positive contribution from all the sectors contributing to positive change in output per worker. Overall even though the total change in output per worker had been positive for all the states except for Arunachal Pradesh, there had been differences in terms of sectoral contribution. States like Arunachal Pradesh , Manipur and Sikkim which exhibited negative growth in agriculture sector implies many people getting worse off as most of them depend their livelihood from agriculture sector.
In table 3 also the change in total output per worker is positive however there are differences from state to state in sectoral contribution. Arunachal Pradesh, Assam and Mizoram have negative contribution from agriculture which can only mean the productivity has fallen in this sector which will eventually hurt the majority as most of them depend on agriculture for livelihood. Service sector is negative in states like Arunachal Pradesh and Meghalaya, this will hinder the growth of the state. Contribution from the sectoral shift had been negative for the states namely Arunachal Pradesh, Assam, Mizoram and Nagaland. This implies that there had been a decline of workers going from low paying jobs to higher paying jobs, which is the rate at which a worker going from agriculture related work to industry related work had declined.
This table shows all states having positive change in total output per worker and also for agriculture sector and service sector, this phase of 2004-05 to 2011-12 had highest growth rate of GDP all over India which is also reflected here. The contribution to growth had been mostly from the productivity increase per worker. Sectoral shift showed all positive change in productivity except for Sikkim which implied that many existing workers experienced transfer of jobs from low paying to higher pay jobs. Overall this phase showed atleast better productivity relative to others.
As seen in the previous phase there had been positive change in total output per worker, agriculture sector experienced all positive change which is good because many are still dependent on agriculture for livelihood. In industrial sector there had been negative change only in Assam and Manipur. The service sector showed all positive change that is rise in productivity for the interval of time. Sectoral shift were positive for all except for Sikkim and Tripura. Overall as we have seen earlier that there were rise in productivity and most of it came from agriculture, service and sectoral shift.
Table 4 : Sectoral contribution to total employment rate (1993-94 to 2011-12)
|
STATES |
period |
Agriculture |
Industry |
Services |
Total employment rate change |
|
Arunachal Pradesh |
1994 to 2000 |
2.19 |
2.91 |
6.32 |
11.42 |
|
2000 to 2005 |
-0.56 |
-2.52 |
3.05 |
-0.03 |
|
|
2005 to 2012 |
-3.40 |
0.50 |
1.71 |
-1.20 |
|
|
1994 to 2012 |
-0.51 |
1.01 |
11.54 |
12.04 |
|
|
Assam |
1994 to 2000 |
-11.38 |
1.40 |
10.87 |
0.89 |
|
2000 to 2005 |
9.18 |
0.93 |
-8.31 |
1.79 |
|
|
2005 to 2012 |
-10.83 |
5.30 |
3.84 |
-1.69 |
|
|
1994 to 2012 |
-13.03 |
7.63 |
6.39 |
0.99 |
|
|
Manipur |
1994 to 2000 |
7.29 |
-3.99 |
-4.44 |
-1.14 |
|
2000 to 2005 |
-2.71 |
4.81 |
-1.34 |
0.76 |
|
|
2005 to 2012 |
-20.97 |
15.80 |
3.66 |
-1.51 |
|
|
1994 to 2012 |
-16.38 |
16.61 |
-2.12 |
-1.88 |
|
|
Meghalaya |
1994 to 2000 |
-0.05 |
0.09 |
-0.47 |
-0.43 |
|
2000 to 2005 |
-5.54 |
3.84 |
1.78 |
0.08 |
|
|
2005 to 2012 |
-13.13 |
3.46 |
9.86 |
0.19 |
|
|
1994 to 2012 |
-18.72 |
7.39 |
11.17 |
-0.16 |
|
|
Mizoram* |
1994 to 2000 |
-- |
-- |
-- |
-- |
|
2000 to 2005 |
4.12 |
-1.76 |
-1.65 |
0.70 |
|
|
2005 to 2012 |
-9.56 |
5.10 |
5.45 |
0.99 |
|
|
1994 to 2012 |
-5.44 |
3.34 |
3.80 |
1.69 |
|
|
Nagaland |
1994 to 2000 |
4.23 |
-0.81 |
-4.40 |
-0.99 |
|
2000 to 2005 |
2.80 |
1.55 |
-3.55 |
0.80 |
|
|
2005 to 2012 |
-17.09 |
1.07 |
0.95 |
-15.07 |
|
|
1994 to 2012 |
-10.07 |
1.80 |
-7.00 |
-15.26 |
|
|
Sikkim |
1994 to 2000 |
1.02 |
-1.37 |
-2.07 |
-2.44 |
|
2000 to 2005 |
-0.89 |
2.85 |
-0.98 |
0.98 |
|
|
2005 to 2012 |
9.47 |
-0.64 |
-7.58 |
1.26 |
|
|
1994 to 2012 |
9.60 |
0.85 |
-10.65 |
-0.20 |
|
|
Tripura |
1994 to 2000 |
-2.25 |
-3.57 |
7.09 |
1.26 |
|
2000 to 2005 |
-7.79 |
4.32 |
-11.09 |
-14.55 |
|
|
2005 to 2012 |
-6.19 |
28.64 |
-18.64 |
3.81 |
|
|
1994 to 2012 |
-16.24 |
29.39 |
-22.64 |
-9.49 |
Source: NSS rounds, CSO and authors own calculations
Table 4 shows the sectoral contribution to total employment rate change. During 1994-2012 services contributed the most in Arunachal Pradesh, Meghalaya, Mizoram. Industry contributed the most in Assam, Manipur and Tripura. Agriculture contributed the most in Nagaland and Sikkim. The growth of employment rate was positive in Arunachalpradesh, Assam and Mizoram only. Amongst them it was highest in Arunachal Pradesh. The contribution of industry was highest in Tripura. The relative importance of these sectors changed substantially at sub-period analysis indicating a flip-flop behavior in sectoral contribution. During 1994-2000, the immediate period of reforms the change in employment rate was positive in Arunachalpradesh, Assam and Tripura. Agriculture remained the most volatile sector with highest number of negatives. In Meghalaya and Tripura the contribution of agriculture in growth of employment rate was negative throughout. Tripura is interesting because it has been having high unemployment rate throughout . The period 2005 to 2012 Showed Arunachal Pradesh and Tripura with negative growth of employment rate while the rest had positive growth. India’s GDP was highest during these periods and so far the contribution to employment had been minimal and insignificant to the eight states that is shown here. Service sector as like previous year were negative in all the states except for Arunachal Pradesh whereas industry gained momentum in generating employment growth except for Arunachal Pradesh and Mizoram which had negative growth. Agriculture is still a very important sector for many households livelihood as shown in states like Assam, Mizoram, Nagaland. Overall there were not much of growth in employment rate during these periods.
Services contributes the highest in employment rate change in Arunachal Pradesh. The employment growth in service sector was 11.54%. Assam, Meghalaya, Mizoram also had significant contribution of service sector in employment. Industry plays a leading role in Assam, Manipur, Nagaland and Tripura . The highest contribution from industry was for Tripura then Manipur in terms of employment. It is only in Sikkim that agriculture takes the leading role and it is the only state where agriculture makes a positive contribution. There is no state where all three sectors contributed positively. Sikkim ,one of the fastest growing states in India has agriculture contributing the most. Fast growing service sector has not contributed much in employment rate.