Pacific B usiness R eview I nternational

A Refereed Monthly International Journal of Management Indexed With THOMSON REUTERS(ESCI)
|
Dr. Rimpi Saluja Visiting Faculty Depart. of Accountancy and Business Statistics Mohanlal Sukhadia University, Udaipur |
Dr. Ritu Soni Teaching Consultant Depart. of Accountancy and Business Statistics Mohanlal Sukhadia University, Udaipur |
Dr. Shilpa Vardia Assistant Professor Depart. of Accountancy and Business Statistics Mohanlal Sukhadia University, Udaipur |
In last 20 years there has been seen a big transformation in terms of lifestyle, preferences and buying trends among Indian consumers. Consumer buying behavior is influenced by many factors like personal, social, environmental, psychological and technological. Rapid advancement in technology and use of internet has brought a drastic change in consumer buying behavior. More and more consumers are shifting to online shopping due to its various advantages. Present study examines the factors that motivate consumers to decide whether to do online shopping or go for offline shopping. A comparative study is done to find the satisfaction level with experience of consumer buying online and also to analyze the preferences of male and female for online shopping. The research is based on primary data collected through close ended structured questionnaire. Consumers are purposively selected of different age groups includes students, working professionals, housewives and business class people etc.
Keywords: Online Shopping, Offline Shopping, Consumer, Buying Behavior
A buyer’s journey is complex. Consumer buying behavior is influenced by many factors like personal, social, environmental, psychological and technological. Before buying consumers look into various aspects like type of product, its quality, price, availability of substitute, convenience etc. A decade before consumers have fewer options and they were restricted to the place where they lived but now with the development in technology and increasing use of internet has brought a drastic change in the buying behavior of consumers. Now more and more consumers are turning to the World Wide Web for their shopping needs. The consumers can avail variety of goods and services at anytime and anywhere. But with lots of advantages online shopping also has various disadvantages like security of personal data, fraud by sellers etc. that have raised many issues on the potentiality and utility of Online Buying.
Over the last several years, the Indian e-commerce market has seen a dramatic shift. The year 2017 will see large scale growth in the Indian e-commerce sector. ASSOCHAM-Resurgent India reported that in 2016, about 69 million consumers purchased online which is expected to cross 100 million by 2017 with the rise of digital natives, better infrastructure in terms of logistics, broadband and Internet-ready devices to fuel the demand in e-commerce. The report added that by the end of 2018, Indian e-retail is expected to touch $17.52 billion. "The total retail sale is growing at an impressive rate of 15%, registering a double digit growth figure year after year," it said. According to the joint study, Bangalore saw the highest preference for online shopping in 2016, followed by Mumbai and Delhi. The report also laid out challenges for e-commerce in India including absence of e-commerce laws, low entry barriers leading to reduced competitive advantages, rapidly changing business models, urban phenomenon and shortage of manpower and consumer loyalty.
Conceptual Model of Online Shopping
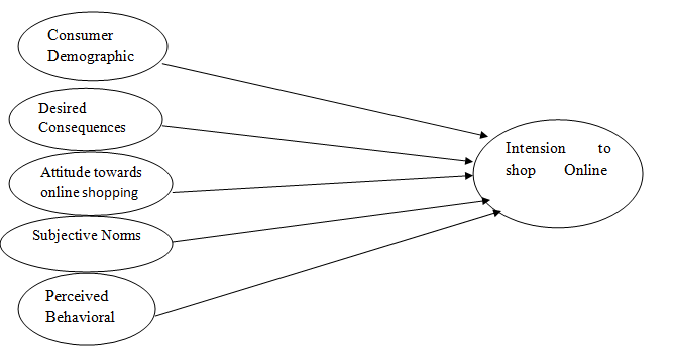
Source: Ajzen (1991) the theory of planned behavior
These are constraints used in this conceptual model. Desired Consequences, attitude, norms and behavior all are independent variable which influences the dependent variable i.e intention for online shopping.
The purpose of this review is to understand the factors which effect buying behavior of consumers. The summary of the previous studies would be helpful to know about reasons for which online shopping is becoming more popular than offline shopping.
Dr. R., C., P.V., & S.A . (2017) in their study tried to recognize that, how consumer measure channels for their purchasing. The objective of their study was to provide an impression of online shopping decision process by comparing the offline and online decision making and identifying the factors that motivate customers to decide whether to do online shopping or go for the offline shopping. The study found that female is more into online shopping than male. The people from the age group 35 and above are less likely to do online shopping because they are less aware of the technology.
Sarkar (2017) found that there is a significant difference between consumer purchase style in online and offline medium which is based on certain parameters. Despite the rapid growth in online sales in India and the projection of further uptick in this medium of shopping, the majority of consumers in India still prefers the so called ‘real’ shopping experience of brick and mortar shops, it’s mostly the youngsters who are fueling the amazing growth story of online shopping in India. Advent of online medium of shopping has no doubt hit the offline stores hard. Large discounts offered by the e-tailers have indeed put enormous pressure on their bottom line.
Chandra & Devendra (2015) analyzed factors affecting on online shopping behavior of consumers that might be one of the most important issues of e-commerce and marketing field. 100 questionnaires were dispersed among the citizen of Bhilai-Durg (Twin City) who were the consumers of Bhilai –Durg and the online shoppers. Regression analysis was used on data in order to test hypothesizes of the study. The findings of their study were that there is strong correlation between age, income and education level with on-line shopping.
Andrian & Sihombing (2014) studied the factors that have influenced consumer purchase intention for online shopping. They examined the relationship between purchase intentions (dependent variable) and identified four independent variables which include utilitarian value, hedonic value, security and privacy. Data collected from 200 college students who have done online shopping at Traveloka.com websites by using non-probability sampling method. The data was analyzed by multiple regressions. This study shows the purchase intention influenced by utilitarian value and security. On other hand, hedonic value and privacy were not the factors that affecting the purchase intention.
Ms. Jain, Ms. Goswami, & Ms. Bhut (2014) studied the impact of Perceived Risk, Perceived enjoyment, Perceived usefulness and Perceived ease of use factors on online opping behavior of consumers in Delhi. The sample of the study comprised of 160 online shoppers from Delhi. Respondents belonged to different age groups, income groups and occupations and have a prior experience in online shopping. A pre – structured questionnaire was used with a 5 point Likert rating scale to measure the factors influencing the respondent’s behavior to shop online. The empirical results revealed that only one factor, namely Perceived Risk significantly affected online shopping behavior of consumers in Delhi while Perceived enjoyment, Perceived ease of use and Perceived enjoyment hinders the consumers to shop online so the researchers suggests that the companies must focus on Perceived risks to develop consumers trust towards online shopping.
Dr.Sharma, Dr.Mehta, & Sharma (2014 ) studied the online buying behavior of consumers in India. They also attempted to get information about the scope of improvement in online shopping website. They analyzed that the Indian consumers are also getting addicted to the online shopping and they do like various features of online shopping as by rest of the world.
Dr.Nagra & Dr.R (2013) used both qualitative and quantitative research methods to study the impact of Demographic factors of consumers on on-line shopping parameters like satisfaction with on-line shopping, future purchase intention, frequency of on-line shopping, numbers of items purchased, and overall spend on on-line shopping. The results of study revealed that on-line shopping in India is significantly affected by various demographic factors like age, gender, marital status, family size and income and proved that the respondents have perceived online shopping in a positive manner.
Dr.Hooda & Mr.Aggarwal (2012 ) examined the key consumer behavior attribute and relation among them with E marketing perspective. They studied the acceptance rate of e-marketing among the Jaipur consumers and its impact on their purchase decision. The result of their study was that people irrespective of age and gender surf internet. However significant difference exists between the age and attributes of online trading but it do not have any relation with the gender. Most of the respondents are hesitant to purchase items over internet because of security concerns.
Research Gap
After the study of above literature it is found that very less work has been done to compare the reasons for which people are motivated towards online shopping and also the factors for which consumer are not attracted to shop online and still feel comfortable to do shopping from stores. Thus in this study the researcher attempted to study the satisfaction level of consumer buying products from offline and online stores.
Objectives
1. To study about the awareness of online shopping among the consumers of Udaipur city.
2. To analyze the factors that promotes consumers for online and offline shopping.
3. To compare the consumers’ expectation level with the satisfaction after online shopping.
4. To study the influential factors of online shopping preferences between male and female consumers.
Hypothesis
1. Consumers’ expectation level does not differ significantly with the satisfaction after online shopping.
2. There is no correlation in the factors influencing online shopping preferences of male & female consumers.
Nature of Study Descriptive
Nature of Data Primary Data
Survey Tool Closed Ended Structured Questionnaire
Measurement scale Likert 5 Point Scale [(1) strongly agree (2) Agree (3) neutral (4) Disagree (5) Strongly Disagree]
Survey Area Udaipur, Rajasthan, India
Method of Sampling Non-probability convenience sampling technique
Data Collected
The data was collected from the consumers of Udaipur city. Initially 350 questionnaires were sent to various consumers and 305 completed questionnaires were received.
1. Demographic Profile of Respondents:
Descriptive statistics are illustrated in Table 1, which indicates demographic wise distribution of respondents. 61.64% respondents are female & rest 38.36% are male. Majority number of consumers belongs to the age group of 20 to 25 years (30.82%) followed by 25 to 30 years (24.26%).
Table 1: Demographic profile of respondents
|
(A) Gender Wise |
|||||
|
Male |
Female |
||||
|
117 (38.36%) |
188 (61.64%) |
||||
|
(B) Age Wise |
|||||
|
Less than 20 year |
20- 25 years |
25-30 years |
30- 35 years |
35 & above |
|
|
23 (7.54%) |
94 (30.82%) |
74 (24.26%) |
62 (20.33%) |
52 (17.05%) |
|
2. Shopping Profile of Respondents:
Table 2 is depicting the shopping profile of respondents. There were 76.72% respondents who said that they prefer online shopping while 23.28% respondents do not prefer online shopping. Respondents were asked that which one is a better mode of shopping and as a response majority of respondents said that online & offline both modes are good.
Further respondents were asked that from when they are availing online shopping and as a result 40% respondents said that they have online shopping experience of 1 to 3 years. 20.33% respondents are shopping online from last 3 to 5 years while 18.03% respondents have online shopping experience of less than 1 year. There were 10.82% respondents who have never shopped online.
Table 2: Shopping profile of respondents
|
(A) Preference of Online Shopping |
||||||
|
Yes
|
No |
|||||
|
234 (76.72%) |
71 (23.28%) |
|||||
|
(B) Experience of Online Shopping |
||||||
|
No Experience |
Less than 1 year |
1-3 years |
3-5 years |
More than 5 years |
||
|
33(10.82%) |
55 (18.03%) |
122 (40%) |
62(20.33%) |
33 (10.82%) |
||
|
(C) Better Mode of Shopping |
||||||
|
Online Shopping |
Offline Shopping |
Both |
||||
|
40 (13.11%) |
88 (28.85%) |
177 (58.03%) |
||||
3. Frequency of Shopping:
Respondents were asked that how often they shopped online and offline and results received are presented in table 3. Majority of respondents (41.97%) shopped online in a month followed by in every 2 months (34.10%) and fortnightly (11.48%). On the other side 32.46% respondents shopped offline once in a month and 20% respondents’ shopped offline once in a week & 10.82% respondents never shopped online.
Table 3: Shopping Frequency of respondents
|
Frequency of Shopping |
Online |
Offline |
||
|
N |
Percentage |
N |
Percentage |
|
|
Everyday |
0 |
0.00 |
31 |
10.16 |
|
Once in a Week |
5 |
1.64 |
61 |
20.00 |
|
Once in a Fortnight |
35 |
11.48 |
59 |
19.34 |
|
Once in a month |
128 |
41.97 |
99 |
32.46 |
|
In every 2 months |
104 |
34.10 |
55 |
18.03 |
|
Not Applicable |
33 |
10.82 |
0 |
0.00 |
|
Total |
305 |
100 |
305 |
100 |
4. Preferred Online Shopping Website
Online shopping respondents were asked about the website they prefer to shop and results received are presented in table 4. According to results the top three online shopping websites are Amazon (86.56%), Flipcart (63.93%) and Snapdeal (33.44%) respectively. ShopClues (7.87%) and bigbasket (6.89%) are least preferred shopping websites.
Table 4: Preferred Online Shopping Website
|
Preferred Online Shopping Website |
N |
Percentage |
|
Amazon |
264 |
86.56 |
|
Snapdeal |
102 |
33.44 |
|
Flipcart |
195 |
63.93 |
|
Homeshop 18 |
24 |
7.87 |
|
Zabong |
42 |
13.77 |
|
Myntra |
77 |
25.25 |
|
ShopClues.com |
24 |
7.87 |
|
Bigbasket |
21 |
6.89 |
|
Other |
13 |
4.26 |
In literature review it has been observed that males & females purchase different products during online shopping, to check this argument the preferred products in online shopping were segregated according to the gender of respondents and results received are presented in table 5.
Preferred Products in Online Shopping
Online shopping respondents were asked about the products they prefer to purchase from the online shopping sites and results are shown in table 5.
Table 5: Preferred Products in Online Shopping
|
Preferred Products in Online Shopping |
Male |
Female |
||
|
N |
Percentage |
N |
Percentage |
|
|
Clothes |
47 |
40.2 |
148 |
78.7 |
|
Electronic Items |
115 |
98.3 |
44 |
23.4 |
|
Books |
51 |
43.6 |
27 |
14.4 |
|
Accessories |
21 |
17.9 |
95 |
50.5 |
|
Holidays Packages |
19 |
16.2 |
5 |
2.7 |
|
Household goods |
19 |
16.2 |
56 |
29.8 |
|
Travel tickets |
71 |
60.7 |
43 |
22.9 |
|
Theatre, cinema tickets |
94 |
80.3 |
78 |
41.5 |
|
Other |
15 |
12.8 |
12 |
6.4 |
On the analysis of above table it is found that male consumers are mostly prefer to buy electronic items (98.3%) and book theatre (80.3%) and cinema tickets where as female consumers prefer clothes (78.7%) and accessories (50.5%).
5. Preferred factors for Online Shopping
Respondents (N=272) were asked to rank the factors affecting their online shopping preference on the scale of 1 to 10. Final ranking is obtained with the help of weighted arithmetic mean as presented in table 6. According to respondents top three factors due to which they prefer online shopping are time saving (Weighted mean=6.92), 24 by 7 availability (Weighted mean=6.88) and variety of products (Weighted mean=6.67). Factors which are not responsible for the online shopping are Finances easily (Weighted mean=2.29) and Low price than store (Weighted mean=2.81)
Table 6: Preferred factors for Online Shopping
|
S. No. |
Weight |
10 |
9 |
8 |
7 |
6 |
5 |
4 |
3 |
2 |
1 |
Total (N) |
Weighted Total |
Weighted Average |
Rank |
|
Rank |
1 |
2 |
3 |
4 |
5 |
6 |
7 |
8 |
9 |
10 |
|||||
|
Reason of Preference |
|||||||||||||||
|
1 |
Time save |
94 |
50 |
44 |
15 |
16 |
9 |
17 |
5 |
17 |
5 |
272 |
2110 |
6.92 |
1 |
|
2 |
24/7 availability |
68 |
83 |
40 |
12 |
11 |
23 |
5 |
11 |
14 |
5 |
272 |
2098 |
6.88 |
2 |
|
3 |
Variety of products |
50 |
54 |
79 |
21 |
15 |
17 |
11 |
9 |
8 |
8 |
272 |
2035 |
6.67 |
3 |
|
4 |
Discounts |
17 |
27 |
20 |
65 |
41 |
39 |
15 |
21 |
13 |
14 |
272 |
1632 |
5.35 |
4 |
|
5 |
Convenience |
21 |
10 |
15 |
35 |
70 |
40 |
29 |
29 |
19 |
4 |
272 |
1530 |
5.02 |
5 |
|
6 |
Comparison shopping |
15 |
3 |
14 |
32 |
42 |
58 |
38 |
41 |
14 |
15 |
272 |
1373 |
4.50 |
6 |
|
7 |
Better Return Policies |
9 |
6 |
15 |
22 |
23 |
35 |
50 |
42 |
36 |
34 |
272 |
1163 |
3.81 |
8 |
|
8 |
Home Delivery |
17 |
21 |
25 |
34 |
7 |
21 |
41 |
56 |
24 |
26 |
272 |
1350 |
4.43 |
7 |
|
9 |
Low price than store |
0 |
14 |
7 |
6 |
15 |
16 |
33 |
35 |
81 |
65 |
272 |
858 |
2.81 |
9 |
|
10 |
Finances easily |
6 |
5 |
5 |
8 |
13 |
7 |
9 |
45 |
39 |
135 |
272 |
698 |
2.29 |
10 |
6. Consumers’ Satisfaction with Online Shopping
Respondents were asked to indicate their level of satisfaction towards various factors of online shopping on 5 point scale from 1 to 5 (5 denotes the highly satisfied, whereas, 1 is the highly dissatisfied). Final result is obtained with the help of mean.
The score among 1.00-1.80 means Highly Dissatisfied
The score among 1.81-2.60 means Dissatisfied
The score among 2.61-3.40 means Neutral
The score among 3.41-4.20 means Satisfied
The score among 4.21-5.00 means Highly Satisfied
The final scores for various factors are presented in table 7
Table 7: Consumers’ Satisfaction with Online Shopping
|
Parameter |
Mean Score |
Level of Satisfaction |
|
Time save |
4.20 |
Satisfied |
|
Low Price |
3.36 |
Neutral |
|
Variety of Products |
4.13 |
Satisfied |
|
Discounts |
3.66 |
Satisfied |
|
Convenience |
3.88 |
Satisfied |
|
Comparison shopping |
3.88 |
Satisfied |
|
Consumer Review |
3.65 |
Satisfied |
|
Service Quality of sellers |
3.06 |
Neutral |
|
Difference in expected & Real |
3.51 |
Satisfied |
|
Product |
3.20 |
Neutral |
|
Complain Redressal |
3.39 |
Neutral |
7. Limitations of Online Shopping
Respondents ranked the limitations of online shopping from 1 to 6 and final ranking was obtained with the help of weighted arithmetic mean. According to results presented in table 8 the biggest limitation of online shopping is no tangibility (Weighted mean=3.66) followed by lack of trust (Weighted mean=3.62) and no trail ability (Weighted mean=3.47) ranked 2nd & 3rd respectively.
Table 8: Limitations of Online Shopping
|
S. No. |
Weight |
6 |
5 |
4 |
3 |
2 |
1 |
Total (N) |
Weighted Total |
Weighted Average |
Rank |
|
Rank |
1 |
2 |
3 |
4 |
5 |
6 |
|||||
|
Limitations of Online Shopping |
|||||||||||
|
1 |
No tangibility |
95 |
36 |
38 |
39 |
33 |
31 |
272 |
1116 |
3.66 |
1 |
|
2 |
No trail ability |
50 |
83 |
31 |
38 |
34 |
36 |
272 |
1057 |
3.47 |
3 |
|
3 |
Lack of trust |
54 |
51 |
85 |
39 |
25 |
18 |
272 |
1104 |
3.62 |
2 |
|
4 |
Delay in Delivery |
23 |
44 |
32 |
78 |
48 |
47 |
272 |
863 |
2.83 |
5 |
|
5 |
No interaction with seller |
37 |
32 |
72 |
40 |
71 |
20 |
272 |
952 |
3.12 |
4 |
|
6 |
Fraud |
28 |
32 |
20 |
34 |
58 |
100 |
272 |
726 |
2.38 |
6 |
8. Reasons behind the preference of Offline Shopping
Respondents were asked to rank the factors affecting their offline shopping preference on the scale of 1 to 6. Final ranking is obtained with the help of weighted arithmetic mean as presented in table 9. According to respondents top three factors due to which they prefer offline shopping are Touch & Check product (Weighted mean=5.03), On spot Delivery (Weighted mean=4.65) and Better after sale service (Weighted mean=3.44).
Table 9: Reasons behind the preference of Offline Shopping
|
S. No. |
Weight |
6 |
5 |
4 |
3 |
2 |
1 |
Total (N) |
Weighted Total |
Weighted Average |
Rank |
|
Rank |
1 |
2 |
3 |
4 |
5 |
6 |
|||||
|
Reasons for Preference of Offline Shopping |
|||||||||||
|
1 |
On spot Delivery |
107 |
97 |
50 |
13 |
15 |
23 |
305 |
1419 |
4.65 |
2 |
|
2 |
Touch & Check product |
127 |
124 |
22 |
9 |
14 |
9 |
305 |
1534 |
5.03 |
1 |
|
3 |
Better after sale service |
18 |
36 |
92 |
95 |
43 |
21 |
305 |
1048 |
3.44 |
3 |
|
4 |
In store discounts |
9 |
20 |
62 |
75 |
88 |
51 |
305 |
854 |
2.80 |
5 |
|
5 |
Better Return Policies |
6 |
13 |
26 |
59 |
112 |
89 |
305 |
695 |
2.28 |
6 |
|
6 |
Instant gratification |
30 |
29 |
45 |
38 |
77 |
86 |
305 |
859 |
2.82 |
4 |
9. Hypothesis Testing
H01 Consumers’ expectation level does not differ significantly with the satisfaction after online shopping.
To measure the impact of online shopping experience on consumers’ satisfaction ANOVA is applied as shown in table 10.
Table 10: ANOVA test results to measure impact of online shopping experience on consumers’ satisfaction
|
Time save |
Source of Variation |
Sum of Squares |
Degree of Freedom |
Mean Sum of Squares |
F-Ratio |
Result |
|
Between Samples |
4.711 |
3 |
1.570 |
2.726 |
Significant |
|
|
Within Samples |
154.359 |
268 |
0.576 |
|||
|
Total |
159.07 |
271 |
||||
|
Low Price |
Source of Variation |
Sum of Squares |
Degree of Freedom |
Mean Sum of Squares |
F-Ratio |
Result |
|
Between Samples |
5.26 |
3 |
1.753 |
2.863 |
Significant |
|
|
Within Samples |
164.12 |
268 |
0.612 |
|||
|
Total |
208.724 |
271 |
||||
|
Variety of Products |
Source of Variation |
Sum of Squares |
Degree of Freedom |
Mean Sum of Squares |
F-Ratio |
Result |
|
Between Samples |
2.308 |
3 |
0.769 |
1.284 |
Not Significant |
|
|
Within Samples |
160.618 |
268 |
0.599 |
|||
|
Total |
162.925 |
271 |
||||
|
Discounts |
Source of Variation |
Sum of Squares |
Degree of Freedom |
Mean Sum of Squares |
F-Ratio |
Result |
|
Between Samples |
10.59 |
3 |
3.530 |
4.535 |
Significant |
|
|
Within Samples |
208.598 |
268 |
0.778 |
|||
|
Total |
219.189 |
271 |
||||
|
Convenience |
Source of Variation |
Sum of Squares |
Degree of Freedom |
Mean Sum of Squares |
F-Ratio |
Result |
|
Between Samples |
11.83 |
3 |
3.943 |
4.622 |
Significant |
|
|
Within Samples |
228.636 |
268 |
0.853 |
|||
|
Total |
233.467 |
271 |
||||
|
Comparison shopping |
Source of Variation |
Sum of Squares |
Degree of Freedom |
Mean Sum of Squares |
F-Ratio |
Result |
|
Between Samples |
1.968 |
3 |
0.656 |
0.900 |
Not Significant |
|
|
Within Samples |
195.445 |
268 |
0.729 |
|||
|
Total |
197.413 |
271 |
||||
|
Consumer Review |
Source of Variation |
Sum of Squares |
Degree of Freedom |
Mean Sum of Squares |
F-Ratio |
Result |
|
Between Samples |
2.679 |
3 |
0.893 |
1.068 |
Not Significant |
|
|
Within Samples |
224 |
268 |
0.836 |
|||
|
Total |
226.679 |
271 |
||||
|
Service Quality of sellers |
Source of Variation |
Sum of Squares |
Degree of Freedom |
Mean Sum of Squares |
F-Ratio |
Result |
|
Between Samples |
14.994 |
3 |
4.998 |
3.856 |
Significant |
|
|
Within Samples |
347.327 |
268 |
1.296 |
|||
|
Total |
362.321 |
271 |
||||
|
Difference in expected & Real |
Source of Variation |
Sum of Squares |
Degree of Freedom |
Mean Sum of Squares |
F-Ratio |
Result |
|
Between Samples |
10.26 |
3 |
3.420 |
3.144 |
Significant |
|
|
Within Samples |
291.533 |
268 |
1.088 |
|||
|
Total |
299.496 |
271 |
||||
|
Product |
Source of Variation |
Sum of Squares |
Degree of Freedom |
Mean Sum of Squares |
F-Ratio |
Result |
|
Between Samples |
11.253 |
3 |
3.751 |
3.033 |
Significant |
|
|
Within Samples |
331.498 |
268 |
1.237 |
|||
|
Total |
341.398 |
271 |
||||
|
Complain Redressal |
Source of Variation |
Sum of Squares |
Degree of Freedom |
Mean Sum of Squares |
F-Ratio |
Result |
|
Between Samples |
9.856 |
3 |
3.285 |
2.817 |
Significant |
|
|
Within Samples |
312.56 |
268 |
1.166 |
|||
|
Total |
322.416 |
271 |
Level of Significance = 5%, Tabulated Value = 2.70
1. At 5% level of significance majority of F-statistic values are significant which provides enough evidence to reject the null Hypothesis. So it can be inferred that Consumers’ expectation level significantly differ with the satisfaction after online shopping.
H02 There is no correlation in the factors influencing online shopping preferences of male & female consumers.
To measure the correlation in the factors influencing online shopping preferences of male & female consumers’ spearman’s rank correlation is applied and results are presented in table 11.
Table 11: Correlation in the factors influencing online shopping preferences of male & female consumers
|
Reason of Preference |
Ranking |
|
|
Male |
Female |
|
|
Time save |
1 |
1 |
|
24/7 availability |
3 |
2 |
|
Variety of products |
2 |
4 |
|
Discounts |
4 |
3 |
|
Convenience |
5 |
5 |
|
Comparison shopping |
7 |
8 |
|
Better Return Policies |
8 |
7 |
|
Home Delivery |
6 |
6 |
|
Low price than store |
9 |
9 |
|
Finances easily |
10 |
10 |
|
Coefficient of Correlation |
+0.95 |
|
|
Result |
High degree of Positive Correlation |
|
High degree of positive correlation (+0.95) is observed in the factors influencing online shopping preferences of male & female consumers which leads to the rejection of hypothesis so it can be concluded that there is a correlation in the factors influencing online shopping preferences of male & female consumers.
The present study analyzed the buying behavior of consumers and also factors which motivate consumers to buy offline or online. After analysis of the above study the researchers found that female respondents are more attracted towards online shopping than male. It was also found that female mostly shop of clothing and accessories whereas male respondents shop more of electronic items. The researchers found that most respondents do online shopping because it save their time and also they get variety of products on these stores but sometimes due to delay in delivery and fraud by sellers they prefer to buy from offline stores where they can touch and check the product and have instant gratification after shopping. ANOVA test also proved that consumers’ satisfaction with online shopping differs with respect to the experience of online shopping. High degree of positive correlation is found in the factors influencing online shopping preferences of male and female consumers.
· (n.d.). Retrieved from http://www.assocham.org/newsdetail.php?id=6130
· A, H. ,., S.Franklin, J., & S., S. (2014). A Study on factors influencing consumer buying behavior in cosmetic Products. International Journal of Scientific and Research Publications , 4 (9), 1-6.
· Ajzen, I. (1991). The theory of planned behavior. Organisational Behavior and Human Decision Process , 50 , 179-211.
· Dr. Hooda, S., & Mr. Aggarwal, S. (2012). CONSUMER BEHAVIOUR TOWARDS E-MARKETING: A STUDY OF JAIPUR CONSUMERS. Journal of Arts, Science & Commerce , 3 (2), 107-118.
· Dr. Nagra, G., & Dr.Gopal, R. (2013). An study of Factors Affecting on Online Shopping Behavior of Consumers. International Journal of Scientific and Research Publications , 3 (6), 1-4.
· Dr. Upadhyay, P., & Kaur, J. Analysis of Online Shopping Behavior of Customer in Kota City. International Journal in Multidisciplinary and Academic Research , 2 (1).
· Dr.Sharma, R., Dr. Mehta, K., & Sharma, S. (2014). Understanding Online Shopping Behaviour of Indian Shoppers. IJMBS, ISSue 3, Spl- , 4 (3), 9-18.
· Dr.Sivanesan, R., C, M., P.V., B., & S.A., A. (2017). Comparative Study on Factors Influencing Online and Offline Shopping. International Journal of Research in Management & Business Studies , 4 (3), 26-34.
· Jain, D., Goswami, S., & Bhutani, S. (2014). Consumer Behavior towards Online Shopping: An Empirical Study from Delhi. IOSR Journal of Business and Management , 16 (9), 65-72.
· Lestari, A., & Sihombing, S. O. (2015). FACTORS INFLUENCING PURCHASE INTENTION IN ONLINE SHOPPING. Conference on Management and Behavioral Studies (CMBS).
· Saad, A., & Paul, J. T. (n.d.). Consumers’ attitude towards online shopping: Factors influencing employees of crazy domains to shop online. Journal of Management and Marketing Research , 1-6.
· Sajjad, N., Arsalan, T., Aziz, S., Haroon, R. u., & Irum, J. (2012). How Online Shopping Is Affecting Consumers Buying Behavior in Pakistan? International Journal of Computer Science Issues , 9 (3), 486-495.
· Sarkar, R., & Dr. Das, S. (2017). Online Shopping vs Offline Shopping : A Comparative Study. International Journal of Scientific Research in Science and Technology , 3 (1), 424-431.
· Sinha, A. K., & Chandra, D. K. (2013). FACTORS AFFECTING THE ONLINE SHOPPING BEHAVIOUR: A STUDY WITH REFERENCE TO BHILAI DURG. International Journal of Advanced Research in Management and Social Sciences , 2 (5), 160-177.