Pacific B usiness R eview I nternational

A Refereed Monthly International Journal of Management Indexed With THOMSON REUTERS(ESCI)
|
Mohammad Delavari Department of Business management Science and Research Branch Islamic Azad University Tehran, Iran |
Ali Badizadeh Assistant Professor Faculty of Management and Accounting Qazvin Branch, Islamic Azad University Qazvin, Iran |
Due to the increased popularity of social media for sharing information and increasing communication, organizations have started to think about the employment of these communication tools at their workplace for various purposes. In this regard, this study tended to determine the effect of social media use at work on employee performance, considering the mediating role of trust, shared vision, network ties and knowledge transfer in Irancell Services Center. Hypotheses evaluated the effect of social media use at work on three dimensions of social capital (shared vision development, trust and network links), knowledge transfer, and eventually employee performance. The studied population consisted of all managers, experts and employees of Irancell Telecommunications Service Co; 300 samples were randomly selected and measured. The instrument used for collecting data was a 37-question standard questionnaire. Validity was measured by C.V.R content validity and Cronbach's alpha was used to measure reliability. To test hypotheses, structural equation modeling was done by Amos 23 software. The results showed that social media had a positive effect on shared vision (44%), network ties (30%) and trust (73%); shared vision of employees had a positive effect on knowledge transfer (22%). Moreover, trust had a positive effect on knowledge transfer (34%); however, network ties had no positive effect on knowledge transfer. Finally, shared vision, network ties and knowledge transfer had no positive effect on employee performance, while trust had a positive effect on employee performance (26%).
Keywords : Social Media, Social Capital, Employee Performance, Knowledge Transfer, Trust, Network Ties, Shared Vision, Irancell Telecommunications Service Co.
Communication through social media has revolutionized the lives of all people worldwide (Chang & Hsiao, 2014). Many studies have been conducted on social media usage such as blog usage, membership in virtual forums, activities in virtual social networks, interactive software usage, etc., in order to compete in the market and increase the interaction with potential and actual customers (Kaplan & Haenlein, 2010). Some of these media have become platforms with more than 30000 users and 25000 links to product or service lovers (Dimicco et al., 2010). This has even led some large organizations use intranet networks to form internal social networks through which they disseminate information and share knowledge in this field.
In this regard, influence and constant presence of social media, even in organizations and workplaces, has facilitated organizational communication and knowledge work which was impossible in the past (McAfee, 2006). Some managers believe that social media usage is considered in large organizations to improve communication between different departments.
Social media has gained popularity throughout the world over the last few years. The introduction of social media enables organizations to use new communication tools to communicate with their colleagues and clients. However, the understanding of social media usage is very limited and corporate executives are not aware of their advantages and disadvantages. The results of studies show that social networks are so widely used in current web that various organizations tend to exploit them, because social capital formed in social networks is the best tool for group and general activities of organizations. Therefore, organizations need to examine the effects of social media use at work by employees on their performance and examine the mediator variables in this relationship. Thus, this study tends to determine the effect of social media use at work on employee performance considering the mediating role of trust, shared vision, network ties and knowledge transfer in the Irancell Telecommunications Service Co.
Social media use at work by employees and its effects on performance has been discussed by some researchers in recent years; the results of these discussions in both groups suggest a positive effect of social media on work performance and negative effects of social media use at work and waste of time and money. The innovative approach of this study is to determine the effect social media use at work, considering the mediating role of three dimensions of social capital (shared vision, network ties and trust), and their role in transferring knowledge by employees when using social media and effect on their work performance; this model has not been addressed so far in the studies conducted in Iran.
The conceptual model, derived from the relationships between variables (Cao et al., 2016), is shown in Figure 1:
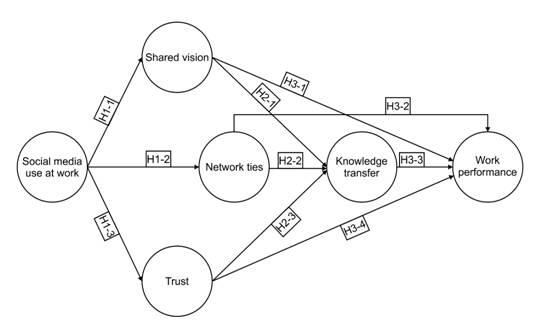
Figure 1: The conceptual model (Cao et al, 2016)
Social media (social networks)
Social media is the application of web-based mobile technologies to transform communication into a two-way dialogue. Social media are media for social interaction using highly accessible and scalable communication techniques. The term ‘social media’ was used steadily for the first time in July 2006. Chris Shipley [1] is often known as the first person to use the term social media. Shipley believes that social media guides future events for dialogue; events which are discussed through blogging, wikis, social networking, and technologies related to participatory media forums (Oftadeh, 2012).
Work performance
Socially, the best desire of organizations is to have employees who do their job well. Good performance increases productivity of the organization, and this directly improves the national economy as well as services of the organization. Previously, work performance was discussed from the perspective of different theories, focusing on motivations rather than abilities. This section will identify other effective factors on performance. Both environmental factors and personal factors have an important effect on performance. Personality traits, such as big five, and locus of control are correlated with work performance. Important environmental factors include occupational characteristics, reward systems and technology. Organizational barriers are also one of the characteristics of the workplace, which can interfere with good performance. These conditions will reduce job satisfaction and lead to turnover (Ghazanfari & Abedi, 2012).
Social capital theory
Along with human, financial and economic capital, another capital called ‘social capital’ is considered in organizations and societies. This is a modern concept in sociology, which is closely linked to human capital as the most important resource of organizations. Social capital provides a very suitable platform for exploitation and productivity of human resources in different organizations. On the other hand, exploitation of other organizational capital is also possible in the light of this capital, and this highlights social capital in the organization (Alvani & Shirvani, 2004).
Knowledge transfer
Knowledge transfer represents the ways in which knowledge is provided to members of the organization. In general, organizations can adopt different processes to build their basic knowledge (Rezaie et al., 2009; Gholami et al., 2013). However, organizational knowledge is presented in different situations and involves various processes (Noruzy et al., 2013). Members of the organization deal with sets of techniques. If they are required to learn a particular way of working, the delay in consolidation of this new knowledge is natural and necessary. Therefore, an organization can establish similar standardized standards or use similar patterns to provide data, information, and knowledge and convert this knowledge to new product, organisational performance based on customer satisfaction (Nazari-Shirkouhi et al., 2013; Nazari-Shirkouhi and Keramati, 2017).
This was an applied research using descriptive survey method.
Population, Sample and Sampling
This study used non-random convenient sampling in which samples are selected due to ease, simplicity and availability. Therefore, the selected subjects (volunteers) will be almost a biased sample of the population. In this study, samples were recruited from 291 available people including managers, experts and employees of the Irancell Telecommunications Service Co.
The sample size was calculated by Cochran’s formula, as follows:
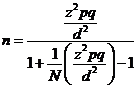 .........(1)
Where, N is population size, n is sample size, Z=1.96, q=0.5, p=0.5, and d=0.05.
Based on the inquiry of the company, the population size was 1200; thus, the sample size was estimated at 291 using the above formula. However, 300 questionnaires were distributed for more confidence.
This study used structural equations to test hypotheses. According to sample adequacy rule, the samples must be 5-15 times more than items of the variables (Houman, 2014). Since the questionnaire contained 31 items for 6 variables, the sample size should range from 155 to 465. Thus, the calculated sample size (300) well meets the sample adequacy rule.
Data Collection Instruments
Archival reviews were used to collect data for literature and theoretical background. Archival data was collected by reviewing textbooks, scientific journals and published articles on this subject, previous dissertations submitted by valid universities and scientific centers as well as internet. Since this was a survey, data was collected by a standard questionnaire derived from Cao et al (2016) and other studies, as shown in Table 1:
Table 1: references used to develop the questionnaire
|
Variable |
Reference |
|
social media use at work |
Cao et al. (2016), cited by Kanannali et al. (2005) |
|
Shared vision |
Cao et al. (2016), cited by Chiu et al. (2006) |
|
Trust |
Cao et al. (2016), cited by Levin and Cross (2004) |
|
Network ties |
Cao et al. (2016), cited by Tsai and Ghoshal (1998) |
|
Knowledge transfer |
Cao et al. (2016), cited by Dhanaraj et al. (2004) |
|
Work performance |
Cao et al. (2016), cited by Kuvaas (2006) |
Validity of Questionnaire
Validity of the questionnaire was measured by formal and content validity; because the questionnaire was standard, structural validity was ensured. However, formal and content validity were measured in terms of relevance of questions to the studied subject and concepts. Therefore, the questions, which were derived from the standard references listed in Table 1, were first designed and then presented to a number of academic experts, as well as managers and experts of the organization studied. According to these experts, the questionnaire needed modifications; the changes needed to modify this questionnaire were simplifying the statements, matching the content of questions with the organization, dividing the two-concept questions into questions with separate concepts, clarifying intention of the questions about work performance; the modifications were confirmed by the professors and experts. Finally, the modified questionnaire included 37 questions. Its formal validity was also confirmed.
Reliability of Questionnaire
Cronbach’s alpha was used to measure reliability, because it is more common to use Cronbach’s alpha in surveys; moreover, it is the simplest and most interpretative technique to measure reliability (Chehrehpak et al., 2018). Moreover, it measures internal consistency that is the extent to which all components in a test represent an identical concept and represent the internal relationship of these components. Therefore, it is more reliable than other techniques such as test-retest.
In order to calculate the Cronbach's alpha, the variance of the scores for each subset of questions (or subtest) and the total variance were calculated. Then, the alpha was calculated using the formula below:
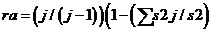 ......... (2)
Where, ra denotes reliability, j is the number of subtests, s2j is variance of the j-th subtest, s2 is total variance of the test.
To determine reliability of the questionnaire, it was distributed among 30 respondents; then, Cronbach’s alpha was calculated by SPSS. Table 2 shows output of this processing:
Table 2: Cronbach's Alpha of the Questionnaire
|
Result |
Standard 𝛂 |
Total 𝛂 |
No. of questionnaires |
|
Reliability is confirmed |
>0.7 |
0.884 |
30 |
The calculated Cronbach’s alpha indicated that the questions had a relatively good correlation; it can be claimed that if the considered trait is measured again using this questionnaire and the same respondents (generally under similar conditions), there will not be a significant difference in the responses. Table 3 lists the Cronbach’s alphas calculated for each variable:
Table 3: Cronbach’s alpha of variables
|
Variable |
𝛂 |
Standard 𝛂 |
Result |
|
Social media use at work |
0.832 |
>0.7 |
Confirmed |
|
Shared vision |
0.708 |
>0.7 |
Confirmed |
|
Trust |
0.708 |
>0.7 |
Confirmed |
|
Network ties |
0.706 |
>0.7 |
Confirmed |
|
Knowledge transfer |
0.835 |
>0.7 |
Confirmed |
|
Work performance |
0.852 |
>0.7 |
Confirmed |
Table 4 shows the number of questions and scales of the questionnaire:
Table 4: variables, number of order of questions in the questionnaire
|
Variable |
Type of variable |
No. of questions |
Question No. |
Values of criteria |
Scale |
|
Demographics |
Demographic |
6 |
6-1 |
Prioritization |
Nominal |
|
Social media use at work |
Independent |
6 |
12-7 |
1, 2, 3, 4, 5 |
Ordinal |
|
Shared vision |
Mediator |
3 |
15-13 |
1, 2, 3, 4, 5 |
Ordinal |
|
Trust |
Mediator |
5 |
20-16 |
1, 2, 3, 4, 5 |
Ordinal |
|
Network ties |
Mediator |
4 |
24-21 |
1, 2, 3, 4, 5 |
Ordinal |
|
Knowledge transfer |
Mediator |
7 |
31-25 |
1, 2, 3, 4, 5 |
Ordinal |
|
Work performance |
Dependent |
6 |
37-32 |
1, 2, 3, 4, 5 |
Ordinal |
Data Analysis
To measure and analyse the obtained data, descriptive statistics were first used for obtaining means and standard deviations in each question and frequency distribution of the responses given to each question and the column diagram on the five-point Likert scale by SPSS. To test the hypotheses, structural equation modelling was used by the Amos software. One of the strongest and most suitable methods of analysis in management sciences is multivariate analysis. Because the nature of these topics is multivariate and cannot be solved by a bivariate technique (in which only one independent variable and one dependent variable are considered). In this study, there were several independent variables of which effect was examined on the dependent variable; thus, it was essential to use structural equation model.
Descriptive Statistics
The first step in data analysis is description of traits of the subjects and familiarity with changes in key variables in the studied sample. The purpose of descriptive analysis is to study respondents in terms of variables such as education, gender, etc., in order to draw valid conclusions by knowing the status of these factors. In the descriptive analysis, demographic variables and key variables were described as follows:
Descriptive analysis of demographic variables
Majority of the samples was male (71.7%). Majority of the samples (61%) were 31-40 years old. Majority of the samples (57.7%) were undergraduate. Majority of the samples (73.3%) had 6-10 years of experience. Majority of the samples (82.7%) were members of social networks for more than two years. Majority of the samples (49%) spent 1-3 hours per day in social networks.
Descriptive analysis of key variables
As descriptive analysis of variables showed, all 300 samples responded to 31 questions related to variables and no question was left unanswered. Next, minimum and maximum of responses show that all choices ranging from ‘strongly disagree’ to ‘strongly agree’ were marked in majority of questions; in some questions (26, 27, 29, 30), however, none of the respondents marked ‘strongly agree’. Therefore, most of the responses were ‘agree’.
Correlation test of latent variables
Correlation test is usually done to ensure that there is no colinearity between several variables and prevent the creation of additional information in the structural equation. This repeat of information reduces predictability of each independent variable. Pairwise correlation coefficients of latent variables should be less than 0.9 to prevent this colinearity. Table 5 shows the results of correlation coefficients between the variables:
Table 5: coefficients of correlation between variables
|
Latent variables |
1 |
2 |
3 |
4 |
5 |
6 |
|
|
1 |
Social media use at work |
- |
|||||
|
2 |
Shared vision |
0.406 |
- |
||||
|
3 |
Trust |
0.705 |
0.525 |
- |
|||
|
4 |
Network ties |
0.234 |
0.598 |
0.616 |
- |
||
|
5 |
Knowledge transfer |
0.357 |
0.389 |
0.320 |
0.465 |
- |
|
|
6 |
Work performance |
0.190 |
0.23 |
0.234 |
0.293 |
0.346 |
- |
As shown in above table, as all pairwise correlation coefficients were lower than 0.9, there was not a high colinearity and correlation was reasonable. Therefore, the data was worthy of examination.
Normality Test
In order to perform structural equations modelling parametrically, it is assumed that data and variables are normal. Kolmogorff-Smirnov test and skewness-kurtosis test were used to measure normality of data. Table 6 lists the results of Kolmogorov-Smirnov test. Table 7 also shows the results of skewness-kurtosis test:
Table 6: K-S test results to determine normality of variables
|
Variable |
Sig. |
Result |
|
Social media use at work |
0.411 |
Normal |
|
Shared vision |
0.089 |
Normal |
|
Trust |
0.112 |
Normal |
|
Network ties |
0.301 |
Normal |
|
Knowledge transfer |
0.512 |
Normal |
|
Work performance |
0.069 |
normal |
Table 7: skewness-kurtosis test results
|
Question |
Skewness |
Kurtosis |
Question |
Skewness |
Kurtosis |
|
1 |
.072 |
-.059 |
17 |
.679 |
.907 |
|
2 |
.166 |
-.347 |
18 |
.359 |
-.269 |
|
3 |
-.180 |
-.612 |
19 |
.168 |
-.380 |
|
4 |
-.204 |
-.325 |
20 |
.175 |
-.085 |
|
5 |
-.426 |
.122 |
21 |
.163 |
-.097 |
|
6 |
-.331 |
-.681 |
22 |
-.027 |
-.439 |
|
7 |
.331 |
-.316 |
23 |
.082 |
-.497 |
|
8 |
.193 |
-.578 |
24 |
.050 |
-.304 |
|
9 |
-.056 |
-.489 |
25 |
-.076 |
-.492 |
|
10 |
.190 |
-.208 |
26 |
.235 |
-.239 |
|
11 |
.184 |
-.581 |
27 |
.087 |
-.386 |
|
12 |
-.017 |
-.589 |
28 |
.137 |
-.075 |
|
13 |
.026 |
-.533 |
29 |
.232 |
-.269 |
|
14 |
.170 |
-.410 |
30 |
.329 |
-.353 |
|
15 |
.252 |
-.153 |
31 |
.268 |
-.003 |
|
16 |
-.454 |
-.196 |
Structural Model
Overall output of the software for the entire structural model, taking into account all endogenous and exogenous variables, is presented in Figure 2. In this output, factor loads are given for each paths defined in the structural model.
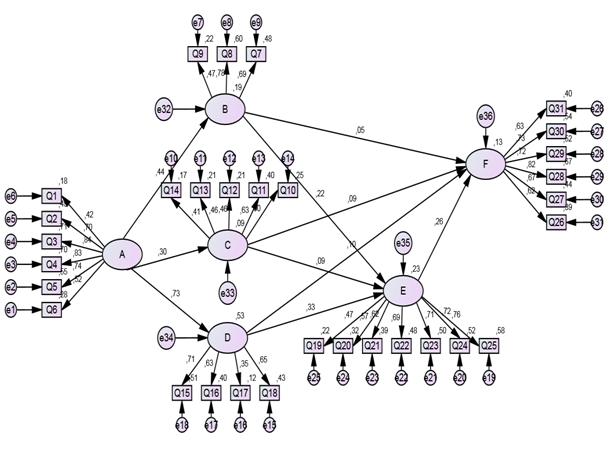
Figure 2: overall output of the structural model
Figure 1 shows output of the software for path coefficients between endogenous and exogenous latent variables; the relationships between these variables were defined based on hypotheses. In this figure, square-shaped variables are the observed variables or the same questions of each variable. Accordingly, output 1 shows questions 1 to 31. Moreover, circular variables are latent variables of the structural model. The numbers on the arrows (related to the relationship between two latent variables based on hypotheses) are the path coefficients calculated for hypotheses. This figure also shows allowable error for each observed variable, calculated by the software for these variables; its values are given in the numerical output in the statistical appendix of this method (structural equations) at the end of the study.
Model evaluation by fit indices
Absolute fit indices : Table 8 calculates absolute fit indices.
Table 8: calculations of absolute fit indices
|
Index |
Abbr. |
Benchmark |
Calculated value |
Result |
|
Chi-Square |
CMIN |
Less than three times the degree of freedom |
Df=724, X2=1536.69 |
Confirmed |
|
Goodness-of-Fit Index |
GFI |
>0.9 |
0.955 |
Confirmed |
|
Adjusted Goodness-of-Fit Index |
AGFI |
>0.9 |
0.914 |
Confirmed |
|
Root Mean Squared Residual |
RMR |
The closer to zero the better |
0.075 |
Confirmed |
According to above table, all absolute fit indices of the developed structural model were acceptable; thus, the structural model was fitted.
Adaptive fit indices : adaptive fit indices often show how well the model has been able to deviate from an independence model. The more this deviation is, the better the model is. Table 9 calculates adaptive fit indices:
Table 9: calculations of adaptive fit indices
|
Index |
Abbr. |
Benchmark |
Calculated value |
Result |
|
Normed Fit Index |
NFI |
>0.9 |
0.942 |
Confirmed |
|
Comparative Fit Index |
CFI |
>0.9 |
0.910 |
Confirmed |
|
Relative Fit Index |
RFI |
>0.9 |
0.908 |
Confirmed |
|
Incremental Fit Index |
IFI |
>0.9 |
0.913 |
Confirmed |
As shown in Table 9, all adaptive fit indices of the developed structural model were acceptable; thus, the structural model was fitted.
Parsimony fit indices : Table 10 calculates parsimony fit indices.
Table 10: calculations of parsimony fit indices
|
Index |
Abbr. |
Benchmark |
Calculated value |
Result |
|
Parsimonious Normed Fit Index |
PNFI |
0.5<x<0.6 |
0.586 |
Confirmed |
|
parsimonious Goodness-of-Fit Index |
PGFI |
>0.6 |
0.647 |
Confirmed |
|
Root Mean Squared Error of Approximation |
RMSEA |
The closer to zero the better, the best is below 0.05 |
0.054 |
Confirmed |
As shown in Table 10, all parsimony fit indices of the developed structural model were acceptable; thus, the structural model was fitted.
Hypothesis Testing
Table 11 shows results of hypothesis testing:
H1-1: social media usage is effective on shared vision of employees.
H1-2: social media usage is effective on network ties between employees.
H1-3: social media usage is effective on trust between employees.
H2-1: shared vision is effective on knowledge transfer between employees.
H2-2: network ties isn’t effective on knowledge transfer between employees.
H2-3: trust is effective on knowledge transfer between employees.
H3-1: shared vision isn’t effective on work performance of employees.
H3-2: network ties isn’t effective on work performance of employees.
H3-3: knowledge transfer isn’t effective on work performance of employees.
H3-4: trust is effective on work performance of employees.
Table 11: results of hypothesis testing
|
Hypothesis |
C.R value |
β |
Sig. |
Result |
|
H1-1 |
5.697 |
0.439 |
0.000 |
Confirmed |
|
H1-2 |
3.701 |
0.295 |
0.000 |
Confirmed |
|
H1-3 |
8.678 |
0.729 |
0.000 |
Confirmed |
|
H2-1 |
2.863 |
0.218 |
0.004 |
Confirmed |
|
H2-2 |
1.139 |
0.086 |
0.255 |
Rejected |
|
H2-3 |
4.136 |
0.334 |
0.000 |
Confirmed |
|
H3-1 |
0.597 |
0.045 |
0.562 |
Rejected |
|
H3-2 |
1.105 |
0.086 |
0.269 |
Rejected |
|
H3-3 |
1.262 |
0.104 |
0.207 |
Rejected |
|
H3-4 |
3.294 |
0.259 |
0.000 |
Confirmed |
Limitations
This study suffered from some limitations, which are explained below.
Initially, one of the most important scientific limitations of the present study was that the study was a cross-sectional research project; since the cross-sectional research project is not suitable for measuring causal relationships, the relationships should be interpreted with caution and future studies based on longitudinal information can show dynamic relationships between factors.
Cultural differences in Social media use at work are among other scientific limitations of the study, which limits the generalization of results. The participants in this study are Iranians, and whether our study can be generalized to other countries is also unclear. In general, Iranian culture is collectivist, while the Western culture, like the American culture, is characterized by individualism (Arias, 1998). Future studies can gather information from different countries and evaluate the effect of cultural differences.
The first hypothesis assumed that transformational leadership has a positive and significant effect on With the increasing popularity of social media and their availability for the vast majority of people, more societies contribute social media to their organizations to support communication and collaboration. However, there are rare empirical research on Social media use at work. As noted in this study, social media can promote the formation of social capital represented by network links, shared vision, and trust, which, in turn, can facilitate knowledge transfer. Both shared vision and knowledge transfer have a significant contribution to work performance. It was also found that shared vision, network ties and knowledge transfer between the employees had no positive effect on their performance, while trust had a positive effect on work performance of employees (26%), suggesting that variables related to communication can be used as mediators in future studies on the effect of social capital on work performance. This study quantified the advantages of social media for organizations, and encourages managers to use them better at workplace. Companies can increase employee performance through social media by following the strategies outlined in this study.
Implications
• Develop exclusive channels and pages for their organization in popular social networks (Telegram, Facebook, LinkedIn, Instagram, etc.), and introduce and explain the shared vision and goals and mission of the organization, the role of employees in achieving organizational goals etc.
• Consider these pages and channels as opportunities for employees to learn about work processes, guidelines, and even innovations and creativity in their jobs, and provide them with an effective, supervised and guided learning environment.
• Use social networks on the organization's intranet and extranet and serve as supporters of employees to facilitate the operation of HRM and other organizational processes.
• Improve informal communications promoting friendship, support, collaboration and citizenship behaviour by using intraorganizational social networks and create pages and channels for exchange of thoughts and ideas, conversations and dialogue.
• Consider proper interactive facilities (such as dialog pages and communication symbols) in social networks to increase employee trust to the organization, allow free expression of ideas on the organization, missions and visions as well as procedures.
• Provide suitable facilities for interactions and exchange of ideas in these pages and groups in order to increase employee trust to the organization, provide private conversations of employees and meet their interactive needs.
• Allow employees to invite their co-workers freely to these pages and groups and provide more recognition of the company, employees, operational and administrative processes by employees.
• Emphasize implicitly on professional commitments of employees by belief leaders (those employees whose words and ideas influence other employees) in groups and pages of social networks.
• Manage and organize the groups and channels of social networks to transfer implicit knowledge of employees, particularly more experienced employees, on administrative processes to younger employees.
• Improve formal and informal communications in the organization and establish effective communications between employees of different departments in order to establish more efficient relationships vie social networks.
• Use social networks to train employees, load educational content continuously and regularly, promote self-learning in employees through interactions in these networks.
• Allow employees to share their information, experiences and ideas about current processes of the organization to provide more understanding and collaborations among employees and facilitate knowledge transfer between them.
Based on results of this study as well as problems experienced during the study, the author suggests followings:
• This study did not confirm the effect of network ties on knowledge transfer; thus, it is recommended to address this variable, its causes and outcomes in future studies and develop models to improve the role of this variable in improving knowledge transfer among employees vie social networks.
• This study did not confirm the effect of shared vision, network ties and knowledge transfer on work performance; thus, it is recommended to address these variables and their dimensions in future studies and develop models to improve the role of these variables in improving job performance of employees vie social networks.
• It is recommended to evaluate the effect of other variables such as organizational communications, leadership study and organizational learning on work performance of employees using social networks and compare the results with current findings.
• It is recommended to examine the effect of other variables as mediating variables in the relationship between dimensions of social capital and work performance of employees using social networks and compare the results with current findings.
• It is recommended to conduct this study in other organizations and compare the results in order to find the effect of different organizational characteristics (organizational structure, organizational culture) and different demographic variables (age, gender and education).
Alvani, M., & Shirvani, A. (2004). Social capital, the guiding principle of development. Monthly tadbir , 15 (147), 1-7.
Cao, X., Guo, X., Vogel, D., & Zhang, X. (2016). Exploring the influence of social media on employee work performance. Internet Research , 26 (2), 529-545.
Chang, T. S., & Hsiao, W. H. (2014). Time spent on social networking sites: Understanding user behavior and social capital. Systems Research and Behavioral Science , 31 (1), 102-114.
Chehrehpak, M., Alizadeh, A., & Nazari-Shirkouhi, S. (2018). An empirical study on factors influencing technology transfer using structural equation modelling. International Journal of Productivity and Quality Management , 23 (3), 273-288.
DiMicco, J., Millen, D. R., Geyer, W., Dugan, C., Brownholtz, B., & Muller, M. (2008, November). Motivations for social networking at work. In Proceedings of the 2008 ACM conference on Computer supported cooperative work (pp. 711-720). ACM.
Ghazanfari, A. & Abedi, L., (2012). Motivational Satisfaction and job performance of training employees of a military academy. Human resource management studies, Issue 28, pp. 149-176.
Gholami, M. H., Asli, M. N., Nazari-Shirkouhi, S., & Noruzy, A. (2013). Investigating the influence of knowledge management practices on organizational performance: an empirical study. Acta Polytechnica Hungarica , 10 (2), 205-216.
Houman, H., (2014). Structural equations by LISREL. 3rd ed. Tehran: SAMT.
Kaplan, A. M., & Haenlein, M. (2010). Users of the world, unite! The challenges and opportunities of Social Media. Business horizons , 53 (1), 59-68.
McAfee, A. P. (2006). Enterprise 2.0: The dawn of emergent collaboration. MIT Sloan management review , 47 (3), 21.
Nazari-Shirkouhi, S., & Keramati, A. (2017). Modeling customer satisfaction with new product design using a flexible fuzzy regression-data envelopment analysis algorithm. Applied Mathematical Modelling , 50 , 755-771.
Nazari-Shirkouhi, S., Keramati, A., & Rezaie, K. (2013). Improvement of customers’ satisfaction with new product design using an adaptive neuro-fuzzy inference systems approach. Neural Computing and Applications , 23 (1), 333-343.
Noruzy, A., Dalfard, V. M., Azhdari, B., Nazari-Shirkouhi, S., & Rezazadeh, A. (2013). Relations between transformational leadership, organizational learning, knowledge management, organizational innovation, and organizational performance: an empirical investigation of manufacturing firms. The International Journal of Advanced Manufacturing Technology , 64 (5-8), 1073-1085.
Oftadeh, J., (2012). The difference between social media and mass media. Information and Librarianship quarterly, Issue 56, pp. 67-72.
Rezaie, K., Byat, M., & Shirkouhi, S. N. (2009). Evaluating effective factors of implementing knowledge management based on FAHP method. In Modelling & Simulation, 2009. AMS'09. Third Asia International Conference on (pp. 398-403). IEEE.
Tomás Gómez Arias, J. (1998). A relationship marketing approach to guanxi. European journal of Marketing , 32 (1/2), 145-156.