A Refereed Monthly International Journal of Management
Impact of Corporate Governance Practices on Non-Performing Assets (NPA) Management in Indian Public and Private Sector Banks
Author
|
Mr. Manash Kumar Sahu a
|
Mr. Narayana Maharana b
|
Dr. Suman Kalyan Chaudhury c
|
a Research Scholar (SRF), Dept. of Business Administration, Berhampur University, Berhampur, Ganjam, Odisha. Email: manash.mbabu@gmai.com
b Research Scholar (SRF), Dept. of Business Administration, Berhampur University, Berhampur, Ganjam, Odisha. Email: maharana.narayan@gmail.com
c Faculty Member, Dept. of Business Administration, Berhampur University, Berhampur, Ganjam, Odisha.
Abstract
Non-performing Assets (NPAs) are the main reason of draining the capital and weakening the financial strength of Banks. In order to increase the efficiency and profitability of banks the NPA requirement to be controlled and reduced. This study emphases on the growing concern of mounting NPA in Indian banking sector and impact of corporate governance practices on Non-Performing Assets
[i] (NPA) Management. Using the statistical tool correlation, this study highlights the correlation between weighted corporate governance score and net NPA ratio of public and private sector banks in India. Further regression analysis is performed to determine the impact of corporate governance practices in Indian public and private sector banks on their NPA management. Findings of the study advocates that, the correlation between average weighted CG score and net NPA ratio in public sector banks is significant and the impact (based on regression value) of average weighted CG score on net NPA ratio is also significant in public sector banks. In case of private sector banks both correlation and impact was found to be insignificant. But the irony is that both correlation and impact (based on regression value) was found to be positive in all cases which indicates that CG measures are improving over the last Six (06) years but not resulting in lower NPA neither in public nor in case of private sector banks in India.
Keywords: Corporate Governance, Banking Sector, NPA, Asset Quality, Bad Loans, RBI.
Introduction
Maintained gainfulness, lower level of non-performing resources & enhanced profit are the primary objectives of any banker irrespective of public, private or foreign sectors. In the recent years non-performing assets (NPA) has increasingly become a matter of concern for the Indian bankers. The way banks are managed, the technique by which banks are directed and managed and most importantly carrying the banking operations as per the stakeholders' desires is the key to success of the banking sector. The banking sector's asset quality was worsened in the recent years, with gross non-performing asset (GNPA) ratio crawling to 4.45 per cent as on March 2015, as against 4.1 per cent in March 2014
[ii], as per the latest data released by the Reserve Bank of India (RBI). Both gross and net NPA ratios
[iii] are very strong indicators of the
asset quality of a bank; the higher the gross/net NPA ratio, the
lower its asset quality. According to a CARE Rating study, the Gross Non-Performing Assets of the banks under study showed 24% (y-o-y) increase in FY15 compared with 36% in FY14 and the asset quality continues to deteriorate in the Indian banking sector.
Private sector banks remain within controlled limits, and importantly, seem to provision enough to keep Net NPAs within 1%. But the public sector banks, sadly, have not
[iv].
According to a report in The Times of India (2015) quoting the speech of minister of state for finance Jayant Sinha in the parliament, the government, RBI and the public sector banks (PSBs) are all concerned with timely recovery of NPAs as it affects their profitability and capital adequacy
[v].
A most recent study by FICCI and IBA
[vi] which was conducted during January-February 2016 advocates that, Banks in India are badly need some specific measures, including extra budgetary allocation for capitalisation of public sector lending, in the 2016 budget the issue of rising bad loans was there but no such major steps are taken. It has been observed that there has been a rise in NPAs as well as stressed assets during the period under study. The report of reveals that the proportion of respondent banks reported a rise in the level of their non-performing assets (NPAs) is higher at 76 per cent in this current survey compared to 63 per cent in the previous one. Some of the key sectors that have seen a swell in NPA levels in the second half of 2015 include metals, infrastructure, chemicals, and textiles etc.
“Public Sector Banks (PSBs) in India have performed poorly over the past 3-4 years. For the most part this has been on account of Non Performing Asset (NPA) related worries”
[vii] which has become a seminal reason for researchers, bankers and government to dig deep into the matter.
Review of Literature
- National Scenario (Indian Context):
According to
Pati, (2006) The post implementation scenario of corporate governance policies in Indian banking sector, which was commenced after the recommendations of Advisory Group (2001), has brought mixed outcome most of the banks have shown handsome profit and low NPAs. All the bank specific corporate governance practices are likely to have a direct bearing on the financial performance of banks. Likewise, some other policies which directly affect the main functions of the banks and subsequently their governance are also supposed to have some relationship. Most of the studies in the ground of corporate governance are mainly conceptual in nature and few of them are on banking sector. Moreover, there is no distinctive empirical evidences are available in financial literature for CG banking sector.
Goel, (2014) in her study titled Impact of Corporate Governance on Non Performing Assets in Banks advocates that, the main reason of failure of many banks in recent past was the non performing assets of the bank. She further adds, corporate governance and non performing assets are inter-related and no serious research been done to find out the relation between corporate governance and non-performing assets.
Zafar, Maqbool & Khalid (2013) opines in their study that, In Indian banking and financial sector, public sector banks are worst affected followed by private sector banks, and the foreign banks. NPAs reflect the performance of banks and its failure adversely affects their financial health.
In the view of
Berger et al. (2005), “State-owned banks have poor long-term performance (static effect), those undergoing privatization had particularly poor performance beforehand (selection effect), and these banks dramatically improved following privatization (dynamic effect), although much of the measured improvement is likely due to placing nonperforming loans into residual entities”.
According to
Bhabani Prasad & Veena (2011), “The Public Sector Banks, which are perceived as the foundation of the Indian Banking system, are unfortunately burdened with excessive Non Performing Assets, huge manpower and lack of advanced technology”.
Joseph & Prakash (2014) suggests that, financial institutions and banks should be proactive to adopt a practical and structured non-performing assets management system where prevention of NPA should be the priority. They also added that the NPA level is much higher in public sector banks in India compared to the other banking sector and suggested that the public sector banks should take utmost care and avoid loan/ advances leading to NPA by taking suitable preventive measures in an efficient way.
Balasubramaniam (2001) in his work on Non-performing assets and profitability of commercial banks in India stressed on the point that the level of NPAs is high with all banks and the banks are supposed to bring it down. He suggested that, effective internal control systems, good credit appraisal procedures, along with the improvement in asset quality in the balance sheets have the potential to bring down NPA in banking sector.
Chaudhary and Sharma (2011) in their comparative study on the performance of Indian Public and Private Sector Banks stated that it is high time to take appropriate and stringent measures to get rid of NPA problem. An efficient management information system (MIS) should be developed whose task is mainly to train the bank staff involved in sanctioning the advances and loans for the proper documentation and charge of securities. The bank staffs should be motivated to take methods to prevent advances turning into NPA. Moreover, they suggested that Public sector banks should pay attention on their functioning to compete with private sector banks.
According to a report published in
Mint (2014, Aug 28), the level of NPA in Public sector banks has literally reflected the poor corporate governance practices and there is a high requirement of a significant investment in the selection of the board members keeping their skill levels and management and executives with greater expertise. The same thing is also confirmed by
Nworji et al. (2011) by saying that the consistent increase in non-performing loans of Nigerian Deposit Money Banks has raised questions on the consistency of the corporate governance practices.
An interview with Former Reserve Bank Deputy Governor K C Chakrabarty said corporate governance, accountability and quality of management are the major factors responsible to deal with NPA problem in case of the Private Banks
(Business Line. 2014, May 09). He also added by describing Non-performing assets as a problem emanating from “Non-Performing Administration”.
International Scenario (Global Context):
According to a publication in
China Daily (2004, Dec 08) the Organization of Economic Co-operation and Development (OECD) defined corporate governance as the correlation between management, board of directors, shareholders and other relevant interested parties or stakeholders. To quote in this issue
Jiang Jianqing, the chairman and president of the Industrial and Commercial Bank of China (ICBC), said that Better corporate governance helps to reduce non-performing loans and increase the asset quality.
Yangyou Zhen, Rui (2010) conducted a study between 2004-08 by taking 11 commercial banks as panel data to empirically analyse the impact of credit risk aversion in commercial banks' institutional shareholding to discover that the higher the commercial bank’s ownership concentration, the greater the proportion of state-owned shares and non-performing asset ratio.
HifzaInam, & AqeelMukhtar. (2014) Said Good corporate governance aids in improving the quality of assets showing a positive relationship between the two. As the operational efficiency of a bank is appraised in term of amount of non-performing assets and default loans and ultimately efficiency of any bank reflects the ability to effectively manage its non-performing loans. Good corporate governance on the other hand helps to efficiently manage non-performing assets of a bank. Thus there is positive link between corporate governance and operational efficiency. It is also quoted that privatization can also be used as performance indicator in banking industry. Private sector banks have better corporate governance practices as compared to Govt or state owned banks, so there is a direct and favourable relationship exists between privatization of banks and corporate governance.
Paul & Simon (2014) in their study concluded that the corporate governance variable like board size (BS), board composition (BC), composition of audit committee (CAC) and power separation (PS) is not the factors responsible for the rising figure of non-performing Assets of Nigerian Banks. Hence, suggested focus on the variables like Insider Abuse, Transparency and Accountability and so on.
Ennobakhare (2010) inspected the relationship between corporate governance practices and its impact on profitability found that there is a significant relationship of banks operation and the CG practices and also proved that the ownership style of banks has significant impact on the performance of NPA in banks.
Bebeji (2010) lead a study to find out the impact of different credit management strategies on NPA and suggested that a poor management, ineffective monitoring of debts in addition to liberal credit policy, which are having good relation with CG practices are also significantly related to non-performing loans.
Nyor and Mejabi (2013) in their research on the effect of corporate governance practices on non-performing loans of Nigerian banks concluded that corporate governance variables like board size, board composition, composition of audit committee and power separation do not have significant impact on NPA. Moreover they say that these variables cannot be relied upon to solve the problem of NPA management and suggested the banks to shift the focus from the explanatory variables to other corporate governance related variables like transparency, insider abuse, disclosure practices and accountability.
Scope & Objective of the Study
Corporate governance practices in Indian banking sector is examined to draw inference regarding its correlation and impact on net NPA ratio. Scope of the study is limited to public and private sector banks only. The foreign banks are excluded from the study.
[i] “Non-performing Assets means a loan or an account of borrower which has been classified by the bank or financial institution as sub-standard, doubtful or loss asset in accordance with the directions or guidelines relating to asset classification issued by RBI”.
[ii] http://www.business-standard.com/article/finance/banks-gross-npa-ratio-rises-to-4-45-from-4-1-in-1-year-rbi-115050601332_1.html
[iii] “Gross NPA and Net NPA are the two classifications in the NPAs. Gross NPAs are the sum total of all loan assets that are classified as NPAs as per RBI guidelines as on Balance Sheet date”.
[iv] http://capitalmind.in/2014/08/bank-wise-npas-bad-loans-in-india-rise-to-2-28-lakh-cr-4-6-of-what-theyve-lent/
[v] http://timesofindia.indiatimes.com/business/india-business/Public-banks-NPAs-up-at-Rs-2-67-lakh-crore-in-FY-2015/articleshow/48161597.cms
[vi] http://profit.ndtv.com/news/budget-wishlist/article-banks-for-specific-measures-in-budget-to-deal-with-bad-loans-survey-1280878
[vii] http://www.blog.sanasecurities.com/non-performing-asset-npa-in-public-sector-banks/
Objectives of the study are:
- To examine whether there is any improvements in the CG practices of Indian banks over last five years and if yes then does it have any implication on their NPA management and control.
- To highlight the trend of gross & net NPA ratios of Indian public and private sector banks in India.
- To explore the relationship between corporate governance practices and NPA ratios in Indian public and private sector banks.
- To assess the impact of Corporate Governance Practices on Non-Performing Assets (NPA) Management in Indian Public and Private Sector Banks.
Hypotheses
Hypothesis 1A: H
0 = There is no significant correlation between average weighted CG score and net NPA ratio of public sector banks.
Hypothesis 1B: H
0 = There is no significant correlation between average weighted CG score and net NPA ratio of private sector banks.
Hypothesis 2A: H
0 = There is no significant impact of average weighted CG score on net NPA ratio in Indian public sector banks.
Hypothesis 2B: H
0 = There is no significant impact of average weighted CG score on net NPA ratio in Indian private sector banks.
Methodology
The study is empirical in nature. Data pertaining to the study are collected from secondary sources and analysed in SPSS 21. Statistical tools like correlation and regression are used to explore the relationship between corporate governance practices and net NPA ratio and to know the impact of corporate governance practices on net NPA ratio of public and private sector banks in India. For the said purpose Sample banks each from both public and private sectors are randomly selected. Six (06) public sector banks namely State Bank of India (SBI), Bank of Baroda (BOB), Punjab National Bank (PNB), Bank of India (BOI), Central Bank (CB), United Bank of India (UBI) and Six (06) private sector banks namely Federal Bank (FB), ICICI, HDFC, Kotak Mahindra Bank (KMB), IndusInd Bank, Axis Bank are considered as sample size for the study. Net NPA ratios are calculated using relevant data collected from RBI reports. To calculate the average weighted CG score of the sample banks, a 59 point rating scale (Annexure - I) was compiled referring different score cards used by different researchers, committees on CG and CG practices as mentioned in the annual reports of Indian public and private sector banks. Binary feeding method was adopted to assign scores against each of the items in the scale. In other words, if a particular practice mentioned in the scale is followed by the concern bank and the same is reflected in its annual report then ‘1’ was assigned otherwise ‘0’ was assigned for every 12 individual sample banks (06 public + 06 private). Then sum was calculated and divided by 59 to obtain the weighted CG score.
Only the last five year data is considered for the study keeping in view the most recent trend (last 5 years, shown in Fig. 1 & 2) in NPA of Indian public and private sector banks.
Rationale of the Study
Corporate governance over the globe is supreme to make a society of feasible development. Subsequently every encouraging association including banks which has a dream soaks up best practices in corporate governance to give maintainability and sound development.
Though small in number, earlier researches have attempted to establish a link between corporate governance practices in banks and the challenge of NPA management and control.
Non-performing assets (NPAs) are key concern for banks in India. NPA is one of the best indicator of the health of the banking industry. In last one decade the Public sector banks have displayed excellent performance and have one step ahead of private sector banks in financial operations. However, the only problem with public sector banks is the increasing level of NPA, year by year. On the other hand, the NPAs of private sector banks have shown a decline or stability. A reduction in NPAs indicates the practice of a strong credit appraisal processes by any bank over the years (ASOCHAM – PWC Report 2014).
According to former RBI Deputy Governor K C Chakrabarty, the private banks are better placed than the state-run banks for NPA management
[i]. The table below shows the level of gross and net NPA of Indian public and private sector banks over the last 15 years.
Table: 1 Gross & Net NPA Ratios of Public & Private Sector Banks (Financial year 2000-01 to 2015-16)
|
S. No.
|
YEAR
|
PUBLIC SECTOR BANKS
|
PRIVATE SECTOR BANKS
|
|
Gross NPA Ratio
|
Net NPA Ratio
|
Gross NPA Ratio
|
Net NPA Ratio
|
|
1
|
2001-02
|
11.09
|
5.82
|
9.64
|
5.73
|
|
2
|
2002-03
|
9.36
|
4.54
|
8.08
|
4.95
|
|
3
|
2003-04
|
7.80
|
3.00
|
5.85
|
2.80
|
|
4
|
2004-05
|
5.50
|
2.10
|
6.00
|
2.70
|
|
5
|
2005-06
|
3.60
|
1.32
|
4.40
|
1.70
|
|
6
|
2006-07
|
2.70
|
1.10
|
3.10
|
1.00
|
|
7
|
2007-08
|
2.20
|
1.00
|
2.30
|
0.70
|
|
8
|
2008-09
|
2.00
|
0.94
|
2.36
|
0.90
|
|
9
|
2009-10
|
2.20
|
1.10
|
2.32
|
0.82
|
|
10
|
2010-11
|
2.40
|
1.09
|
1.97
|
0.53
|
|
11
|
2011-12
|
3.30
|
1.70
|
1.80
|
0.60
|
|
12
|
2012-13
|
3.59
|
2.02
|
1.86
|
0.52
|
|
13
|
2013-14
|
4.34
|
2.53
|
1.82
|
0.63
|
|
14
|
2014-15
|
4.94
|
3.60
|
2.14
|
0.87
|
|
15
|
2015-16
|
9.61
|
6.10
|
2.70
|
1.30
|
Source: RBI reports
Plotting the data of Table-1 in line charts, the following two figures are obtained which clearly shows the trends of NPA in Indian banks.
[i] http://articles.economictimes.indiatimes.com/2014-05-09/news/49742779_1_private-banks-npas-state-run-banks.
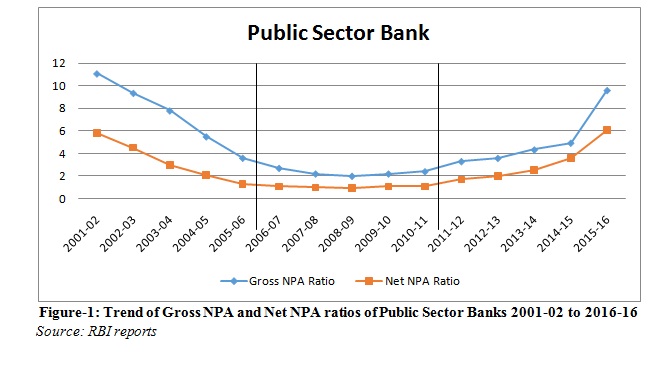
Figure- 1 depicts the last 15 year trend of gross and net NPA ratio in Indian public sector banks. Last 15 year data for both gross and NPA taken from the RBI reports plotted in the figure is divided into three phases i.e. of 5 years interval. It is clearly evident that during the 1st five year phase of 2001-02 to 2005-06 shows a declining trend in both gross and net NPA. In the 2nd five year phase (2006-07 to 2010-11) gross NPA was decreasing and trend of net NPA was almost stable and maintained at and around 2.00 which was a period of contentment for the Indian public sector banks. But the most recent trend of both gross and net NPA in public sector banks is alarming as it shows a continuous increasing trend over the last five years.
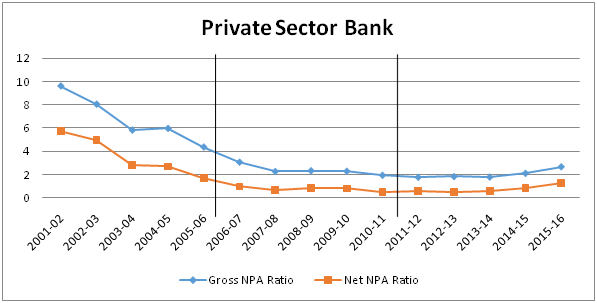 Figure-2: Trend of Gross NPA and Net NPA ratios of Private Sector Banks 2001-02 to 2015-16.
Source: RBI reports
Figure- 2 represents the last 15 year trend of gross and net NPA ratio in Indian private sector banks. Last 15 year data of both gross and NPA taken from the RBI reports plotted in the figure is divided into three phases i.e. of 5 years interval. It is clearly evident that during the 1st five year phase of 2001-02 to 2005-06, though there were ups and downs in both gross and net NPA but there was a declining trend. In the 2nd five year phase (2006-07 to 2010-11) both gross and NET NPA was decreasing continuously in Indian private sector banks. The most recent trend of both gross and net NPA in private sector banks is almost stable over the last five years and it can be said that the private sector bankers are in a better position than the public sector banks in terms of NPA management.
From the above discussion it can be said that NPA management and control has become a matter of serious concern for the public sector banks. In order to be in a better financial position and to show a better asset quality in the competitive financial market, public sector bank must have to take effective measures. Many researchers and financial experts have reported that better corporate governance practices may result in decline in NPA in banks. CG practice was there since last 15 years and bankers are continuously trying to improve their CG practices over the years. But the question arises in this context is – if improvements and fairness in CG practices was resulting in lower NPA in banks then what happened in the last five years that despite of having improved and fairer CG practices Indian bankers are not able to lower their NPA ratio. This alarming trend of NPA in Indian banking sector provides ample perspective to investigate whether there is any significant role of CG practices in banks towards NPA management and control.
CG & NPA in Indian Banks
The study of
Pati (2006), on the influence of corporate governance practices on the performance of private and public sector banks reveals that the banks that are good at corporate governance practices have shown better NPA management by showing a good negative correlation between CG score and Net Non-performing asset ratio. Whereas during past five years starting from 2011 to 2015 there is a steady increase in the NPA ratio at the same time the corporate governance practices of the scheduled commercial banks are becoming better and transparent. This contradictory movement of these two variables proves that there is no influence of the corporate governance practices of banks and its impact on the performance in general and NPA management in particular or there might be some other factors having influence on NPA.
According to a report by ASOCHAM-PWC, there are basically two categories of factors leading to NPA (Table - 2).
Table – 2 Factors Leading to NPAs
|
Internal factors
|
External factors
|
|
Diversion of funds.
Time and cost overruns during project implementation.
Business failure.
Inefficiency of management.
Negligence in credit management and monitoring.
Inappropriate and obsolete technology.
Lack of coordination between lenders.
|
Recession in the market.
Price rise and currency fluctuations.
Changes in Government policies,
Environment concerns like accident and natural calamities etc.
|
It is a fact that the pile of NPA didn’t escalate overnight. Because a part of this is because of careless lending practices by the banks to breed their loan book, and another part is due to the advancing to the high risk sectors like agriculture. Besides these two genuine causes there are some will full defaulters which caused increase in NPA ratio over a couple of years. The finance minister Mr. Jaitley took the matter seriously and gave his concern to come out with a well-thought-out plan which can addresses the immediate concerns and help in creating long term solution like creation of an effective bankruptcy law to handle nearly 7,035 cases of wilful defaulters that have bad debt to the tune of Rs 58,792 crore as on 31 march 2015
[i].
Keeping the above problem in view the RBI now is trying to focus more on the NPA management of the Commercial banks. A very recent news form the RBI the Governor Mr. R.R. Rajan appealed to the banks to reduce the NPA Ratio to a zero figure by 2017, because if the same trend prevail then there will be a severe financial problems in the banking sector which will even delay the recovery of the economy. Now the RBI is planning a Carrot and Stick regime by incentivising efforts to make recoveries and penalising slack to control NPA. In a discussion with some of the officials of select private and public sector banks only, HDFC bank’s Sukthankar said, “There are some practical difficulties faced in implementation of the proposed schemes of RBI like SDR and 5:25 refinancing plan however different suggestions have come in terms of making SDR (Strategic Debt Restructuring), 5:25 Scheme, and JLF (Joint Lenders’ Forum) more effective in terms of implementation.
Data Analysis & Interpretation
Net NPA ratio of the sample banks are sourced from the RBI reports. Corporate Governance scores of public and private sector banks are calculated by using the 59 point scale (Annexure-I). Binary feeding method was used to determine the CG score of each bank in both sample groups. Weighted CG score is calculated by dividing the obtained CG score by 59 (total number of parameters). The weighted CG score close to ‘one’ indicates higher CG and score closer to ‘zero’ indicates low CG measures by both sample bank groups.
Data compiled (both net NPA ratios & weighted CG scores) are presented in the tables below. Table-3 represents the data pertaining to public sector banks and Table-4 represents the data related to private sector banks in India.
[i] http://firstpost.com/business/jaitley-is-right-bank-npas-are-unacceptably-high-and-so-an-rbi-rate-cut-of-much-use-2402624.html
Table – 3 Net NPA Ratios and Average Weighted CG Score (Public Sector Banks)
|
Public Sector Banks
|
|
Bank Name
|
SBI
|
BOB
|
PNB
|
BOI
|
CB
|
UBI
|
Avg. NPA Ratio (Sample Banks)
|
Avg. Weighted CG Score (Sample Banks)
|
|
YEAR
|
Net NPA Ratio
|
Weighted CG SCORE
|
Net NPA Ratio
|
Weighted CG SCORE
|
Net NPA Ratio
|
Weighted CG SCORE
|
Net NPA Ratio
|
Weighted CG SCORE
|
Net NPA Ratio
|
Weighted CG SCORE
|
Net NPA Ratio
|
Weighted CG SCORE
|
|
2010-11
|
1.63
|
0.627
|
0.35
|
0.593
|
0.85
|
0.678
|
0.91
|
0.559
|
1.10
|
0.610
|
1.19
|
0.780
|
1.005
|
0.641
|
|
2011-12
|
1.82
|
0.661
|
0.54
|
0.610
|
1.52
|
0.695
|
1.47
|
0.576
|
1.46
|
0.627
|
1.70
|
0.797
|
1.418
|
0.661
|
|
2012-13
|
2.10
|
0.678
|
1.28
|
0.644
|
2.35
|
0.746
|
2.06
|
0.610
|
2.18
|
0.644
|
1.61
|
0.797
|
1.930
|
0.686
|
|
2013-14
|
2.57
|
0.695
|
1.52
|
0.627
|
2.85
|
0.746
|
2.00
|
0.593
|
1.98
|
0.644
|
2.33
|
0.814
|
2.208
|
0.686
|
|
2014-15
|
2.12
|
0.695
|
1.89
|
0.644
|
4.06
|
0.763
|
3.36
|
0.610
|
2.65
|
0.644
|
2.71
|
0.831
|
2.798
|
0.698
|
|
2015-16
|
3.81
|
0.695
|
5.06
|
0.644
|
8.61
|
0.763
|
3.35
|
0.610
|
6.42
|
0.644
|
5.25
|
0.831
|
5.416
|
0.697
|
Source: RBI reports (NPA) and Authors’ compilation (CG scores) from Annual reports of banks
Table – 4 Net NPA Ratios and Average Weighted CG Score (Private Sector Banks)
|
Private Sector Banks
|
|
Bank Name
|
FB
|
ICICI
|
HDFC
|
KMB
|
INDUS IND
|
AXIS
|
Avg. NPA Ratio
|
Avg. Weighted CG Score
|
|
YEAR
|
Net NPA Ratio
|
Weighted CG SCORE
|
Net NPA Ratio
|
Weighted CG SCORE
|
Net NPA Ratio
|
Weighted CG SCORE
|
Net NPA Ratio
|
Weighted CG SCORE
|
Net NPA Ratio
|
Weighted CG SCORE
|
Net NPA Ratio
|
Weighted CG SCORE
|
|
2010-11
|
0.60
|
0.763
|
1.11
|
0.678
|
0.19
|
0.678
|
0.59
|
0.576
|
0.28
|
0.814
|
0.26
|
0.695
|
0.505
|
0.701
|
|
2011-12
|
0.53
|
0.780
|
0.73
|
0.695
|
0.18
|
0.695
|
0.51
|
0.593
|
0.27
|
0.847
|
0.25
|
0.712
|
0.412
|
0.720
|
|
2012-13
|
0.98
|
0.780
|
0.64
|
0.712
|
0.20
|
0.712
|
0.55
|
0.610
|
0.31
|
0.847
|
0.32
|
0.712
|
0.500
|
0.729
|
|
2013-14
|
0.74
|
0.814
|
0.82
|
0.695
|
0.27
|
0.695
|
0.88
|
0.610
|
0.33
|
0.847
|
0.44
|
0.729
|
0.580
|
0.732
|
|
2014-15
|
0.73
|
0.797
|
1.40
|
0.695
|
0.25
|
0.695
|
0.79
|
0.627
|
0.31
|
0.831
|
0.46
|
0.712
|
0.678
|
0.726
|
|
2015-16
|
1.64
|
0.797
|
2.67
|
0.695
|
0.28
|
0.712
|
0.93
|
0.627
|
0.36
|
0.831
|
0.73
|
0.712
|
1.101
|
0.726
|
Source: RBI reports (NPA) and Authors’ compilation (CG scores) from Annual reports of banks
Relationship between mean net NPA and average weighted CG scores
To know the relationship between NPA ratios and CG scores, correlation between mean net NPA and average weighted CG scores is calculated and furnished separately for public and private sector banks separately in the tables below.
Table- 5.1: Public Sector Banks
|
|
Mean Net NPA Ratio of Sample Public Sector Banks
|
Average Weighted CG Score of Sample Public Sector Banks
|
|
Mean Net NPA Ratio of Sample Public Sector Banks
|
Pearson Correlation
|
1
|
.722
|
|
Sig. (2-tailed)
|
|
.106
|
|
N
|
6
|
6
|
|
Average Weighted CG Score of Sample Public Sector Banks
|
Pearson Correlation
|
.722
|
1
|
|
Sig. (2-tailed)
|
.106
|
|
|
N
|
6
|
6
|
|
* Correlation is significant at the 0.05 level (2-tailed).
|
From Table-5.1, it is evident that Pearson’s r = 0.722 (p value = 0.106) is not significant and the null Hypothesis 1A is accepted. It indicates there is a no strong relationship between ‘Mean Net NPA Ratio of Public Sector Banks’ and ‘Average Weighted CG Score of Public Sector Banks’. This means that changes in Average Weighted CG Score of Public Sector Banks will not bring about significant changes in Net NPA Ratio of Public Sector Banks. Even though the correlation is not significant but it is surprising positive. Hence we have carried out regression analysis to find out whether this relation is only due to chance or something else.
Table-5.2: Private Sector Banks
|
|
Mean Net NPA Ratio of Sample Private Sector Banks
|
Average Weighted CG Score of Sample Private Sector Banks
|
|
Mean Net NPA Ratio of Sample Private Sector Banks
|
Pearson Correlation
|
1
|
.269
|
|
Sig. (2-tailed)
|
|
.606
|
|
N
|
6
|
6
|
|
Average Weighted CG Score of Sample Private Sector Banks
|
Pearson Correlation
|
.269
|
1
|
|
Sig. (2-tailed)
|
.606
|
|
|
N
|
6
|
6
|
From Table-5.2, it is evident that Pearson’s r = 0.269 (p value = 0.606) is not significant and hence null Hypothesis 1B is not rejected. It indicates there is no statistically significant relationship between ‘Mean Net NPA Ratio of Private Sector Banks’ and ‘Average Weighted CG Score of Private Sector Banks’. This means that changes in Average Weighted CG Score of Private Sector Banks is not significantly correlated with changes in Net NPA Ratio of Private Sector Banks.
But it is quite surprising and unfortunate that the correlation is positive in both cases (public & private sector banks). In other words, with improvements in CG practices in both public and private sector banks the net NPA ratio is not decreasing over the last six (06) years rather it’s increasing.
Impact of Corporate Governance Practices on Net NPA Ratio
To examine the impact of corporate governance practices on net NPA ratio of banks, regression analysis is performed by considering mean net NPA ratio of Sample banks as dependent variable and average weighted CG score of sample banks as independent variable or predictor. Analysis is performed separately for both public and private sector banks and reported separately with regression equations for both cases.
Case of Public Sector Banks
Table – 6.1 Model Summary
|
Model
|
R
|
R Square
|
Adjusted R Square
|
Std. Error of the Estimate
|
|
|
1
|
.722a
|
.521
|
.401
|
1.2190847
|
|
|
a. Predictors: (Constant), Average Weighted CG Score of Sample Public Sector Banks
|
|
|
Table – 6.2 ANOVAa
|
|
|
Model
|
Sum of Squares
|
df
|
Mean Square
|
F
|
Sig.
|
|
|
1
|
Regression
|
6.445
|
1
|
6.455
|
4.343
|
.106b
|
|
|
Residual
|
5.945
|
4
|
1.486
|
|
|
|
|
Total
|
12.399
|
5
|
|
|
|
|
|
a. Dependent Variable: Mean Net NPA Ratio of Sample Public Sector Banks
b. Predictors: (Constant), Average Weighted CG Score of Sample Public Sector Banks
|
|
|
Table – 6.3 Coefficientsa
|
|
Model
|
Unstandardized Coefficients
|
Standardized Coefficients
|
t
|
Sig.
|
|
B
|
Std. Error
|
Beta
|
|
1
|
(Constant)
|
-31.678
|
16.390
|
|
-1.933
|
.125
|
|
Average Weighted CG Score of Sample Public Sector Banks
|
50.343
|
24.156
|
.722
|
2.084
|
.106
|
|
a. Dependent Variable: Mean Net NPA Ratio of Sample Public Sector Banks
|
The value of R
2 equals 0.521 (Table-6.1), indicates that
52.1 per cent of the variations in net NPA ratio in public sector banks is accounted for public sector bank’s average weighted CG score. In other words net NPA ratio in public sector banks is moderately influenced by average weighted CG score in case of Indian public sector banks. However, the value of R
2 equals 0.521 is not significant (at 0.05 level) as indicated by p value (0.106) of F statistics
[1] as obtained in ANOVA table indicates poor goodness of fit of the model. Hence Hypothesis 2A is accepted which says, there is no significant impact of CG score on net NPA ratio in public sector banks in India.
The estimated regression equation as obtained in Table- 6.3 may be written as:
Net NPA Ratio = -31.678 + 50.343AWCG
t = (-1.933) (2.084)
[1] F value of ≥ 10 indicates all independent variables have impact on dependent variable
Case of Private Sector Banks
|
Table – 7.1 Model Summary
|
|
|
Model
|
R
|
R Square
|
Adjusted R Square
|
Std. Error of the Estimate
|
|
|
1
|
.269a
|
.072
|
-.159
|
.2666751
|
|
|
a. Predictors: (Constant), Average Weighted CG Score of Sample Private Sector Banks
|
|
|
Table – 7.2 ANOVAa
|
|
|
Model
|
Sum of Squares
|
df
|
Mean Square
|
F
|
Sig.
|
|
|
1
|
Regression
|
.022
|
1
|
.022
|
.313
|
.606b
|
|
|
Residual
|
.284
|
4
|
.071
|
|
|
|
|
Total
|
.307
|
5
|
|
|
|
|
|
a. Dependent Variable: Mean Net NPA Ratio of Sample Private Sector Banks
b. Predictors: (Constant), Average Weighted CG Score of Sample Private Sector Banks
|
|
|
Table – 7.3 Coefficientsa
|
|
Model
|
Unstandardized Coefficients
|
Standardized Coefficients
|
t
|
Sig.
|
|
B
|
Std. Error
|
Beta
|
|
1
|
(Constant)
|
-3.677
|
7.704
|
|
-.477
|
.658
|
|
Average Weighted CG Score of Sample Private Sector Banks
|
5.962
|
10.664
|
.269
|
.559
|
.606
|
|
a. Dependent Variable: Mean Net NPA Ratio of Sample Private Sector Banks
|
The value of R
2 equals 0.072 (Table- 7.1), indicates that only
7.2 per cent of the variations in net NPA ratio is accounted for average weighted CG score in private sector banks. In other words net NPA ratio in private sector banks is not significantly influenced by average weighted CG score in case of Indian private sector banks. The value of R
2 equals 0.106 is not significant (at 0.05 level) as indicated by p value (0.606) of F statistics
[1] as obtained in ANOVA table indicates low goodness of fit of the model. Hence Hypothesis 2B is not rejected which means there is no significant impact of CG score on net NPA ratio in private sector banks in India.
The estimated regression equation as obtained in Table-7.3 may be written as:
Net NPA Ratio = -3.677 + 5.962AWCG
t = (-0.477) (0.559)
Table-8 Model Summary: Corporate Governance and Net NPA Ratio
|
|
Sample Bank Group
|
Model
|
R2
|
F value
|
Remarks
|
|
A
|
Public Sector Banks
|
Net NPA Ratio = -31.678 + 50.343AWCG
|
0.521
|
4.343
|
Not Significant
|
|
B
|
Private Sector Banks
|
Net NPA Ratio = -3.677 + 5.962AWCG
|
0.072
|
0.313
|
Not Significant
|
*Significant at 0.05 level, **Significant at 0.01 level
AWCG = Average weighted CG score
Estimated regression equation A (Table - 8) indicates that CG score not is positively related with Net NPA ratio in both public and private sector banks. It is quite surprising that improved CG measures/ disclosures is not resulting in minimized Net NPA ratio
[2] in Indian public as well as private sector banks.
Limitation & Future Scope
As far as the limitations are concerned, the sample size taken is small and limited to six (06) from each public and private sector banks. For this study only public & private sector banks are considered. The foreign banks are excluded from the study. The data considered for the study is of last Six (06) years only. Study conducted with large sample size and larger time frame data may yield different results. Further the scale developed to measure CG score is limited to 59 point scale. A CG Score card having more and different items included may produce different CG score and accordingly the results vary.
Future studies may be conducted by considering all public, private and foreign banks’ CG scores and NPA data of a larger time frame (say 15-20 years) to generalize the inferences. Further inter group comparative studies may be conducted such as among RRBs, Nationalized banks, SBI associates, Commercial banks etc.
As we know Corporate governance practices is not the only factor which is responsible for the performance of the banks other factors and policies pertaining to the management of NPA if looked after then the actual problem would be more prominent. The present research is meant to counter the earlier researches which claim that better corporate governance practices leads to better performance of banks in general and better management of non-performing assets in particular.
Suggestions & Conclusion
In the last few years, Indian economy witnessed decline trend and the banks have been bestrode with high NPAs. Managing bad loans and controlling them at lowest level has become paramount important for the banking industry in recent years and no corporate governance measures seems to be fruitful in controlling the NPA in both public and private sector banks. In a situation of liquidity overhang, the eagerness of the bank to increase lending may compromise on asset quality there by raising worry about their adverse selection and potential danger of addition to the stock of NPAs (
Bhabani Prasad & Veena 2011). To reduce the level of NPAs in the loan portfolio, comprehensive preventive monitoring mechanism to explore and maintain sound and healthy loan portfolio has to be developed and adopted. The approach to NPA management by the banks has to be multipronged, necessitating varied strategies suited to different stages of the passage of credit, every commercial bank has to embark upon strategic plan to prevent or control the occurrence of the NPAs. Infusion plan may help in providing some growth capital for the banks in current and future financial years; however, given the fact that the provision coverage ratio is low for most of the PSU banks, additional capital will be required to provide sufficient cover for stressed assets (
CARE Rating Report - 2015).
As per the findings of this study, the established notion that good CG practices results in lower net NPA ratio
(Pati, 2006; Ennobakhare, 2010; Bebeji, 2010; Nyor and Mejabi 2013) could not be re-established. The reason may be due to data taken for the study is of a small time period of five (05) years only. Hence it can be concluded that, some other influencing factors exists which need to be explored and taken care of along with corporate governance practices to bring down the NPA ratio.
Siraj (2013) advocates that, “the non-performing assets is not a function of loan/advance alone, but is influenced by other bank performance indicators and also by the macroeconomic variables”. It is therefore, imperative to bring about radical changes in NPA management and control mechanism. An enduring solution to the problem of NPAs can be attained only by adopting crystal clear policy guidelines in respect of credit appraisal with minute, proper assessment of credit and risk management mechanism along with credit rating of the potential borrower. Banks must develop suitable and relevant model to for minute appraisal of lending risks. Loan review mechanism need to be adopted as a relevant tool to bring about improvements in the credit administration and exchange of credit information among banks should be developed in order to avoid possible NPAs. (Zafer, Maqbool & Khalid 2013). Assessment of health and repaying capacity of the credit applicants along with their own risk-rating system to assess the risk of lending need to be practiced by Indian bankers in order to achieve and maintain a lower NPA ratio.
References:
http://www.business-standard.com/article/finance/banks-gross-npa-ratio-rises-to-4-45-from-4-1-in-1-year-rbi-115050601332_1.html
http://timesofindia.indiatimes.com/business/india-business/Public-banks-NPAs-up-at-Rs-2-67-lakh-crore-in-FY-2015/articleshow/48161597.cms
http://profit.ndtv.com/news/budget-wishlist/article-banks-for-specific-measures-in-budget-to-deal-with-bad-loans-survey-1280878
http://www.blog.sanasecurities.com/non-performing-asset-npa-in-public-sector-banks/
http://firstpost.com/business/jaitley-is-right-bank-npas-are-unacceptably-high-and-so-an-rbi-rate-cut-of-much-use-2402624.html
http://articles.economictimes.indiatimes.com/2014-05-09/news/49742779_1_private-banks-npas-state-run-banks.
http://capitalmind.in/2014/08/bank-wise-npas-bad-loans-in-india-rise-to-2-28-lakh-cr-4-6-of-what-theyve-lent/
Pati, A.P. (2006). “Does Corporate Governance Matter in Indian Banking? Policy Implications on the Performance.” Indian Institute of Capital Markets 9
th Capital Markets Conference, Available at SSRN: http://dx.doi.org/10.2139/ssrn.877180.
ASOCHAM – PWC Report. (2014). on Growing NPAs in banks Efficacy of Credit Rating Agencies. Retrieved from: https://www.pwc.in/assets/pdfs/publications/2014/growing-npas-in-banks.pdf
Balasubramaniam, C.S. (2001). “Non-performing assets and profitability of commercial banks in India: assessment and emerging issues.” Abhinav Journal, Vol.1, Issue 7, pp. 91-103. ISSN 2277-1166.
Credit Analysis & Research Limited [CARE] Report (2015). Banking Sector Performance Study – FY15.
Bebeji, A. (2010). “An Accessment of credit management strategies and non-performing loans of banks in Nigeria.” Paper presented at a maiden annual conference, organised by school of business and financial studies, Kaduna Polytechnic.
Berger, N. A., Clarke, G., Cull, R., Klapper, L. & Udell, G. F. (2005). “Corporate governance and bank performance: A joint analysis of the static, selection, and dynamic effects of domestic, foreign, and state ownership.” Journal of Banking & Finance, Vol. 29, pp. 2179–2221.
Bhabani Prasad, G. V., & Veena, D. (2011). “NPAs Reduction Strategies for Commercial Banks in India.” International Journal of Management & Business Studies IJMBS Vol. 1, Issue 3, pp. 47-53.
Chaudhary, K. & Sharma, M. (2011). “Performance of Indian Public Sector Banks and Private Sector Banks: A Comparative Study.” International Journal of Innovation, Management and Technology, Vol. 2, No. 3. Pp. 45-58.
Enobakhre, A. (2010). “Corporate governance and bank performance in Nigeria.” MBA Research Report, University of Stellenbossch. Retrived from:
http://hdl.handle.net/10019.1/8439.
Goel, I. (2014). “Impact of Corporate Governance on Non-Performing Assets in Banks.” ZENITH International Journal of Business Economics & Management Research (ZIJBEMR), Vol.4 (3), pp. 15-28, ISSN 2249- 8826.
Joseph, A. L. & Prakash, M. (2014). “A Study on Analyzing the Trend of NPA Level in Private Sector Banks and Public Sector Banks.” International Journal of Scientific and Research Publications, Volume 4, Issue 7, pp 1-9, ISSN 2250-3153 .
Siraj, K. K. (2014). “A Study on Non-Performing Assets of Public Sector Banks in India with Special Reference to State Bank of Travancore.” PhD Thesis, Submitted to School of Management Studies, Cochin University of Science and Technology.
Terzungwe Nyor and Simon K. Mejabi (2013). “Impact of corporate governance on non performin loans of Nigerian Deposit Money Banks.” Journal of Business and management, 2(3), pp.12-21. ISSN 2291-1995.
Zafar, S. M. T., Maqbool, A. & Khalid, S.M. (2013). “Nonperforming Assets and its Impact on Indian Public Sector Banks.” International Journal of Marketing, Financial Services & Management Research, Vol.3, No. 2, pp 68-87, ISSN 2277- 3622.
Corporate governance and NPAs. (2014, Aug 28). Mint Retrieved from
https://search.proquest.com/docview/1556770527?accountid=175699.
Better corporate governance helps private banks limit NPAs'. (2014, May 09). Business Line Retrieved from
https://search.proquest.com/docview/1522810885?accountid=175699.
Paul, A. A., & Simon, K. M. (2014). “The impact of corporate governance variables on non-performing loans of Nigerian deposit money banks.” Asian Economic and Financial Review, 4(11), 1531-1544.
Qiwen, Z. (2004, Dec 08). “Corporate governance key to banks.” China Daily Retrieved from
https://search.proquest.com/docview/257811572?accountid=175699
YANG Youzhen. Rui (2010). “China Commercial Bank Risk Aversion and Ownership Structure: Based on the Panel Data and Evidence [J]”. Finance and Trade Economics. (6): 33-39
HifzaInam, & AqeelMukhtar. (2014). “Corporate governance and its impact on performance of banking sector in Pakistan”. International Journal of Information, Business and Management, 6(3), 106-117.
Nworji, I.D., O. Adebayo and O.D. Adeyanju, (2011). “Corporate governance and bank failure in Nigeria; Issues, challenges and opportunities”. Research Journal of Finance and Accounting, 2(2): 24-37.
[1] F value of ≥ 10 indicates all independent variables have impact on dependent variable
[2] It should be negatively related so that it could be proved that high CG measures/ disclosure results in lower Net NPA ratio.

