A Refereed Monthly International Journal of Management
A Study on Brand Loyalty in Retail Segment with special focus on Pantaloons
Author
|
Deepa Vyas
Assistant Professor
GLS University
Ahmedabad - 13
|
Siddharajsinh D parmar
Student MBA- GLS university
Ahmedabad - 382405
|
Abstract:
The very popular word loyalty and the advantages that a loyal customer group gives to an organisation and more specifically to retail customers. With number of loyalty programme memberships including hotel, supermarket, airline and financial services, in the India alone it is clear that loyalty programmes are an essential part of the marketing plan and strategy of retail organisations – a road to survival, growth and profits. The research throws the light on the effectiveness of the loyalty programmes and the preferences of customers on different aspects.
One variable test, Hypothesis testing, KMO & Bartlett’s test, Reliability test and factorial analysis was mainly performed to see the different angles of the research study. Questionnaire were the medium of data collection through the research period of one and half months. This study investigated the factors that influence customer loyalty in the apparel retail industry and found that the two most important drivers of customer loyalty were discount & offers and quality related variables. Price did not feature as an important driver of loyalty disclosing the opportunities for small and big retailers to focus on loyalty and the strategies that do not revolve solely around price but rather focus on long-term relationship building. The responses received from this research were showcasing the facts and will be of value to many retailers who have an existing loyalty programme or are contemplating the starting of a programme.
Keywords: Customer Loyalty; Customer Loyalty Programmes; Factors of loyalty; Feelings towards a brand
Introduction:
Today’s customers have become more aware, more conscious towards purchasing products. They are less loyal to the brands because of discounts, scheme & other promotional startegies company uses in order to sell the product. Loyaltyisdevotionandfaithfulnessto a cause,country, group, orperson. Loyalty may certainly be between two persons, but it may also be from a person to a group of people.Loyalties differ inbasisaccording to their roots. They may be developed upon the basis of unalterable facts that makes a personal connection between the subject and the object of the loyalty. Loyalties differ instrength, scope, legitimacy and attitude also.
Businesses seek to become the objects of loyalty in order to retain customers.Brand loyaltyis a consumer's preference for a particular brandand a commitment to repeatedly purchase that brand. Loyalty programsoffer rewards to repeat customers in exchange for being able to keep track of consumer preferences and buying habits.
Company resources are engaged so as to higher theloyaltyof customers and other related parties such as stakeholders in the expectation that corporate objectives will be met or surpassed. Quality of productorserviceleads to satisfaction of consumers, which leads to increased customer loyalty, which leads to profitability.
Literature Review:
Considering measurements of loyalty, Aaker (1991) identified brand loyalty’s five levels and groups customers accordingly: non loyal buyers - satisfied or at least not dissatisfied buyers -satisfied buyers with perceived switching costs - likers of the brand –committed customers.
Considering the level of involvement Assael (1992) identified four types of consumers brand loyalty : complex loyals - dissonance loyals -habitual loyals - variety-seekers
Dick and Basu (1994) ,The authors consider brand loyalty as the relationship between the relative attitude toward an entity (brand/service/store/vendor) and patronage behaviour. Moreover, Dick and Basu (1994) identify four categories of loyalty: sustainable loyalty latent loyalty - spurious loyalty - no loyalty.
Payne (1994) who examined the progress of consumers. After converting a prospect into a customer the customer becomes a client, then the client becomes a supporter,then he becomes advocate who is someone who is so pleased with the brand that they strongly recommend it to the others. The final step is the partner who just represents a situation where a very close.
Mellens et al (1996) classify brand loyalty measures into four groups attitudinal brand-oriented -attitudinal individual-oriented measures - behavioral brand-oriented measures - behavioral individual-oriented
Another important input in the literature regarding customer loyalty measurement is provided by Gremler and Brown (1999) who stretched the concept of customer’s loyalty to service (intangible) goods with their definition of service loyalty and include behavioural, attitudinal, and cognitive aspects of loyalty. Eventually, a service loyalty number is determined for each and every respondent, thus being identified low, medium, and high loyalty customers.
Oliver (1999) emphasizes the notion of brand loyalty situational influences having a four phase structure of customer’s loyalty development.
cognitive loyalty: the brand attribute information available
affective loyalty: a liking or attitude toward the
conative loyalty (behavioral intention): influenced by repeated episodes of positive affect
action loyalty: the motivated intention
Aydin and Özer (2005) suggest a loyalty measurement model ,propose the following sets of measures related to customer loyalty: switching costs-customer loyalty- corporate image - trust -service quality
Wulf et al (2001),In their model, the authors used several aspects and dimensions which are related to customer loyalty:
preferential treatment (makes greater efforts for regular
interpersonal communication (takes the time to personally get to know)
tangible rewards (rewards regular customers for their patronage)
perceived relationship investment (makes efforts to increase regular customers' loyalty)
Research Methodology: The study was conducted in Ahmedabad with sample size of 100. Convenient sampling was used to collect data. Questionnaire was used as a tool to collect data. The research was conducted to fulfil the following objectives:
- To determine the loyalty of the consumer and its faith in the company
- To determine the factors leads to satisfaction and loyalty.
- To learn that what brand and types of articles gets the highest loyalty at store.
- To study the different loyalty programmes at pantaloons
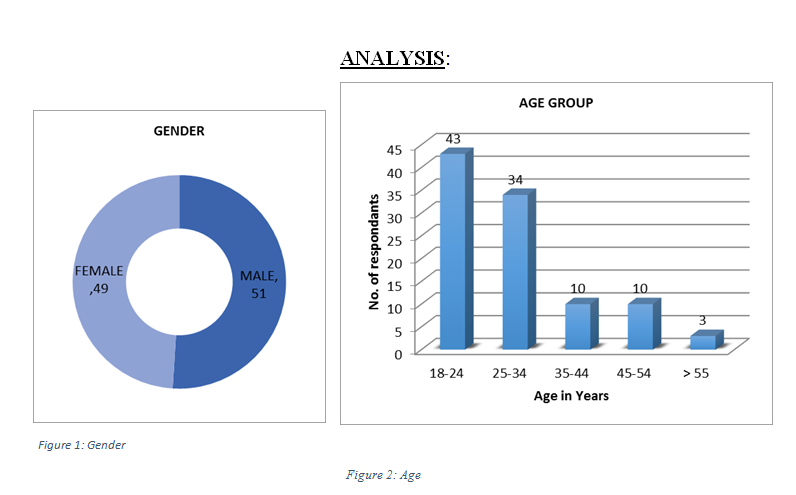
From the above graph 1 it can be seen that from total of 100 respondents 49 were female & 51 were male. From the Graph 2 it can be inferred that 43 respondent falls in the age group of 18 – 24 and 34 respondent fall in the age group of 25-34.
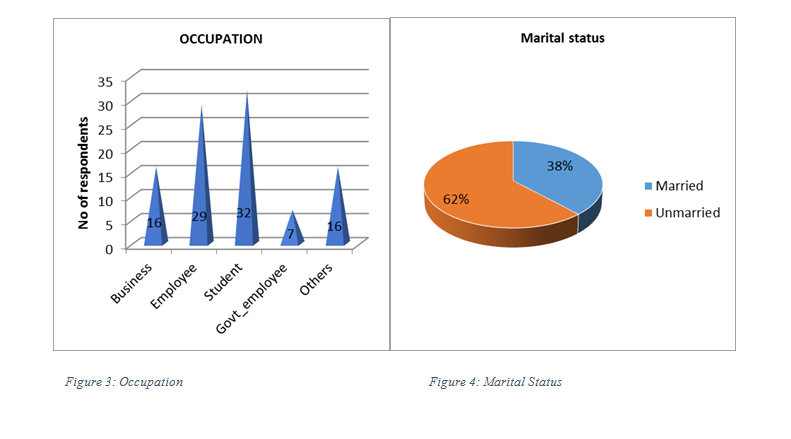
Figure 3 indicates that 32% of the respondent are students and 29% of the students are employees (service). 62% of the respondents are unmarried (Figure 4).
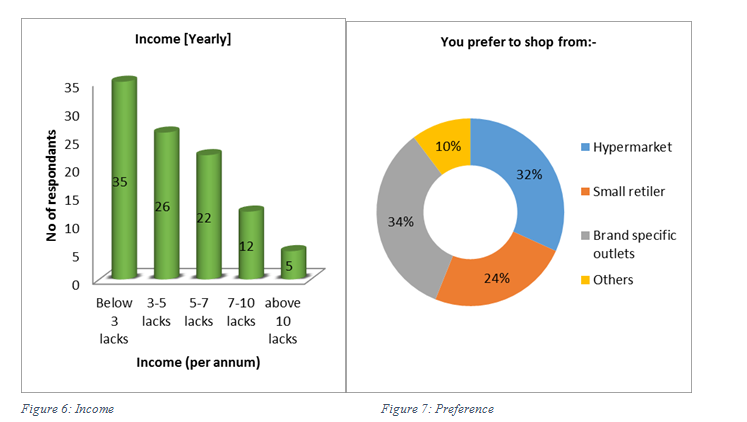
35% of the respondents has income below 3 lakhs and 26% of the respondents have income between 3 – 5 lakhs (Figure 6). Figure 7 indicates that 34% of the respondents prefer to shop from branded stores.
Figure 8 infers that 16% of the respondents shop once in a two week from Pantaloons and 39% of the respondent prefer to shop from Pantaloons once in a month. 52 respondents shop from Pantaloons due to its product quality & 41 gets attracted to shop from Pantaloons due to its promotions & offers (Figure 9).
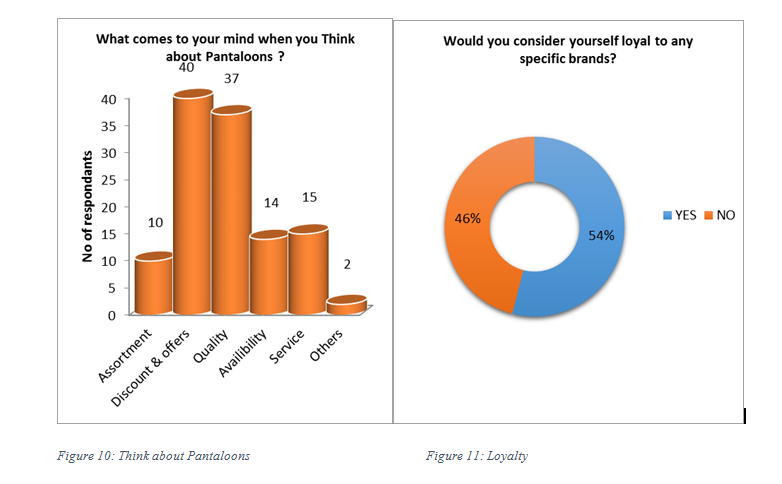
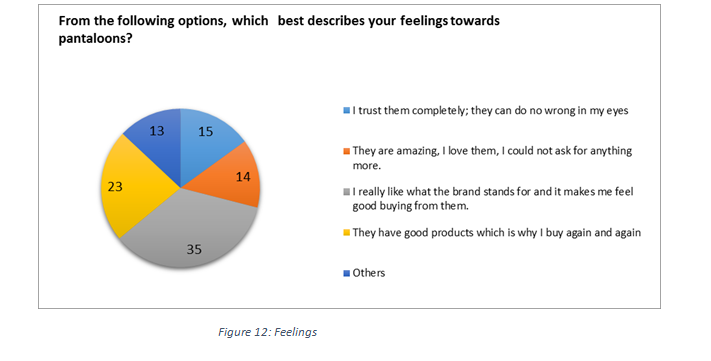
Quality, Discount & Offers are the main parameter which comes to the mind of customer when they think of Pantaloons (Figure 10). Figure 11 infers that 54% of the customer rate themselves as loyal to any particular brand, whereas 46 % are not loyal & they change their preference. Figure 12 indicates feelings of customers towards pantaloons. 35% of the customers feels that they like the way brand stands for and it makes me feel good buying from them. 23% of the customers are of view that Pantaloons have good products which is why they buy from pantaloons on regular basis
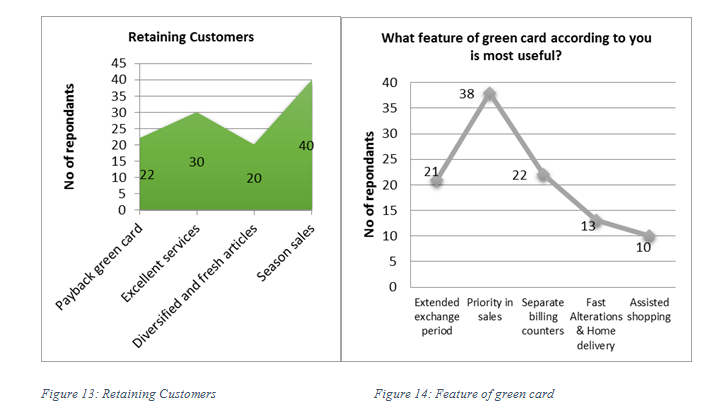
Season sale is the most important factor to retain customer followed by excellent service (figure 13). Green card holders of pantaloons feels that priority in sales (38%) is the most important feature of green card. Even separate billing counter for green card holders is an added advantage (figure 14).
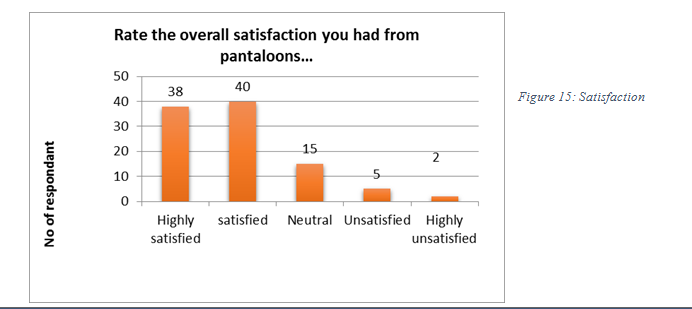
40% of the customers are satisfied and 38% of the customers are highly satisfied with the Pantaloons.
HYPOTHESIS TESTING:
- H0: There is no significant relationship between income and frequently buying at pantaloons
H1: There is significant relationship between income and frequently buying at pantaloons
|
Table 1: Chi Square - income & frequency
|
|
|
Value
|
df
|
Asymp. Sig. (2-sided)
|
|
Pearson Chi-Square
|
15.731a
|
16
|
.472
|
|
Likelihood Ratio
|
15.441
|
16
|
.493
|
|
Linear-by-Linear Association
|
1.706
|
1
|
.191
|
|
N of Valid Cases
|
100
|
|
|
The P value of the test comes to .472 which is higher than 0.05, so the null hypothesis is accepted that “There is no significant relationship between income and frequently buying at Pantaloons”
2.H0:There is no significant relationship between gender and respondents loyal to specific brand
H1: There is significant relationship between gender and respondents loyal to specific brand
|
Table 2 : Chi Square – Gender & Loyalty
|
|
|
Value
|
df
|
Asymp. Sig. (2-sided)
|
Exact Sig. (2-sided)
|
Exact Sig. (1-sided)
|
|
Pearson Chi-Square
|
.334a
|
1
|
.564
|
|
|
|
Likelihood Ratio
|
.334
|
1
|
.564
|
|
|
|
Linear-by-Linear Association
|
.330
|
1
|
.566
|
|
|
|
N of Valid Cases
|
100
|
|
|
|
|
The P value of the test comes to .564 which is higher than 0.05, so the null hypothesis is accepted that “There is no significant relationship between gender and respondents loyal to specific brand”
- H0: There is no significant relationship between occupation and belief that loyalty is beneficial H1: There is significant relationship between occupation and belief that loyalty is beneficial
|
Table 3 : Chi Square – Occupation & loyalty
|
|
|
Value
|
df
|
Asymp. Sig. (2-sided)
|
|
Pearson Chi-Square
|
6.507a
|
8
|
.591
|
|
Likelihood Ratio
|
5.793
|
8
|
.670
|
|
Linear-by-Linear Association
|
.478
|
1
|
.489
|
|
N of Valid Cases
|
100
|
|
|
The P value of the test comes to .591 which is higher than 0.05, so the null hypothesis is accepted that “There is no significant relationship between occupation and belief that loyalty is beneficial.”
- H0: There is no significant relationship between age and useful feature of green card
H1: There is significant relationship between age and useful feature of green card
|
Table 4 : Chi Square – Age & feature of green card
|
|
|
Value
|
df
|
Asymp. Sig. (2-sided)
|
|
Pearson Chi-Square
|
22.514a
|
16
|
.127
|
|
Likelihood Ratio
|
24.504
|
16
|
.079
|
|
Linear-by-Linear Association
|
3.275
|
1
|
.070
|
|
N of Valid Cases
|
100
|
|
|
The P value of the test comes to .127 which is higher than 0.05, so the null hypothesis is accepted that “There is no significant relationship between age and useful feature of green card”
TOOL - FACTORIAL ANALYSIS:
KMO AND BARTLETT'S TEST:-
|
Table 5 : KMO & Bartlett’s Test
|
|
Kaiser-Meyer-Olkin Measure of Sampling Adequacy.
|
.826
|
|
Bartlett's Test of Sphericity
|
Approx. Chi-Square
|
641.597
|
|
df
|
105
|
|
Sig.
|
.000
|
[I] KMO test shows possibility that if factorial analysis can be run or not. If the value of test comes greater than 0.6 factorial analysis can be performed. In this test the value of KMO test comes to 0.826 which is higher than 0.6, so factorial analysis can be performed.
[II] Bartlett’s test tells that sample is sufficient enough to perform factorial analysis.
RELIABILITY TEST:-
|
Table 6 : Reliability
|
|
Cronbach's Alpha
|
Cronbach's Alpha Based on Standardized Items
|
N of Items
|
|
.874
|
.873
|
15
|
The value of cronbach’s alpha should be equal or more than 0.6 then it could be said reliable.The cronbach’s alpha comes to 0.874 while Cronbach's Alpha Based on Standardized Items to 0.873 which indicates that the test scale is reliable.
TOTAL VARIANCE EXPLAINED:
|
Table 7 : Total Variance Explained
|
|
Component
|
Initial Eigenvalues
|
Extraction Sums of Squared Loadings
|
Rotation Sums of Squared Loadings
|
|
Total
|
% of Variance
|
Cumulative %
|
Total
|
% of Variance
|
Cumulative %
|
Total
|
% of Variance
|
Cumulative %
|
|
1
|
5.878
|
39.189
|
39.189
|
5.878
|
39.189
|
39.189
|
2.950
|
19.665
|
19.665
|
|
2
|
1.516
|
10.105
|
49.294
|
1.516
|
10.105
|
49.294
|
2.887
|
19.245
|
38.910
|
|
3
|
1.250
|
8.330
|
57.624
|
1.250
|
8.330
|
57.624
|
2.564
|
17.092
|
56.002
|
|
4
|
1.074
|
7.157
|
64.782
|
1.074
|
7.157
|
64.782
|
1.317
|
8.780
|
64.782
|
|
5
|
.937
|
6.249
|
71.031
|
|
|
|
|
|
|
|
6
|
.719
|
4.793
|
75.824
|
|
|
|
|
|
|
|
7
|
.658
|
4.385
|
80.209
|
|
|
|
|
|
|
|
8
|
.551
|
3.673
|
83.882
|
|
|
|
|
|
|
|
9
|
.524
|
3.491
|
87.373
|
|
|
|
|
|
|
|
10
|
.461
|
3.072
|
90.444
|
|
|
|
|
|
|
|
11
|
.419
|
2.794
|
93.239
|
|
|
|
|
|
|
|
12
|
.343
|
2.290
|
95.529
|
|
|
|
|
|
|
|
13
|
.292
|
1.948
|
97.476
|
|
|
|
|
|
|
|
14
|
.226
|
1.506
|
98.983
|
|
|
|
|
|
|
|
15
|
.153
|
1.017
|
100.000
|
|
|
|
|
|
|
|
Extraction Method: Principal Component Analysis.
|
The above table shows the variances explained. Total number of factors are considered on the basis of Eigen value. If eigen values are 1 or more than one those number of factors are considered. Here we have 4 component whose eigen value are 1 or more than one. Thus we will have only four factors. The total variance explained by this four factors is 64.782%.
ROTATED COMPONENT MATRIX
|
Table 8: Rotated Component matrix
|
|
|
Component
|
|
1
|
2
|
3
|
4
|
|
Exchange_policies
|
.776
|
|
.214
|
|
|
End_of_season_sale
|
.732
|
.145
|
.382
|
-.111
|
|
affordable_price
|
.722
|
.247
|
|
.257
|
|
Discounts_and_freebees
|
.563
|
|
.466
|
|
|
More_brands
|
.553
|
.540
|
.225
|
-.153
|
|
proximity
|
.237
|
.756
|
|
|
|
Assistance_by_employees
|
|
.700
|
.281
|
.102
|
|
sizes_available
|
.438
|
.667
|
.202
|
-.173
|
|
Ambience
|
.255
|
.484
|
.410
|
|
|
Presentation_of_articles
|
.127
|
.318
|
.802
|
|
|
good_services
|
.355
|
.142
|
.737
|
|
|
Durability_of_articles
|
.118
|
.516
|
.544
|
.288
|
|
Collection_of_clothes
|
.408
|
.382
|
.420
|
-.185
|
|
Switching_barriers
|
.153
|
-.242
|
.303
|
.730
|
|
Emotions_with_store
|
|
.406
|
-.238
|
.713
|
Extraction Method: Principal Component Analysis.
Rotation Method: Varimax with Kaiser Normalization.
|
The above table explains the reduction of factors into one factor depending upon its correlation with each other.
NEW FACTORS NOMENCLATURE
|
NO.
|
FACTORIAL GROUP
|
CRONBACH ALPHA (α)
|
|
1
|
Offerings and attractions
|
0.810
|
|
2
|
Location and ambience
|
0.768
|
|
3
|
Articles and its presentation
|
0.793
|
|
4
|
Attachment with the store
|
0.275
|
The above table shows four main factors which have major impact on customers to purchase products from Pantaloons.
FINDINGS:
In research it was found out that the females were 49% and the male was 51%, which represent almost 1:1 ratio. It was also noticed that the 43% of respondents were youngsters, and they were falling under 18-24 age group. The majority of respondents were unmarried and as far as occupation is concerned students were highest. Thirty five per cent respondents were having income less than 3 lacks per annum. 2/5 of respondents prefer to come on monthly basis. Quality and the offers is the thing which influences the customers most. If comes to loyalty, 54 percent respondents considers themselves as loyal to any specific brand, while 58% respondents thinks that loyalty towards a particular brand is always beneficial. Forty out of hundred respondents thinks that because of seasonal sales pantaloons is successful in retaining the customers comparing to others. As far as green card is concerned priority in sales and separate billing counters are most likely features. Research disclosed that 38% of the respondents were satisfied while 40% were extremely satisfied.
CONCLUSION:
Pantaloons fashion and retail Ltd is a company where it strives for lifestyle and value through its products and services. Through the study, it is observed that pantaloons can be said an organization where the P’s of marketing is taken seriously for the maximum profitability through large range of products, promotional activities for the company through newspapers , magazines , internet ,banners and posters and a solid sales organization monitoring that the P’s are worked effectively. The store has been well maintained in accordance with the latest demands of the consumers and through all these strategies Pantaloons ensures repeated customer patronage. As far as the loyalty of customers is concerned we can say that the main factors plays important role is the quality of articles and the various discounts. The majority of persons were having income less than 3 lacks per year. The highest number was of students and there were respondents mostly aged Between 18 to 24. They also described their feelings that they like what the brand stands for and it makes them feel good buying from the store. At last we saw that around ¾ of customers were satisfied by pantaloons experience. So, loyalty is said to be the most important thing for a retailer to retain their customers. But there are many efforts to be made to do so. After all loyalty is not a one day process it is continuous and long term process. By providing good quality and experience to the customers a business can surely enjoy the benefits of loyalty.
BIBLIOGRAPHY:
- Aaker, D.A. (1991). Managing Brand Equity: Capitalizing on the Value of a Brand Name, The Free Press, New York.
- Assael, H (1992). Consumer Behavior and Marketing Action. 4th Edition. PWS-Kent
- Dick, A. & Basu, K. (1994). Customer Loyalty: Toward an Integrated Conceptual Framework. Journal of the Academy of Marketing Science, 22(2), 99-113.
- Payne, A. (1994). Relationship marketing–making the customer count. Managing Service Quality, 4(6), 29-31.
- Mellens, M., Dekimpe, M., & Steenkamp, J. (1996). A Review of Brand-Loyalty Measures in Marketing. Tijdschrift voor Econoniie en Management, 41(4), 507-533.
- Gremler, D. D., & Brown, S. W. (1999). Customer loyalty, consumer satisfaction. International Journal of Service Industry Management, 10(3), 271-294.
- Oliver, R. L. (1999). Whence consumer loyalty? Journal of Marketing, 63(5), 33-44.
- Wulf, K. D., Odekerken-Schröder, G., & Iacobucci, D. (2001). Investments in consumer relationships: a cross-country and cross-industry exploration. Journal of marketing, 65(4), 33-50.
- Aydin, S., & Özer, G. (2005). The analysis of antecedents of customer loyalty in the Turkish mobile telecommunication market. European Journal of Marketing, 39(7/8), 910-925.

