A Refereed Monthly International Journal of Management
Cost Efficiency of Top 10 Firms in India: A DEA Approach
Author
|
SILAMBARASAN & Dr. R. AZHAGAIAH
Ph.D Research Scholar Ph.D. Supervisor
Department of Commerce
Kanchi Mamunivar Centre for Postgraduate Studies (Autonomous – Term-II)
(Autonomous Centre with Potential for Excellence by UGC – Phase-II)
[Re-accredited with “A” Grade by NAAC]
(Government of Puducherry)
Puducherry-605 008, India
|
Abstract
The study investigates the cost efficiency of top 10 firms in India based on secondary data over the period from 2006 to 2015. The study has chosen firms viz. Tata consultancy services, Reliance industries, HDFC Bank, Infosys, ITC, SUN Pharma, Coal India, ONGC, HDFC Corporation and SBI as sample units. Descriptive statistics, data envelopment analysis (DEA), constant returns to scale (CRS) and variable returns to scale (VRS) models for efficiency are used for analysis. The study proves that there is an acceptable overall level of efficiency during the testing period, with an average CRS efficiency ranging from 0.93 to 1 and VRS efficiency ranging from 0.76 to 1. The results showed that reduced investment in equity, and net worth followed by more loans and advance creation are the most effective strategies for improving the cost efficiency of inefficient firms.
Key words: Data envelopment analysis, non-parametric technique, Top 10 Firms, Cost efficiency.
JEL: H21, D61.
Introduction
Cost efficiency refers to a firm’s minimization of costs reflected by how close its cost is to what a best-practice a firm would be for producing the same amount of outputs which are sold at certain prices with the given prices of inputs. However, allocative efficiency, on the other hand, measures the ability of a decision making unit (DMU) to avoid waste by producing a level of output at the minimal possible cost (ability to combine inputs and outputs in optimal proportions in the light of prevailing prices).
Further, technical efficiency can be investigated and decomposed into pure technical efficiency and scale efficiency. The pure technical efficiency measures the proportional reduction in inputs that could be achieved if the firm operated on the variable returns to scale (VRS) frontier. If the firm is able to achieve this, then further input reductions could be achieved by operating on the constant returns to scale (CRS) frontier. Whereas, scale efficiency (Webster et al. 1988) can produce a firm’s current level of output with fewer inputs assuming CRS (the measure of the ability to avoid waste by operating on the most productive scale).
Review of Literature
Donsyah (2004), in a study titled “Efficiency in Islamic banking: An empirical analysis of eighteen banks” used secondary data of 18 Islamic banks during the period from 1997 to 2000. The data were analyzed applying technical, pure technical, and scale efficiency approaches through data envelopment analysis (DEA). The study used input prices, which consist of staff costs, fixed assets cost while the output variables comprise loans, income and liquid assets. The overall efficiency results suggested that inefficiency across 18 Islamic banks was low at just over 10%. Further, the study showed that there were diseconomies of scale for small-to-medium Islamic banks, which suggests that the mergers and acquisitions should be encouraged.
Jarrah (2007), in a study titled “The use of DEA in measuring efficiency in Arabian banking” used data envelopment analysis (DEA) approach to investigate cost efficiency levels of banks operating in Jordan, Egypt, Saudi Arabia and Bahram with 82 banking firms during the period from 1992 to 2000. The estimated cost efficiency is further decomposed into technical and allocative efficiency in terms of both the variables (total cost, price of funds, price of labor, price of physical capital, total aggregate loans, total aggregate other earnings assets, off-balance sheet activities, price of loans, price of other earning assets and price of off-balance sheet items) and constant returns to scale (CRS). The study used linear programming DEA approach for measuring cost efficiency. The results suggested that the same level of output could be produced with approximately 50-70% of their current inputs if banks under the study were operating on the most efficient frontier. This level of inefficiency was more than the range of 10-15% for the 130 studies surveyed by Berger and Humphrey (1997) and Berger and De Young (1997). However, the level was more than the level of inefficiency found in the European studies including Carbo et al. (2000). The findings, for a sample banks from twelve countries, showed mean cost in-efficiency of around 22% for the period from 1989 to 1996.
Karimzadeh (2012), in a study titled “Efficiency analysis by using data envelopment analysis model: Evidence from Indian banks” examined the efficiency of Indian commercial banks during the period from 2000 to 2010 using data envelopment analysis (DEA) based on a sample of eight commercial banks. The study used non-parametric approach viz. data envelopment analysis to estimate technical and economic efficiency of Indian commercial banks considering the selected input and output variables. The input variables comprise fixed assets, deposits, and number of employees while output variables viz. loans and investment are used for analysis. The study showed that the mean cost (economic) efficiency, technical efficiency, and allocative efficiency were 0.991, 0.995, and 0.991 respectively in variable returns to scale (VRS) model and that of for the constant returns to scale (CRS) model were 0.936, 0.969, and 0.958 respectively. The study suggested technological orientation to reduce the level of non-performing assets (NPAs) and expand the possibilities for augmenting financial activities in order to improve profit efficiency in near future.
Stavarek and Repkova (2012), in a study titled “Efficiency in the Czech Banking industry: A non-parametric approach” used data envelopment analysis (DEA) to study efficiency levels of Czech banks during the period from 2001 to 2010. The data used in the study was collected from the annual reports of commercial banks. The study used two basic DEA models viz. Charnes, Cooper and Rhodes (CCR) (1978), and Banker, Charnes, Rhodes (BCR) (1984). The average efficiency scores indicated a trivial increase in the weighted average point, which deteriorated the average efficiency. Most of the average efficiency scores showed negative effect of financial crisis on the efficiency, particularly during the years 2009 and 2010.
Almumani (2013), in a study titled “The relative efficiency of Saudi Banks: Data envelopment analysis models” analyzed efficiency of banks in Saudi Arabia using a non-parametric frontier approach of two basic data envelopment analysis (DEA) models viz. Charnes-Cooper-Rhodes (CCR) and Banker Cooper-Rhodes (BCR). The study was based on relative efficiency of 10 Saudi banks over the period from 2007 to 2011. The results of the study showed that the Saudi banks efficiently managed their financial resources during the study period 2007-2011 and the mean efficiency was 95.52% and 98.55% respectively for CCR and BCR approaches.
Singh and Gupta (2013), in a study titled “Measuring technical efficiency of Indian banking sector in post subprime crises scenario: A non-parametric frontier based” compared the technical efficiency of top 15 Indian banks during the period from 2007 to 2011 using data envelopment analysis (DEA). The period characterized by far reaching experience of sub-prime crises (2008-2009) and its impact on Indian banking sector. The study showed that the levels of input variables (advances and investment) and output variables (operating costs, fixed assets and capital) in efficiency measurement have changed significantly and the banks have improved their efficiency over the period of study. The results showed that there was still a room for the improvement for those banks, which have not achieved the desired efficient frontier.
Purwanto et al. (2014), in a study titled “Efficiency of small and medium sized enterprises (SME) in Salatiga using data envelopment analysis (DEA)” analyzed the cost efficiency of 66 Tofu SMEs in Salatiga during the period 2013 using constant returns to scale (CRS) and variable returns to scale (VRS) models. The study showed that two SMEs were efficient in overall, four SMEs were efficient in scale, eight SMEs were technically efficient and 23 SMEs were inefficient over the study period. The SMEs, which were inefficient, could refer the efficient SMEs to improve their efficiency either by lessening input factors or maximizing output factors at the given level of input factors.
- Objectives
- To analyze the cost efficiency of top 10 firms of India in respect of constant returns to scale.
- To analyze the cost efficiency of top 10 firms of India in respect of variable returns to scale.
- Hypotheses of the Study
H01: “There is no significant difference in the cost efficiency of top 10 firms of India in respect
of constant returns to scale”.
H02: “There is no significant difference in the cost efficiency of top 10 firms of India in respect
of variable returns to scale”.
- Research Methodology
The study is based on secondary data which are collected from the www.moneycontrol.com, and academic research journals.
- Sampling Design
The present study has chosen, based on market capitalization*, top10 firms in India, which are listed in (BSE) Bombay Stock Exchange for the period from 2006 to 2015.
The selected sample of top 10 firms in India is presented in table 1.
Table 1
List of Top 10 Firms Selected for the Study based on Market Capitalization
|
Sl. No.
|
Firm Name
|
|
1
|
Tata consultancy services
|
|
2
|
Reliance industries
|
|
3
|
HDFC Bank
|
|
4
|
Infosys
|
|
5
|
ITC
|
|
6
|
SUN Pharma
|
|
7
|
Coal India
|
|
8
|
ONGC
|
|
9
|
HDFC Corp.
|
|
10
|
SBI
|
Source: Compiled data collected from Economic Times of India.
- Research Methods
The study used descriptive statistics viz. mean, standard deviation, and cost efficiency index using data envelopment analysis (DEA), allocative and technical efficiency models.
7.1 Data Envelopment Analysis Approach (DEA)
Data envelopment analysis (DEA) is a linear programming technique used for examining how far a particular decision making unit (DMU) operates relative to the top 10 firms India. The technique creates a frontier set by efficient firms and compares it with the inefficient firms to produce efficiency scores. Further, the DMU can be used for various units, such as banks, hospitals, retail stores, and whatever unit which has the similarity to the cost operational characteristics.
However, comparison between input and output will result into one efficiency value. According to DEA method, the efficiency constitutes a relative value instead of absolute value achieved by a unit. The DMU with the best performance will reach 100% efficiency. However, the DMUs with below this value will have varying efficiency i. e. 0 - 100%. Furthermore, the firms are bordered scores between zero and one, with completely efficient firms having an efficiency score of one. In the DEA, the most efficient firms (with score of one) don’t necessarily generate maximum level of output from the given inputs. Rather, the firms generate best practice of output among the others in the sample.
7.2 Allocative and Technical Efficiency
The cost efficiency can be decomposed into technical and allocative efficiency. Technical efficiency is an event when an increase in any output requires a reduction in at least one other output or an increase in at least one input, and if a reduction in any input requires an increase in at least one other input or a reduction in at least one output (Koopmans, 1951).
Allocative efficiency, on the other hand, measures the ability of a decision making unit (DMU) to avoid waste by producing a level of output at the minimal possible cost (the ability to combine inputs and outputs in optimal proportions in the light of prevailing prices).
Technical efficiency can be investigated further and decomposed into pure technical efficiency and scale efficiency. Pure technical efficiency measures the proportional reduction in inputs that could be achieved if the firm operated on the variable returns to scale frontier on the other hand, scale efficiency arises where the firm can produce its current level of output with fewer inputs assuming constant return to scale (the measure of the ability to avoid waste by operating on the most productive scale) (Webster et al., 1998).
7.3 Pure Technical Efficiency
Banker et al. (1984) added to the CRS assumption and introduced BCC model. The BBC model is characterized by variable returns to scale. This model provides the pure technical efficiency measurement of the DMU. The pure technical efficiency makes proportional reduction in inputs that could be achieved if the firm operated on the variable returns to scale frontier.
7.4 Scale Efficiency
Scale efficiency emerges where the firm can produce its current level of output with fewer inputs assuming constant returns to scale.
S = CRS / VRS
Where 0 S 1 since CR VR, if the value of S equals 1, the firm is scale efficient and all values less than 1 reflect scale in-efficiency. If scale in-efficiency exists (S < 1), the source of in-efficiency is the result of operating at either increasing (N < I) or decreasing (NI = VR) returns to scale.
7.5 Returns to Scale
The returns to scale and economies of scale are related but different terms that describe what happens as the scale of production increases in the long-run. The term returns to scale arises in the context of a firm’s production function.
The returns to scale are set of three interrelated and sequential laws: Law of increasing returns to scale, law of constant returns to scale, and law of diminishing returns to scale. If output increases by that same proportional change as all inputs change then there are constant returns to scale (CRS). If output increases by less than that proportional change in inputs, there are diminishing returns to scale (DRS). And if a firm’s production function could exhibit different types of returns to scale in different ranges of output, then there are increasing returns to scale (IRS). .
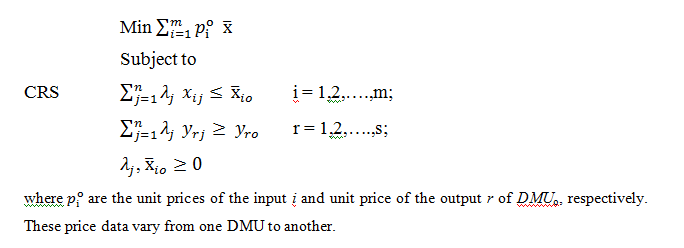
7.6 Constant Returns to Scale DEA Model
Charnes et al. (1978) developed an estimable model that had an input orientation assuming constants returns to scale (CRS). Further, a constant return to scale is a production function, which exhibits constant returns to scale i. e. changing all inputs by a factor has the effect of increasing outputs by that factor.
Efficiency measures derived using DEA are based on maximizing the ratio of all output overall the inputs. Assuming a data set that includes K (K = 1,…, K ), M outputs (m = 1,…, M ) for N firms (j = 1,…, N). Then for the ith observation, the set of input and output can be represented by the column of input vector xi and the column of output vector Yi and the set of inputs and outputs for the ith X = [K*N], and the output matrix Y = [M*N] represent the data for all N firms. The optimal weights are obtained by solving the mathematical programming problem:
maxu,v(u´yi / u´xi),
s.t. u´yj / u´xj 1, j = 1,2,…., N,
u, v 0.
The aim is to obtain a measure of efficiency (the ratio of all outputs over all inputs) such as u´yi / u´xi is maximized, where u is a vector of output weights [M*1], and v is a vector of input weights [K*1]. The inequality equation requires that the weights are positive. The DEA selects the weights that maximize each firm’s productive efficiency score as long as no weight is negative and the weights are universal.
7.7 Variable Returns to Scale DEA Model
Charnes et al. (1984) suggested an extension to the CRS model to account for variable returns to scale (VRS) when not all firms are operating at an optimal scale. If calculated technical efficiency (CRS) is different from the technical efficiency (VRS), then this indicates that the firm has scale in-efficiency. Therefore, the use of the VRS specification permits the calculation of technical efficiency splitting the scale efficiency (decomposing technical efficiency into pure technical and scale efficiency).
In this regard, the DEA excel solver (Zhu, 2002) is used to solve the following models:
7.9 Slack Variable
In an optimization problem, a slack variable is a variable that is added to an inequality constraint to transform it to equality. Introducing a slack variable replaces an inequality constraint with an equality constraint and a non-negative constraint.
Based on the inputs and outputs used in the previous studies as well as the data availability, the input variables used are total assets, total equity and total net worth while the output variables used are total income and loans and advances.
Table 2
List of Variables Used for the Study
|
Sl. No.
|
Input Variables
|
Output Variables
|
|
1
|
X1= Total Assets
|
Y1=Total Income
|
|
2
|
X2= Total Equity
|
Y2=Loans and Advances
|
|
3
|
X3=Total Net worth
|
Source: Computed results based on compiled data collected from www.moneycontrol.com.
- Analysis and Discussion
Table 3
Descriptive Statistic for Inputs and Outputs of Cost Efficiency
|
Input / Output
|
Variables
|
Min
|
Max
|
Mean
|
S.D
|
|
Inputs
|
X1
|
54259.41
|
11765637.80
|
1941077.76
|
3568417.94
|
|
X2
|
1018.05
|
63163.6
|
14481.02
|
20089.64
|
|
X3
|
48746.86
|
1331284
|
430756.1
|
427883.9
|
|
Outputs
|
Y1
|
24611.71
|
2374999
|
533035.7
|
717556.7
|
|
Y2
|
0
|
1633765
|
380526.4
|
585532.1
|
Source: Computed results based on compiled data collected from www.moneycontrol.com.
Note: X1= Total Assets, X2= Total Equity, X3=Total Net worth, Y1=Total Income, Y2=Loans & Advances.
The descriptive statistics of input and output of selected firms are presented in table 2. The table reveals that the input variables viz. total assets (X1), total equity(X2), and total net worth (X3), ranges from 54259.41 to 11765637.80, 1018.05 to 63163.6, and 48746.86 to 1331284 with mean of 1941077.76, 14481.02, and 430756.1 respectively for X1, X2 and X3. However, the standard deviation records about 3568417.94, 20089.64, and 427883.9 respectively for X1, X2 and X3. The output variables viz. total income (Y1), and loans & advances (Y1) ranges from 24611.71 to 2374999 and from 0 to 1633765 with mean of 533035.7 and 380526.4 and standard deviation of 717556.7 and 585532.1 respectively for Y1 and Y2.
Table 4
Average Efficiency of Top 10 Firms in India during the Period from 2006 to 2015
|
Decision Making Unit
No.
|
Name of Firms
|
CRS Efficiency
|
VRS Efficiency
|
Scale Efficiency
|
Efficiency
RTS
|
|
1
|
Tata Consultancy Services
|
1.00
|
1.00
|
1.00
|
Constant
|
|
2
|
Reliance Industries
|
1.00
|
1.00
|
1.00
|
Constant
|
|
3
|
HDFC Bank
|
1.00
|
1.00
|
1.00
|
Constant
|
|
4
|
Infosys
|
0.68
|
0.68
|
1.00
|
Increasing
|
|
5
|
ITC
|
0.15
|
0.36
|
0.43
|
Increasing
|
|
6
|
SUN Pharma
|
0.93
|
1.00
|
0.93
|
Increasing
|
|
7
|
Coal India
|
0.66
|
0.76
|
0.87
|
Increasing
|
|
8
|
ONGC
|
0.65
|
0.79
|
0.82
|
Decreasing
|
|
9
|
HDFC Corporation
|
1.00
|
1.00
|
1.00
|
Constant
|
|
10
|
SBI
|
0.82
|
1.00
|
0.82
|
Decreasing
|
Source: Computed results based on compiled data collected from www.moneycontrol.com.
Note: CRS - Constant Returns to Scale, RTS – Returns to Scale.
The results of the average efficiency of CRS, VRS and Scale efficiency of selected firms for the period from 2006 to 2015 are shown in table 3. The average of CRS, VRS, and Scale efficiency scores of Tata consultancy services, Reliance industries, HDFC Bank, and HDFC Corporation are 1, which indicates that they are at an optimal level of efficiency, however for Infosys, ITC, Coal India, ONGC and SBI it shows in-efficient.
The results of the CRS model slack variable analysis of input slacks and output slacks for the period from 2010 to 2015 are presented in table 4. The firms viz. Infosys, ITC, Coal India and ONGC exhibit an excess of 865.36, 778.83, 41310.35 and 16875.24 respectively in X1 Total Equity and 634.66, 10923.31, 55885.52 and 166376.39 respectively in X2, however with a shortage of 12065.11, 5809.46 and 196376.34 respectively for Y2 (loans and advances) for SUN Pharma and SBI. The use of DEA-CRS and DEA-VRS with an output-oriented assumption allows estimating the target for measuring and explaining the determinants of each firm’s cost efficiency.
Table 5
Slack Variable Analysis for Top 10 Firms in India for the Period from 2006 to 2015
|
Decision Making Unit
No.
|
Name of Firm
|
Input Slacks
|
Output Slacks
|
|
X1
Total Assets
|
X2
Total Equity
|
X3
Total Net worth
|
Y1
Total Income
|
Y2
Loans and Advances
|
|
1
|
Tata consult. services
|
0
|
0
|
0
|
0
|
0
|
|
2
|
Reliance industries
|
0
|
0
|
0
|
0
|
0
|
|
3
|
HDFC Bank
|
0
|
0
|
0
|
0
|
0
|
|
4
|
Infosys
|
0
|
865.36
|
634.66
|
0
|
12065.11
|
|
5
|
ITC
|
0
|
778.83
|
10923.31
|
0
|
0
|
|
6
|
SUN Pharma
|
0
|
496.02
|
0
|
0
|
5809.46
|
|
7
|
Coal India
|
0
|
41310.35
|
55885.52
|
0
|
0
|
|
8
|
ONGC
|
0
|
16875.24
|
166376.39
|
0
|
0
|
|
9
|
HDFC Corp.
|
0
|
0
|
0
|
0
|
0
|
|
10
|
SBI
|
9065857.87
|
0
|
0
|
0
|
196376.34
|
Source: Computed results based on compiled data collected from www.moneycontrol.com.
- Summary of Findings
The firms surveyed, using the DEA approach, have an achieved level of efficiency. The average of CRS, VRS, and Scale efficiency scores of Tata consultancy services, Reliance industries, HDFC Bank, SUN Pharma and HDFC Corporation reached 1, which indicates that they are at an optimal level of efficiency, however firms viz. Infosys, ITC, Coal India and ONGC are in-efficient although their average CRS, VRS, and scale efficiency are close to 1. The results, from the study, suggest that in-efficient firms need improvement. For instance, the Infosys, ITC, Coal India and ONGC show, an excess of 865.36, 778.83, 41310.35 and 16875.24 respectively in total equity and 634.66, 10923.31, 55885.52 and 166376.39 respectively for net worth, however the firms viz. Infosys, SUN Pharma and SBI are with a shortage of 12065.11, 5809.46 and 196376.34 respectively in loans and advances.
- Conclusion
The results derived from the DEA approach shows that (CRS, VRS, and Scale efficiency) Tata consultancy services, Reliance industries, HDFC Bank, and HDFC Corporation have achieved 100% efficiency during the study period, which indicates that they are at an optimal level of efficiency, however firms viz. Infosys, ITC, Coal India, ONGC and SBI are in-efficient. Hence, based on the results, the study rejects Ho1 and Ho2, i. e. no significant difference in the cost efficiency of top 10 firms of India in respect of constant returns to scale and variable returns to scale. The slack variable analysis indentified possible ways to improve the performance of those in-efficient firms. However, the results further showed that reduced investment in equity, and net worth followed by more loans and advance creation are the most effective methods for improving the operational performance of in-efficient firms.
- Limitations and Scope for Further Studies
- In the present study, a sample of top 10 firms has been considered for analysis. In future, researchers can consider inclusion of more number of firms by referring to the other data sources.
- In the present study, descriptive statistics, data envelopment analysis, constant returns to scale (CRS) and variable returns to scale (VRS) models are only used for analysis.
Note:*Market Capitalization: Market capitalization represents the aggregate value of a firm or stock. It is obtained by multiplying the number of equity shares outstanding by their current market price per share. It is used by the investment community in ranking the size of firms, as opposed to sales or total asset figures. It is also used in ranking the relative size of stock exchanges, being a measure of the sum of the market capitalizations of all firms listed on each stock exchange.
References
Almumani, M. A. 2013. The relative efficiency of Saudi Banks: Data envelopment analysis models. International Journal of Academic Research in Accounting, Finance and Management Sciences 3(3): 152-61.
Donsyah, Y. 2004. Efficiency in Islamic banking: An empirical analysis of eighteen banks. Islamic Economic Studies 12(1): 01-19.
Jarrah, I. M. 2007. The use of DEA in measuring efficiency in Arabian banking. Banks and Bank Systems 2(4): 21-30.
Karimzadeh, M. 2012. Efficiency analysis by using data envelopment analysis model: Evidence from Indian banks. International Journal of Latest Trends in Finance and Economic Sciences 2(3): 228-37.
Purwanto, N., D. Manongga, and M. A. Ineke Pakereng. 2014. Efficiency of small and medium sized tofu enterprises (SME) in Salatiga using data envelopment analysis (DEA). International Journal of Computer Applications 91(12): 44-50.
Singh, P, K., and V. K. Gupta. 2013. Measuring technical efficiency of Indian banking sector in post subprime crises scenario: A non-parametric frontier based. European Journal of Business and Management 5(5): 87-99.
Stavarek, D., and I. Repkova. 2012. Efficiency in the Czech banking industry: A non-parametric approach. ACTA Universitatis Agriculturae ET Silviculturae Mendelianae Brunensis Journal 60(2): 357-66.

