A Refereed Monthly International Journal of Management
A STUDY ON THE FACTORS AFFECTING THE QUALITY OF WORK LIFE BALANCE AMONGST EMPLOYEES:
BASED ON INDIAN IT SECTOR
AUTHORS
|
Archita Banerjee1,
Assistant Professor
Institute of Management Study
archita.banerjee@rediffmail.com
+91 9051627827
Rahul Kumar Ghosh2
Research Scholar
Seacom Skills University
rahulghosh.0101@Gmail.Com
+91 9163029676
|
Abstract
In today’s competitive era when both male and female are working together,
they share job roles and responsibilities, acknowledgements, credibility along with
that they have to share the mental stress in their own domains. Research studies
have yielded results that high level of attrition especially in service sectors
is because of job dissatisfaction and failing of commitments both in work and family
life by either of the genders. Factors which act in motivating employees, the strategies
which the organizations develop to make them feel attracted towards their job are
a reflection of job satisfaction. The study revolves around the intrinsic and extrinsic
factors of Herzberg Motivation - Hygiene Theory. It tries to find a cause behind
work-family conflict and the necessary steps which could be taken to bridge the
gap.
Keywords – Job satisfaction, Work - Family conflict, mental
stress, strategies, Herzberg Motivation – Hygiene, Quality of Work Life Balance
(QWLB)
Introduction
As per (Teck-Hong, Waheed 2011) in the Herzberg Motivation - Hygiene Theory, various
factors like compensation, recognition, working policy, achievement, responsibilities,
growth etc. affect employee’s motivation. Out of many issues under working
policy the factor which is primarily affecting the morale of employees’ working
and state of remaining with the organization is called “Quality of Work
Life Balance”.
It has been observed in certain organizations the financial institution like banks,
increasing the transaction hours to fulfill customer satisfaction actually had an
adverse effect on employees’ both physically and mentally leading to fall
in work progress. Consequences were remarkably high on employees’ who were
directly involved in finance related services. This situation led the employers
to think on Quality of Work Life.
The service sectors add a lot to the Gross Domestic Product (GDP). Consequently,
several studies have pointed out that work life balance issues are more dominant
in the sectors specifically Call Centre employees, Information Technology professionals,
Bank employees, University Academicians or Administrative staffs, Doctors and others.
The study on these sectors projected results pointing towards Call Centre and Information
Technology professionals had more work life balance issues compared to others. The
reason behind was because of working hours, job insecurity, insufficient leave arrangement,
job stress etc.
Meaning of Quality Work Life Balance – It is the quality
of the comfort ability of the rapport between employees and their total working
conditions with human dimensions added to the provision of services. In a quality
of work life, the quality of life of a person or group depending on their standard
of living, public health, safety and general surrounding, whereas, quality work
life describes the factors that affect their life such as salary and other benefits.
It also indicates for a noble supervision, appropriate working environments, and
decent remuneration package including a stimulating, inspiring and worthwhile job
profile.
Significance of Quality of Work Life
- The philosophy of attaining high quality work life is through employee relations
that encourage organization for strategic efforts to provide opportunities to their
workers, so that they contribute in larger sums in their respective jobs by improving
their overall effectiveness in job performance.
- Willingness to come to work is a reflection of job satisfaction. According to (Locke
1976), he defined “job satisfaction as an emotional state of mind which is
a result of one‘s positive experience in his job.”
Literature Review
(Roelofsen 2002), study showed results by improving the working
environment reduced complaints and absenteeism with an increase in productivity.
As per (Wells 2000), workplace pleasure has been associated with
job satisfaction. Latest reports show, employees satisfaction on the job, is through
workplace conditions and environment. It is recognized as an important factor for
evaluating productivity of employees. Significantly true, for those employees who
spend entire day working on computers. With organizations using maximum computers
for increasing businesses an ergonomic designs for offices and plant installations
has become mandatory. The science of Ergonomics is also called biomechanics, and
it has become accepted because of demand of workers for more human comfort.
Some of the strategies adopted by companies specially the blue – chips, to
increase work – place balance and increase productivity and performance of
employee’s are –
Organizational Initiatives – As per (Singh 2013)
in a Strategic Human Resource Management (SHRM) survey it was found that top five
formal friendly initiatives are –
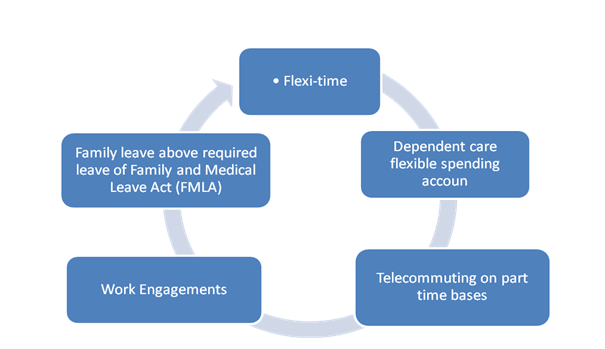
Figure 1: Organizational Initiatives
Source: Individual and Organizational Strategies to Balance Work-life
with Indian Way, (Singh 2013)
Supportive Work Culture – (Chawala, Sondhi 2011),
states, ‘Supportive’ organizations profile provide a link and (Rousseau
1995), stated that, a psychological contract between the Individual and Organizational
Strategies to Balance Work - life. This helps and enhances his work/non work conflict
and at the same time increases and individual’s sense of commitment.
Friendly Initiatives to Resolve Work-Life Conflicts – (Singh
2013), states that, friendly policies can benefit employers in retaining
highly skilled employees who might otherwise search for more cooperative employers
or leave the workforce entirely. Organizations with friendly policies decrease absenteeism,
increase productivity, and can improve employers’ attraction ability.
Few case studies based on Work Life Balance:
Case – I – Related to Work – Family Conflict
64.2 % of the population in European Union is in employment out of which 19.2% are
involved in part-time employment. This ratio trails over 20 years in Europe especially
evident in countries where flexible working, part –time employment policies
are on the rise.
Conventional theory of 8 hours of working is no longer in fashion with the emergence
of Information Technology, which ensures employee must be available for 24/7.
In 2009 research on working time developments was conducted throughout European
countries by The European foundation. An average population of EU agreed their weekly
working time was 38.7 hrs. but a contrary report by full time employees of 20 countries
out of 28 countries said they had long actual working hours.
Employees from Romania, Malta, Luxembourg and UK had the highest actual working
hours in comparison to Finland, Ireland, France and Italy which have the lowest
hours.
These parts of EU had prevalent issues of work-life balance. As per estimation more
than one-quarter of Europeans suffer from work-family conflict (FAMILY ISSUES
AND WORK-LIFE BALANCE)
Case – II – Related to Time Conflict
The survey was done taking in consideration both gender workers. The summary of
the report was female workers complained they had too little time to meet daily
household chores and male workers admitted they spent too much time at work.
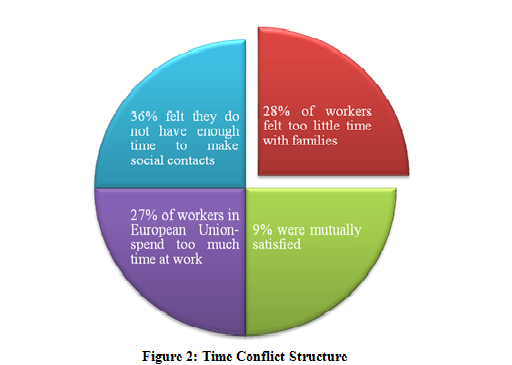
The figure above shows a composite picture of male and female genders and their
reaction towards time conflict between work and home.
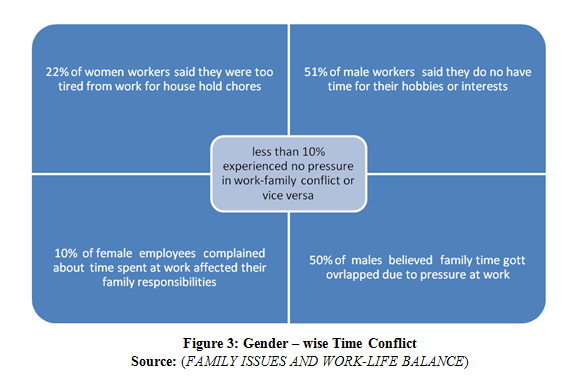
Case – III – Related to Health
Researchers have observed work –life conflict to be a source of innumerable
indicators of poor health and unhealthy life-style:-
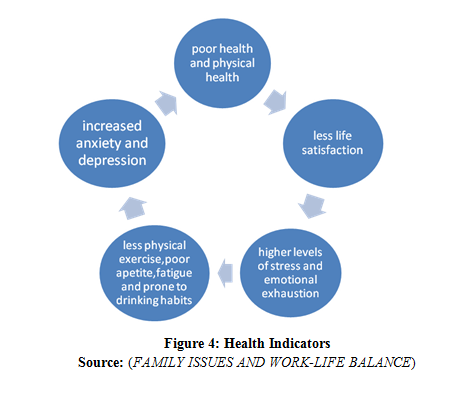
(Frone, Russell, Barnes 1996), conducted a study on understanding
the relationship of work-family conflict, family-work conflict based on health grounds.
The outcome irrespective of genders indicated an association with depression, poor
physical health and heavy alcohol usage. There is a negative relationship between
works –family of both directions with job-life satisfaction as per (Kossek,
Ozeki 1998).
Groups working under inopportune environment may end up with low performance and
face occupational health diseases like high absenteeism and turnover. In many organization
employees suffer working condition problems related to mental and physical factors.
According to (Pech, Slade 2006), employee disengagement increases
and it becomes more significant to make workplaces negatively influence. They focused
on indicators of disengagement which are distraction, lack of interest, poor decisions
and high absence, rather than the root causes. The physical environment at work
is the key root behind employee’s engagement or disengagement.
Research Objectives
This study encompasses on quality of work life balance and how does it have an impact
on work performance. To understand the issue we have taken few case studies of various
industries and have surveyed IT company employees especially as this service sector
faces most issues in work life balance.
SAMPLING
The questionnaire was given to 320 employees from whom 300 were found to be applicable
for analysis. Only the state of West Bengal was considered for the purpose of sampling.
Simple random sampling was used for the process. The simple random sample is meant
to be an unbiased representation of a group.
Primary Data Analysis
The primary data analysis to find out the significant factors which are affecting
Quality Life Work Balance of IT employees in West Bengal has been done using SPSS
21.0. The primary data analysis mainly focused at 1) Extracting the dimensions of
Quality Life Work Balance of IT employees. Initially, the Reliability Statistics
which is Cronbach's Alpha and the Kaiser-Meyer-Olkin (KMO) Measure of Sampling Adequacy
was done to find out the constancy of the data and to determine the degree of the
sample size accuracy respectively. Then, Factor Analysis (PCA) was done to extract
the possible factors of Quality Life Work Balance of IT employees. Finally, 1-sample
t-test is used to define whether a sample comes from a population with a particular
mean. The population mean is not known in this case, so it has been hypothesized
as µ = 3.
EMPIRICS
The demographics of the respondent were presented under the 3 attributes i.e. qualification,
gender and age. According to, Table – 1, the maximum 43.7 percent of the employees
are Post Graduate degree holders while 39.3 percent are Graduate degree holder and
the remaining 17.0 percent are Diploma holders. The analysis depicts that most of
the employees counting a total of 131 in numbers are Post Graduate degree holder
which means that the Post Graduate degree is quite common among the employees.
|
Table – 1
|
|
Education Level
|
|
|
Frequency
|
Percent
|
Valid Percent
|
Cumulative Percent
|
|
Valid
|
Graduate
|
118
|
39.3
|
39.3
|
39.3
|
|
Post Graduate
|
131
|
43.7
|
43.7
|
83.0
|
|
Diploma
|
51
|
17.0
|
17.0
|
100.0
|
|
Total
|
300
|
100.0
|
100.0
|
|
Table – 2, a maximum of 51.3 percent of the employees in the present study
are female employees and the residual 48.7 percent of the employees are male. It
depicts that the prevailing gender of the employees is female employees in the present
study.
|
Table – 2
|
|
Gender
|
|
|
Frequency
|
Percent
|
Valid Percent
|
Cumulative Percent
|
|
Valid
|
Male
|
146
|
48.7
|
48.7
|
48.7
|
|
Female
|
154
|
51.3
|
51.3
|
100.0
|
|
Total
|
300
|
100.0
|
100.0
|
|
According to Table – 3, the noteworthy age group among the employees is Above
29 as it is consisted of 22.0 percent of total sample size. The other important
age groups are Less Than 23 and 23 – 25, as a whole they are representing
42.7 percent of the total sample size. The other age groups which are 25 –
27 and 27 – 29 represents 17.0 and 18.3 percentage of the total sample size
respectively. The analysis reveals that the important age groups of the employees
are Above 29, Less Than 23 and 23 – 25 because as a whole they are representing
64.7 percentage of the total sample.
|
Table – 3
|
|
Age
|
|
|
Frequency
|
Percent
|
Valid Percent
|
Cumulative Percent
|
|
Valid
|
Less Than 23
|
63
|
21.0
|
21.0
|
21.0
|
|
23 - 25
|
65
|
21.7
|
21.7
|
42.7
|
|
25 - 27
|
51
|
17.0
|
17.0
|
59.7
|
|
27 - 29
|
55
|
18.3
|
18.3
|
78.0
|
|
Above 29
|
66
|
22.0
|
22.0
|
100.0
|
|
Total
|
300
|
100.0
|
100.0
|
|
Reliability Statistics
According to Table – 4 the Reliability Statistics which is Cronbach's Alpha
was found to be .679 which is moderately high for the 11 variables. Hence, the internal
consistency of the dataset is effective and can be consider for further analysis.
|
Table – 4
|
|
Reliability Statistics
|
|
Cronbach's Alpha
|
Cronbach's Alpha Based on Standardized Items
|
N of Items
|
|
.679
|
.667
|
11
|
KMO and Bartlett's Test
According to Table – 5 the KMO = 0.682, this specifies that the sample is
appropriate. The p-value (Sig.) of .000 < 0.05, hence the Factor Analysis is
can be done. The approximate Chi-square is 2505.199 with 55 degrees of freedom (Df),
which is significant at 95% Level of Significance.
|
Table – 5
|
|
KMO and Bartlett's Test
|
|
Kaiser-Meyer-Olkin Measure of Sampling Adequacy.
|
.682
|
|
Bartlett's Test of Sphericity
|
Approx. Chi-Square
|
2505.199
|
|
df
|
55
|
|
Sig.
|
.000
|
Factor Analysis
As there are numerous inter-related variables present for measuring the Quality
Life Work Balance of IT employees, Factor Analysis is used to extract and club the
various probable factors responsible for Quality Life Work Balance of IT employees.
Principal Component Analysis (PCA) is used as the technique for extracting the factors
along with the Varimax rotation method. The factors which has Eigen-Value of more
than 1 has been taken as significant, because Eigen-Value greater than 1 indicates
that principal components account for more variance than accounted by one of the
original variables in standardized data. This is commonly used cutoff point for
which principal components are to be retained (G. F. (n.d.). Principal Component
Analysis).
Communalities
According to Table – 6 the communalities of all the variables was higher than
0.68 which depicts that more than 68% of the variations in all the variables were
explained by the factors.
|
Table – 6
|
|
Communalities
|
|
|
Initial
|
Extraction
|
|
Flexi timing
|
1.000
|
.681
|
|
Virtual workplace
|
1.000
|
.911
|
|
Supportive superior
|
1.000
|
.852
|
|
Consider personal problem
|
1.000
|
.886
|
|
Stress management through development program
|
1.000
|
.797
|
|
Supportive Team member
|
1.000
|
.848
|
|
Gender partiality
|
1.000
|
.839
|
|
Additional pressure by superior
|
1.000
|
.837
|
|
Concerned about personal requirement
|
1.000
|
.874
|
|
Concerned for family
|
1.000
|
.784
|
|
Easy to avail leaves
|
1.000
|
.919
|
|
Extraction Method: Principal Component Analysis.
|
Total Variance Explained
From Table – 7 it can be described that the 1st Factor which was
consider to summarize 4 variables was able to explain 29.51% of variance, the 2nd
Factor which was consider to summarize 3 variables was able to explain 23.57%, the
3rd Factor which was consider to summarize 2 variables was able to explain
15.61% of variance and the remaining 2 variables was able to explain 15.20% of variance
forming the 4th Factor. All together these 4 Factors were able to explain
83.89% of the variance in total.
|
Table – 7
|
|
Total Variance Explained
|
|
Component
|
Initial Eigenvalues
|
Extraction Sums of Squared Loadings
|
Rotation Sums of Squared Loadings
|
|
Total
|
% of Variance
|
Cumulative %
|
Total
|
% of Variance
|
Cumulative %
|
Total
|
% of Variance
|
Cumulative %
|
|
1
|
3.250
|
29.549
|
29.549
|
3.250
|
29.549
|
29.549
|
3.246
|
29.505
|
29.505
|
|
2
|
2.600
|
23.634
|
53.183
|
2.600
|
23.634
|
53.183
|
2.593
|
23.572
|
53.077
|
|
3
|
1.758
|
15.979
|
69.162
|
1.758
|
15.979
|
69.162
|
1.717
|
15.611
|
68.688
|
|
4
|
1.620
|
14.730
|
83.892
|
1.620
|
14.730
|
83.892
|
1.672
|
15.204
|
83.892
|
|
5
|
.449
|
4.080
|
87.973
|
|
|
|
|
|
|
|
6
|
.336
|
3.053
|
91.026
|
|
|
|
|
|
|
|
7
|
.308
|
2.802
|
93.828
|
|
|
|
|
|
|
|
8
|
.287
|
2.607
|
96.436
|
|
|
|
|
|
|
|
9
|
.263
|
2.392
|
98.828
|
|
|
|
|
|
|
|
10
|
.106
|
.968
|
99.796
|
|
|
|
|
|
|
|
11
|
.022
|
.204
|
100.000
|
|
|
|
|
|
|
|
Extraction Method: Principal Component Analysis.
|
Rotated Component Matrix
According to Table – 8, the 1st Factor was formed with the 4 variables
namely Flexi timing (.814), Virtual workplace (.951), Consider personal problem
(.940) and Concerned for family (.885) all together it accounted for 29.51% of variance.
The 2nd Factor was formed with 3 variables namely Stress management through
development program (.892), Concerned about personal requirement (.932) and Easy
to avail leaves (.958) all together it accounted for 23.57% of variance.
The 3rd Factor was formed with 2 variables namely Supportive superior
(.921) and Supportive Team member (.920) all together it accounted for 15.61% of
variance.
The 4th Factor was formed with 2 variables namely Gender partiality (.909),
Additional pressure by superior (.912) all together it accounted for 15.20%. Altogether
the 4 Factors collectively were able to explain 83.89% of the variance.
|
Table – 8
|
|
Rotated Component Matrixa
|
|
|
Component
|
|
1
|
2
|
3
|
4
|
|
Flexi timing
|
.814
|
.041
|
-.096
|
.093
|
|
Virtual workplace
|
.951
|
-.031
|
.061
|
-.045
|
|
Supportive superior
|
.022
|
.041
|
.921
|
.047
|
|
Consider personal problem
|
.940
|
-.015
|
.038
|
-.024
|
|
Stress management through development program
|
.021
|
.892
|
.019
|
.003
|
|
Supportive Team member
|
-.038
|
-.003
|
.920
|
-.007
|
|
Gender partiality
|
.085
|
.014
|
.077
|
.909
|
|
Additional pressure by superior
|
-.041
|
-.042
|
-.036
|
.912
|
|
Concerned about personal requirement
|
-.038
|
.934
|
.016
|
-.014
|
|
Concerned for family
|
.885
|
-.008
|
-.016
|
.029
|
|
Easy to avail leaves
|
.008
|
.958
|
.008
|
-.022
|
|
Extraction Method: Principal Component Analysis.
Rotation Method: Varimax with Kaiser Normalization.a
|
|
a. Rotation converged in 4 iterations.
|
Nomenclature of the Factors
These 4 factors which were finally extracted have factor loading of more than 0.814
and these factors have been referred as the dimensions of employee job satisfaction.
The following Table – 9 shows the factors nomenclature as well as the variables
loading point for each factors.
|
Table – 9
|
|
Factors of Quality Life Work Balance of IT employees from Factor
Analysis
|
|
Factors
|
Variables
|
Factor Loading
|
Name of the Factors (Latent Variable)
|
|
1
|
Flexi timing
|
.814
|
Personal & Family
|
|
Virtual workplace
|
.951
|
|
Consider personal problem
|
.940
|
|
Concerned for family
|
.885
|
|
2
|
Stress management through development program
|
.892
|
Optimistic Working Environment
|
|
Concerned about personal requirement
|
.934
|
|
Easy to avail leaves
|
.958
|
|
3
|
Supportive superior
|
.921
|
Work Relation
|
|
Supportive Team member
|
.920
|
|
4
|
Gender partiality
|
.909
|
Demoralizing Working Culture
|
|
Additional pressure by superior
|
.912
|
One Sample t – Test
One sample t-test is a statistical procedure for testing the mean value of a distribution.
It can be used under the hypothesis that sampled distribution is normal. It is used
to know whetherthe sample comes from a specific populationbut the full population
information is not obtainable. Theone samplet-testis used for testing the samplemean.
According to Table – 10, among all the 11 variables, 6 variables are having
higher mean and the remaining 5 variables are having lower mean than the population
normal hypothesized mean of µ = 3.
|
Table - 10
|
|
One-Sample Statistics
|
|
|
N
|
Mean
|
Std. Deviation
|
Std. Error Mean
|
|
Flexi timing
|
300
|
3.30
|
1.516
|
.088
|
|
Virtual workplace
|
300
|
3.22
|
1.507
|
.087
|
|
Supportive superior
|
300
|
2.63
|
1.221
|
.071
|
|
Consider personal problem
|
300
|
3.29
|
1.455
|
.084
|
|
Stress management through development program
|
300
|
2.75
|
1.209
|
.070
|
|
Supportive Team member
|
300
|
2.68
|
1.118
|
.065
|
|
Gender partiality
|
300
|
3.18
|
1.466
|
.085
|
|
Additional pressure by superior
|
300
|
3.33
|
1.413
|
.082
|
|
Concerned about personal requirement
|
300
|
2.74
|
1.305
|
.075
|
|
Concerned for family
|
300
|
3.21
|
1.520
|
.088
|
|
Easy to avail leaves
|
300
|
2.76
|
1.255
|
.072
|
Specifically, the mean of 6 variables which are having higher mean were Flexi timing
(3.30 ± 1.52), Virtual workplace (3.22 ± 1.51), Consider personal
problem (3.29 ± 1.46), Gender partiality (3.18 ± 1.47), Additional
pressure by superior (3.33 ± 1.41) and Concerned for family (3.21 ±1.52),
these variables were having higher mean than the population normal mean, which was
taken as µ = 3.
On other hand, the mean of remaining 5 variables which are having lower mean were
Supportive superior (2.63 ± 1.22), Stress management through development
program (2.75 ± 1.21), Supportive Team member (2.68 ± 1.12), Concerned
about personal requirement (2.74 ±1.31) and Easy to avail leaves (2.76 ±
1.26).
According to Table – 11, the 6 variables which were having higher mean than
the population mean can be further explained as, Additional pressure by superior
is having the maximum highest mean difference of 0.333, at 95% CI the lower and
upper bound are 0.17 and 0.49 respectively, with t-value of 4.087 this variable
is statistically significant at 0.05 level, Flexi timing is having the 2nd
highest mean difference of 0.300, at 95% CI the lower and upper bound are 0.13 and
0.47 respectively, with t-value of 3.428 this variable is statistically significant
at 0.05 level, Consider personal problem is having the 3rd highest mean
difference of 0.287, at 95% CI the lower and upper bound are 0.12 and 0.45 respectively,
with t-value of 3.412 this variable is statistically significant at 0.05 level,
Virtual workplace is having the 4th highest mean difference of 0.220,
at 95% CI the lower and upper bound are 0.05 and 0.39 respectively, with t-value
of 2.528 this variable is statistically significant at 0.05 level, Concerned for
family is having the 5th highest mean difference of 0.207, at 95% CI
the lower and upper bound are 0.03 and 0.38 respectively, with t-value of 2.354
this variable is statistically significant at 0.05 level and Gender partiality is
the last and having the 6th highest mean difference of 0.183, at 95%
CI the lower and upper bound are 0.02 and 0.35 respectively, with t-value of 2.166
this variable is statistically significant at 0.05 level.
Alternatively, the 5 variables which were having lower mean than the population
mean can be further explained as, Supportive superior is having the maximum lowest
mean difference of -0.370, at 95% CI the lower and upper bound are -0.51 and -0.23
respectively, with t-value of -5.248 this variable is statistically significant
at 0.05 level, Supportive Team member is having the 2nd lowest mean difference
of -0.323, at 95% CI the lower and upper bound are -0.45 and -0.20 respectively,
with t-value of -5.010 this variable is statistically significant at 0.05 level,
Concerned about personal requirement is having the 3rd lowest mean difference
of -0.257, at 95% CI the lower and upper bound are -0.40 and -0.11 respectively,
with t-value of -3.406 this variable is statistically significant at 0.05 level,
Stress management through is having the 4th lowest mean difference of
-0.253, at 95% CI the lower and upper bound are - 0.39 and -0.12 respectively, with
t-value of -3.631this variable is statistically significant at 0.05 level and Easy
to avail leaves is the last and having the 5th lowest mean difference
of -0.240, at 95% CI the lower and upper bound are -0.38 and -0.10 respectively,
with t-value of -3.313 this variable is statistically significant at 0.05 level.
|
Table – 11
|
|
One-Sample Test
|
|
|
Test Value = 3
|
|
t
|
df
|
Sig. (2-tailed)
|
Mean Difference
|
95% Confidence Interval of the Difference
|
|
Lower
|
Upper
|
|
Flexi timing
|
3.428
|
299
|
.001
|
.300
|
.13
|
.47
|
|
Virtual workplace
|
2.528
|
299
|
.012
|
.220
|
.05
|
.39
|
|
Supportive superior
|
-5.248
|
299
|
.000
|
-.370
|
-.51
|
-.23
|
|
Consider personal problem
|
3.412
|
299
|
.001
|
.287
|
.12
|
.45
|
|
Stress management through development program
|
-3.631
|
299
|
.000
|
-.253
|
-.39
|
-.12
|
|
Supportive Team member
|
-5.010
|
299
|
.000
|
-.323
|
-.45
|
-.20
|
|
Gender partiality
|
2.166
|
299
|
.031
|
.183
|
.02
|
.35
|
|
Additional pressure by superior
|
4.087
|
299
|
.000
|
.333
|
.17
|
.49
|
|
Concerned about personal requirement
|
-3.406
|
299
|
.001
|
-.257
|
-.40
|
-.11
|
|
Concerned for family
|
2.354
|
299
|
.019
|
.207
|
.03
|
.38
|
|
Easy to avail leaves
|
-3.313
|
299
|
.001
|
1@-.240
|
-.38
|
-.10
|
Conclusion
The most important contributing factors for Quality Life Work Balance of IT employees
in West Bengal are identified in this particular objective through primary data
and the factors were defined after using factor analysis. The factors defined were
“Personal & Family”, “Optimistic Working Environment”,
“Work Relation” and “Demoralizing Working Culture” All the
factors were found significant at 0.05 level. Considering all the variables were
significantly important for forming the above mentioned factors, 1-sample t-test
is used to define whether a sample comes from a population with a particular mean.
The population mean was hypothesized as µ = 3.
The variables of the factors “Personal & Family” and “Demoralizing
Working Culture” were found to have a higher mean than the population normal
mean, particularly the variable Additional pressure by superior is having the maximum
higher mean difference of 0.333 while the variable Gender partiality having the
minimum higher mean difference of 0.183.
However, on other hand the variables of the factors “Optimistic Working Environment”
and “Work Relation” were found to have lower mean than the population
normal mean, particularly the variable Supportive superior is having the maximum
lowest mean difference of -0.370 while the variable Easy to avail leaves is having
the minimum lowest mean difference of -0.240.
Reference
|
[1]
|
Chawala, D., & Sondhi, N. (2011, October). Assessing Work-Life
Balance Among Indian Women Professionals’. The Indian Journal of Industrial
Relations, 27(2). Retrieved September 5, 2016, from https://www.questia.com/library/journal/1G1-349721413/assessing-work-life-balance-among-indian-women-professionals.
|
|
[2]
|
FAMILY ISSUES AND WORK-LIFE BALANCE. (n.d.). European Agency for
Safety and Health at Work, 1-8. Retrieved September 5, 2016, from https://osha.europa.eu/en/tools-and-publications/publications/e-facts/e-fact-57-family-issues-work-life-balance.
http://osha.europa.eu
|
|
[3]
|
Frone, M. R., Russell, M., & Barnes, G. M. (1996). Work–family
conflict, gender, and health-related outcomes: A study of employed parents in two
community samples. Journal of Occupational Health Psychology, 1(1), 57-69. doi:10.1037/1076-8998.1.1.57
|
|
[4]
|
Kossek, E. E., & Ozeki, C. (1998). Work-family conflict, policies,
and the job-life satisfaction relationship: A review and directions for organizational
behavior-human resources research. Journal of Applied Psychology, 83(2), 139-149.
doi:10.1037/0021-9010.83.2.139
|
|
[5]
|
Locke, E. A. (1976). The nature and causes of job satisfaction.
In M.D. Dunnette (Ed.), Handbook of industrial and organizational psychology (pp.1297-1349).
Chicago: Rand McNall
|
|
[6]
|
Pech, R., & Slade, B. (2006). Employee disengagement: Is there
evidence of a growing problem? Handbook of Business Strategy, 7(1), 21-25. doi:10.1108/10775730610618585
|
|
[7]
|
Roelofsen, P. (2002). The impact of office environments on employee
performance: The design of the workplace as a strategy for productivity enhancement.
Journal of Facilities Management J of Facilities Management, 1(3), 247-264. doi:10.1108/14725960310807944
|
|
[8]
|
Rousseau, D. (1995). Psychological Contracts in Organizations:
Understanding Written and Unwritten Agreements. doi:10.4135/9781452231594
|
|
[9]
|
Singh, J. (2013). Individual and Organizational Strategies to Balance
Work-life with Indian Way. Global Journal of Management and Business Studies, 3(3),
203-210. Retrieved September 5, 2016, from http://www.ripublication.com/gjmbs_spl/gjmbsv3n3spl_02.pdf
ISSN 2248-9878
|
|
[10]
|
Teck-Hong, T., & Waheed, A. (2011, January). HERZBERG'S MOTIVATION-HYGIENE
THEORY AND JOB SATISFACTION IN THE MALAYSIAN RETAIL SECTOR: THE MEDIATING EFFECT
OF LOVE OF MONEY. Asian Academy of Management Journal, 16(1), 73-94. Retrieved September
5, 2016, from http://web.usm.my/aamj/16.1.2011/aamj_16.1.4.pdf
|
|
[11]
|
Wells, M. M. (2000). Office Clutter Or Meaningful Personal Displays:
The Role Of Office Personalization In Employee And Organizational Well-Being. Journal
of Environmental Psychology, 20(3), 239-255. doi:10.1006/jevp.1999.0166
|

