A Refereed Monthly International Journal of Management
Related Party Transactions and its’ Impact on Performance of Group Affiliated Firms in India*
AUTHORS
|
Pankaj Gupta
Participant, Fellow (Doctoral) Program in Management
Indian Institute of management Indore
Prabandh Shikhar, Rau-Pithampur Road
Indore- 453 556 M.P, India
Ph: 08349942858
Email: f11pankajg@iimidr.ac.in
Related Party Transactions and its Impact on Performance of Group Affiliated Firms in India*
Pankaj Gupta, Participant, FPM (Ph.D.)
Finance and Accounting Area
Indian Institute of Management Indore
Prabandh Shikhar, Rau-Pithampur Road, Indore- 45556, M.P, India
|
ABSTRACT
Controlling minority structures prevailed in business groups Indian private sector firms are mainly dominated by Indian business groups wherein, group affiliated firms are associated with the controller and groups have formed the controlling minority structure. The decision making in these firms have been motivated by the controllers and results in related party transactions which are abused sometimes (Tunneling RPTs) but not in others (Propping RPTs). In this study an analysis has been done for the impact of tunneling RPTs and propping RPTs on performance of group affiliated firms. Results suggest that a positive relationship between performance and tunneling RPTs occurs when revenue receipts are considered as below the market prices but, negative when above the market prices. Relationship between performance and propping is negative in initial years when RPTs considered as below market prices but becomes positive later and remains positive through the period when RPTs considered above market prices.
Key Words Related party transactions, business groups, performance
1 Introduction
Developments in the theory of firm have long been a debating agenda among researchers, wherein, different theoretical perspectives have emerged and, settings of organizations in different boundaries is an outcome of adoption of those perspectives. The dominant view on understanding the economic nature of the firm and ownership starts with theory of property rights approach (H Demsetz, 1967), according to which a firm is “ a nexus of contracts”, between different agents, and organizes under diffuse ownership, separating it from control and have implications upon the society (Berle & Means, 1932; Fama & Jensen, 1983a, 1983b; Jensen & Meckling, 1976). In diffused ownership firms, the principal-agent problem has been studied widely and suggests for the concentrated ownership to mitigate such agency problems (Harold Demsetz & Lehn, 1985). Despite an established literature on diffused ownership, existence of concentrated ownership is not avoidable due to the fact that there is no set corporate law which may restrict you to adopt any of the said structures but, it is the benefits outweighing the cost of any particular structure forcing you to adopt a particular one (Baysinger & Butler, 1985). Various authors study the effects of concentrated ownership structures on performance and found conflicting results.[1]
In 1983 Fama and Jensen, tried to explain the survival of organizations having separation of ownership (Cash flow rights) and control (Voting rights) and gave factors for the separation as reducing agency problems. This work further emphasizes that, “without separation residual claimants have little protection against the opportunistic actions of decision agents which reduces the value of unrestricted residual claims”. Grossman and Hart (1986) coined the term private benefits of control (PBC) and explain it as the one which benefits current management or acquirer. One extreme form mentioned here is the diversion of resources from security holders to subsidiaries of management or the acquirer.
In India, corporate ownership structure is primarily concentrated, Pyramidal and dominated by family business groups (Sarkar & Sarkar, 2011). Most of the firms are under the control of Family business groups wherein the ultimate controller these firms in a set structure known as controlling minority structure(Bebchuk, Kraakman, & Triantis, 2000). In family business groups, controllers control affiliated firms through a network of organizations called pyramid structure(Porta, Lopez-de-Silanes, & Shleifer, 1999). In such structures, Indian business groups have group affiliated firms (GPA) with differential cash flow rights and control rights called as ownership wedge (Kali & Sarkar, 2011).[2] The existence of wedge is one of the factors for the private benefit of control and diversification of business groups by controlling shareholders. Under pyramid structures, controlling owner has private benefits of control and exhibits tunneling of resources to expropriate minority shareholders (Principal-Principal agent problem). The term “tunneling” refers to the transfer of resources from low cash flow right firm to the high cash-flow right firm, and, these both firms are controlled through an ultimate owner. The term “propping” is the exact opposite to tunneling, wherein, resources transfers from high cash flow right firm to the low cash flow right firm. The basic difference between tunneling and propping is that, propping occurs when a firm faces some financial difficulty, wherein, tunneling may occur or not if a firm has sound financial health.
Usually in literature there are number of methods to detect tunneling and propping. One of the most popular methodology deals with industry shock effect (Bertrand et al. 2002). According to this when a firm gets a positive shock as compared to industry profit, its profit is below than expected and the difference of expected and real gets tunneled to other group affiliates where the controllers cash flow right is greater as compared to this firm.
Second method for tunneling evidences is to get the impact of listing of related party transactions on cumulative average returns of the company stock, but, this method is applicable only in countries where listing of RPTs is allowed. In India Listing of RPTs not started yet and is going to start with effect from Oct 1, 2014. Third one is to examine the impact of RPTs during a year on the annual return measures through OLS regression or Probit models. There are critiques on Bertrand’s methodology and improvements in data collection available (Siegel & Choudhury, 2012). While the CAR based methodology is difficult to follow in India as listing of RPTs have not formally started. In India, the evidence of tunneling and propping under the consideration of financial health is sparse. The main objective of this paper is to investigate the evidence of tunneling and propping when changing debt structure is taken into consideration. This has also been tried to investigate whether after getting debt and observing propping, the performance has been declined due to tunneling, i.e. is there any relationship between tunneling and propping. Further this paper is organize as: part 2 focus on literature review and hypothesis development; part 3 gives the details of data and methodology; part 4 reports the results and analysis, and part 5 concludes.
2 Literature review and Hypothesis development
[1] Some authors have found positive (Slovin & Sushka, 1993) and no relationship (Harold Demsetz & Lehn, 1985; Thomsen & Pedersen, 1998)
[2] See the report p. 79 for the logic of wedge and tunneling given on the link http://www.oecd.org/corporate/ca/corporategovernanceprinciples/relatedpartytransactionsandminorityshareholderrights.htm
2.1 Evolution of controlling minority structures
In 1983, Fama and Jensen, tried to explain the survival of organizations having separation of ownership (Cash flow rights) and control (Voting rights) and gave factors for the separation as reducing agency problems. This work further emphasizes that, “without separation residual claimants have little protection against the opportunistic actions of decision agents which reduces the value of unrestricted residual claims”. In 1988, Grossman and Hart coined the term private benefits of control (PBC) and explains it as the one which benefits current management or acquirer. One extreme form mentioned here is the diversion of resources from security holders to subsidiaries of management or the acquirer. Shareholders become large when legal protection is not sufficient to protect their rights, i.e. concentrated ownership. In rent protection theory, the puzzling aspect of choice of ownership structure is addressed where private benefits of control is taken into consideration(Bebchuk, 1999). Following this, Bebchuk et al. (2000), first, formally describes the controlling minority structures, in which a shareholder exercises controls even after having a small fraction of equity claims on company’s cash flows. In CMS, there are three ways to maintain control, i.e. pyramids, cross-ownership and multiple voting rights. Pyramids are the most common CMS in Asian countries (Classens et al.1999).
2.2 Family business groups in India: Control through Pyramids
A business group can be defined as a set of legally-separate firms operating in multiple strategically-unrelated activities that are under common ownership and control (Granovetter, 1995). From agency theory perspectives; family business groups have two competing view, i.e. entrenchment view (Fama and Jensen 1983) and alignment view (Demsetz and Lehn 1985). Alignment view does not hold in family business groups (Villalonga and Amit 2004), and in family groups agency issues between minority and majority shareholders dominates (Yiu et al., 2007). Family controlled business groups, taking the form of CMS structure are found in emerging economies with greater separation (La Porta et al., 1999) and increasingly serious agency problems causing lower value and investment impact (Lee, 2002). The literature on family business groups with value is ambiguous as there are costs: private benefits (Fama and Jensen 1983), low bidding power of other agents (Barclays and Holderness 1988), expropriation (De Angelo 2000) and benefits: Solving Principal-agent problem (Demsetz and Lehn 1985), Long investment horizon (Stein 1988, 1989), investing in good NPV projects (James 1999), lower cost of debt due to longer presence (Anderson et al 2002).
The exact definition of business groups is somewhat ambiguous but clearly has three distinct elements: unrelated product portfolio, pyramidal ownership structure, and family ownership and control, which are found in the Indian context. This allows the controlling owner to expropriate wealth of minority shareholders (Dharwadkar et al., 2000) by tunneling resources (Bertrand et al., 2002; Bae et al., 2002; Johnson et al., 2002) and sets a background of this study. There is value based periodic development of business groups in India (Gollakota and Gupta 2006) motivated by government, privatization or society (Khanna and Yafeh 2007). In India, business groups have affiliated firms, where ultimate owner controls affiliated firms through pyramids and the diversity in business groups is observable, i.e. no selection bias (George et al., 2011). Our study mainly focuses upon the Indian business groups for several reasons like availability of diverse groups, consists of identifiable affiliated firms, controlled through family members via direct and indirect ownership etc.
As discussed, the business groups in India have pyramid structure, a type of CMS structure wherein, features of both diffused (Control by insider) and concentrated (Isolation from market for corporate control) ownership puts a pressure upon the incentives design and control issues (Bebchuk et al., 2000).
2.3 CMS structure and agency Problems
In controlling minority structures the agency problem is mainly between the controlling shareholders and minority shareholders known as Principal-principal problem which arises due to poor legal protection, family control(Young, Peng, Ahlstrom, & Bruton, 2002). The agency problem in CMS is severe as compared to diffused ownership and concentrated ownership structures due to the fact that, on one hand, unlike diffused ownership, CMS does not have any scope of takeover or control transfer, while on the other hand, unlike concentrated ownership CMS does not have sufficient cash flow rights so as to manipulate decisions for their own benefit (Bebchuk et al., 2000). In family business groups, agency problem may exist in between family members (Schulze, Lubatkin, Dino, & Buchholtz, 2001). Besides this, the most discuss agency problems in family business groups are the separation of ownership and control, entrenchment of controlling shareholders and tunneling of resources (Morck & Yeung, 2003). Family business groups mainly organizes firms in pyramid structures (Porta et al., 1999), borrow the capital from outsiders (shareholders) maintains control over each firm so as to discipline managers for their self servicing purposes (Bebchuk et al 2000; Morck et al 2000) and thereby expropriation of minority shareholders occurs in the form tunneling (Bertrand, Mehta, & Mullainathan, 2002; López de Silanes, Johnson, La Porta, & Shleifer, 2000). Several studies have empirically investigated the agency problem between controlling shareholders and minority shareholders (Faccio, Lang, & Young, 2001; Gomes, 2000; La, Lopez-de-silanes, Shleifer, & Vishny, 2002;Cronqvist and Nilsson 2003;Lemmon and Lins 2003;Morck and Yeung 2003;Berkman et al 2009)
2.4 Tunneling and propping in family business groups
Literature on tunneling and propping is not widespread especially in countries like India. The term tunneling was first defined by López de Silanes et al. (2000), as the transfer of assets and profits out of firms for the benefit controlling shareholders’. Later, tunneling is categorized into three categories (Cash flow tunneling, asset tunneling and equity tunneling) by Atanasov et al. (2008) and suggested that while asset and equity tunneling impacts the balance sheet, cash flow tunneling affects the income statement. Comparison between these types of tunneling is ambiguous as some advocates that expropriation from equity tunneling is more severe (Gilson & Gordon, 2003) while, others advocates for cash flow and assets tunneling(V. Atanasov, Boone, & Haushalter, 2010). Propping is the opposite of tunneling, i.e. negative tunneling and many authors have analyzed propping theoretically(Friedman, Johnson, & Mitton, 2003; Riyanto & Toolsema, 2008) investigates the propping when a firm is in financial difficulty (Bai & Song, 2004; Cheung, Jing, Lu, Rau, & Stouraitis, 2009; Friedman et al., 2003; Jian & Wong, 2008; Kali & Sarkar, 2005; Peng, Wei, & Yang, 2011; Ying & Wang, 2013).
Direct evidence of tunneling and propping is clandestine as it is in the interest of controllers to hide such transactions, and, therefore initially indirect method to detect tunneling and propping is given by Bertrand et al. (2002). This method, though, extensively used by researchers (Friedman et al., 2003; Kali and Sarkar 2005) but, errors with corrections in methodology were also counted by researchers like Gopalan et al (2007); Siegel and Chaudhary 2012). Besides this, direct method to detect tunneling and propping through the use of related party transactions (RPTs) is also present. In direct methods, most researchers present results based on event studies (Bae et al. 2008; Cheung et al 2009; Peng et al. 2011) and OLS regression between performance and RPTs (Jiang and Wong 2010; Jiang et al 2009; Ying and Wong 2014;Kang et al 2014). In India, evidence of tunneling and propping is sparse in nature and scope for methodologies is constrained due to the lack database (Seigel and choudhary 2012) and listing of RPTs with stock exchanges.[1] Even after such problems studies on Indian business groups is presented by researchers like Bertrand et al (2002); Gopalan et al (2007) and Kali and Sarkar (2011).
2.5 Hypothesis Development
In India, family controlled business groups have number of affiliated firms organized under controlling minority structures, wherein pyramid is the most widely known structure. In Pyramids, family (promoters) has a control either direct or indirect and thus an incentive for private benefits of control arises. In family business groups, controlling insiders are family members, therefore, Principal-Agent problem is minimal but, separation of ownership and control motivates controller to indulge in activities that cause private benefits to them and in such case expropriation of minority shareholders is found. This problem is known as Principal-principal problem.
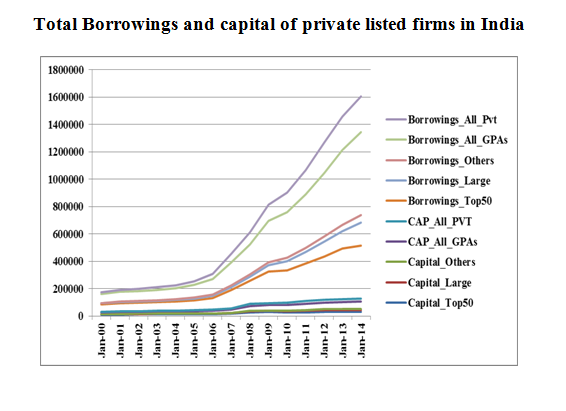
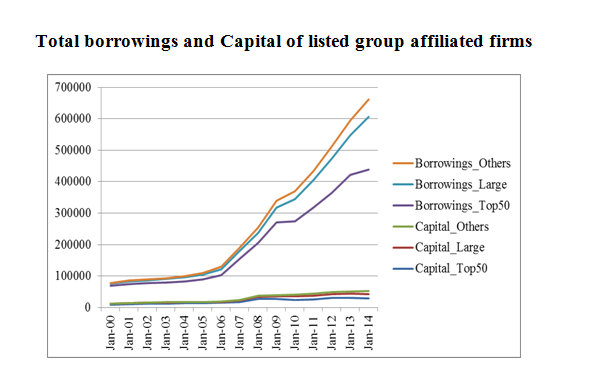
In India, if we look into the pattern of external source of financing (Annexure 1) we find that in past five years there is a sharp increase in long term borrowings while equity issue has been declined. An obvious curiosity arises for the use of external borrowings. Therefore it is intuitive to ask about the relationship between related party transactions and leverage.
Hypothesis 1: There is a positive relationship between leverage and RPTs.
Next, the more is the number of RPTs does not necessarily expropriate the minority shareholders’. In essence it is not solely responsible for the tunneling or propping. A relationship between tunneling rate and RPTs is established. We have number of related party transactions like Asset sales, assets purchase, loan guarantees given or taken etc (Annexure 2). These transactions are responsible for tunneling when occurs below market price to the related party and responsible for propping when occurs at high market price. Therefore, ex ante first we assume the asset sales and purchase occurs at below market price and decides for tunneling and propping and then, tries to explore the same after assuming these transactions above market price.
Hypothesis 2: Tunneling (Propping) rate is positively related with related party transactions.
Further, tunneling and propping rate has an impact on firm performance. When tunneling occurs in a group affiliated firm it is penalized by the investors and performance is badly affected, while, on the other hand, investors promote if propping occurs. Therefore, performance is proposed to decline when tunneling occurs and increases for propping related RPTs.
Hypothesis 3: performance is negatively related with tunneling RPTs and is positively related with propping RPTs.
Data and Methodology
The data is collected from CMIE Prowess for the period 2009-2013. Despite so many critiques of CMIE Prowess (Siegel and choudhary 2012; Srinivasan 2012), It is a reliable source due to several reasons like ease to access, improvisations in the database during the period, and wide acceptance among researchers. The data for RPTs with related parties is available in the database for the given period but, it doesn’t mention anywhere that whether transactions are below market price or above price. Therefore, first assuming that assets sales and purchase occurs above market price we decide sales as propping RPT and purchase as tunneling RPT. When we assume the sales and purchase below market price, sales is considered as tunneling RPT and purchase as propping RPTs.
To collect data it is better to rely upon CMIE Prowess database due to the fact that it is the most reliable, available & widely used source of information. Here we require the data for related party transactions which can be accessed from Prowess as it saves time and efforts. Though, critiques for the use of CMIE Prowess are available but, authors also advocates for the use for CMIE Prowess[2]. Prowess is widely used database by various researchers and has been upgraded since 2006. In this study to carry out the hypothesis tests, the data for top 50 business groups affiliated firms is considered. The data is taken for past four years, i.e. from 2009-2013. Initially we consider group affiliated companies for top 50 business groups (2720). This narrows to 1966 companies when financial services sector companies are excluded. Out of this, we consider only affiliated companies listed in NSE (205). Out of 205, we exclude two more companies as these are established after 2010. In this way we have 203 Group affiliated companies from top 50 business groups as sample for the study.
Model Description
PBIDTt+1 = α + β1* RPT_tunneling + β2 * RPT_propping + β3 *SIZE + β4*Leverage + εt
TOBIN’s Q = α + β1* RPT_tunneling + β2 * RPT_propping + β3 *SIZE + β4*Leverage + εt
In the above model, PBDIT (profit before dividend interest and tax) is a dependent variable, which is useful when considered for non-finance companies. TOBIN’s Q is the ratio between total market capitalization and total asset. Tobin’s Q gives the opportunity for growth of a firm. Further, RPT_tunneling is the RPTs occurred in the given year and is assumed to be tunneling RPTs. RPT_propping is the propping related RPTs, SIZE in natural logarithms of total assets and proxy for Leverage is the ratio of total debt to total assets.
[1] In India, Bertrand’s methodology is questioned by Siegel and Chaudhary (2012) and counts several methodological and database related issues. Apart from this, event studies are also not possible as the listing of RPTs was not possible till Oct 2014.
[2] For critiques see Srinivasan (2011) while authors those have taken data from CMIE prowess are Bertrand et al. (2002), Gopalan et al. (2007) and Siegel and Chaudhary (2012).
2.1 Evolution of controlling minority structures
In 1983, Fama and Jensen, tried to explain the survival of organizations having separation of ownership (Cash flow rights) and control (Voting rights) and gave factors for the separation as reducing agency problems. This work further emphasizes that, “without separation residual claimants have little protection against the opportunistic actions of decision agents which reduces the value of unrestricted residual claims”. In 1988, Grossman and Hart coined the term private benefits of control (PBC) and explains it as the one which benefits current management or acquirer. One extreme form mentioned here is the diversion of resources from security holders to subsidiaries of management or the acquirer. Shareholders become large when legal protection is not sufficient to protect their rights, i.e. concentrated ownership. In rent protection theory, the puzzling aspect of choice of ownership structure is addressed where private benefits of control is taken into consideration(Bebchuk, 1999). Following this, Bebchuk et al. (2000), first, formally describes the controlling minority structures, in which a shareholder exercises controls even after having a small fraction of equity claims on company’s cash flows. In CMS, there are three ways to maintain control, i.e. pyramids, cross-ownership and multiple voting rights. Pyramids are the most common CMS in Asian countries (Classens et al.1999).
2.2 Family business groups in India: Control through Pyramids
A business group can be defined as a set of legally-separate firms operating in multiple strategically-unrelated activities that are under common ownership and control (Granovetter, 1995). From agency theory perspectives; family business groups have two competing view, i.e. entrenchment view (Fama and Jensen 1983) and alignment view (Demsetz and Lehn 1985). Alignment view does not hold in family business groups (Villalonga and Amit 2004), and in family groups agency issues between minority and majority shareholders dominates (Yiu et al., 2007). Family controlled business groups, taking the form of CMS structure are found in emerging economies with greater separation (La Porta et al., 1999) and increasingly serious agency problems causing lower value and investment impact (Lee, 2002). The literature on family business groups with value is ambiguous as there are costs: private benefits (Fama and Jensen 1983), low bidding power of other agents (Barclays and Holderness 1988), expropriation (De Angelo 2000) and benefits: Solving Principal-agent problem (Demsetz and Lehn 1985), Long investment horizon (Stein 1988, 1989), investing in good NPV projects (James 1999), lower cost of debt due to longer presence (Anderson et al 2002).
The exact definition of business groups is somewhat ambiguous but clearly has three distinct elements: unrelated product portfolio, pyramidal ownership structure, and family ownership and control, which are found in the Indian context. This allows the controlling owner to expropriate wealth of minority shareholders (Dharwadkar et al., 2000) by tunneling resources (Bertrand et al., 2002; Bae et al., 2002; Johnson et al., 2002) and sets a background of this study. There is value based periodic development of business groups in India (Gollakota and Gupta 2006) motivated by government, privatization or society (Khanna and Yafeh 2007). In India, business groups have affiliated firms, where ultimate owner controls affiliated firms through pyramids and the diversity in business groups is observable, i.e. no selection bias (George et al., 2011). Our study mainly focuses upon the Indian business groups for several reasons like availability of diverse groups, consists of identifiable affiliated firms, controlled through family members via direct and indirect ownership etc.
As discussed, the business groups in India have pyramid structure, a type of CMS structure wherein, features of both diffused (Control by insider) and concentrated (Isolation from market for corporate control) ownership puts a pressure upon the incentives design and control issues (Bebchuk et al., 2000).
2.3 CMS structure and agency Problems
In controlling minority structures the agency problem is mainly between the controlling shareholders and minority shareholders known as Principal-principal problem which arises due to poor legal protection, family control(Young, Peng, Ahlstrom, & Bruton, 2002). The agency problem in CMS is severe as compared to diffused ownership and concentrated ownership structures due to the fact that, on one hand, unlike diffused ownership, CMS does not have any scope of takeover or control transfer, while on the other hand, unlike concentrated ownership CMS does not have sufficient cash flow rights so as to manipulate decisions for their own benefit (Bebchuk et al., 2000). In family business groups, agency problem may exist in between family members (Schulze, Lubatkin, Dino, & Buchholtz, 2001). Besides this, the most discuss agency problems in family business groups are the separation of ownership and control, entrenchment of controlling shareholders and tunneling of resources (Morck & Yeung, 2003). Family business groups mainly organizes firms in pyramid structures (Porta et al., 1999), borrow the capital from outsiders (shareholders) maintains control over each firm so as to discipline managers for their self servicing purposes (Bebchuk et al 2000; Morck et al 2000) and thereby expropriation of minority shareholders occurs in the form tunneling (Bertrand, Mehta, & Mullainathan, 2002; López de Silanes, Johnson, La Porta, & Shleifer, 2000). Several studies have empirically investigated the agency problem between controlling shareholders and minority shareholders (Faccio, Lang, & Young, 2001; Gomes, 2000; La, Lopez-de-silanes, Shleifer, & Vishny, 2002;Cronqvist and Nilsson 2003;Lemmon and Lins 2003;Morck and Yeung 2003;Berkman et al 2009)
2.4 Tunneling and propping in family business groups
Literature on tunneling and propping is not widespread especially in countries like India. The term tunneling was first defined by López de Silanes et al. (2000), as the transfer of assets and profits out of firms for the benefit controlling shareholders’. Later, tunneling is categorized into three categories (Cash flow tunneling, asset tunneling and equity tunneling) by Atanasov et al. (2008) and suggested that while asset and equity tunneling impacts the balance sheet, cash flow tunneling affects the income statement. Comparison between these types of tunneling is ambiguous as some advocates that expropriation from equity tunneling is more severe (Gilson & Gordon, 2003) while, others advocates for cash flow and assets tunneling(V. Atanasov, Boone, & Haushalter, 2010). Propping is the opposite of tunneling, i.e. negative tunneling and many authors have analyzed propping theoretically(Friedman, Johnson, & Mitton, 2003; Riyanto & Toolsema, 2008) investigates the propping when a firm is in financial difficulty (Bai & Song, 2004; Cheung, Jing, Lu, Rau, & Stouraitis, 2009; Friedman et al., 2003; Jian & Wong, 2008; Kali & Sarkar, 2005; Peng, Wei, & Yang, 2011; Ying & Wang, 2013).
Direct evidence of tunneling and propping is clandestine as it is in the interest of controllers to hide such transactions, and, therefore initially indirect method to detect tunneling and propping is given by Bertrand et al. (2002). This method, though, extensively used by researchers (Friedman et al., 2003; Kali and Sarkar 2005) but, errors with corrections in methodology were also counted by researchers like Gopalan et al (2007); Siegel and Chaudhary 2012). Besides this, direct method to detect tunneling and propping through the use of related party transactions (RPTs) is also present. In direct methods, most researchers present results based on event studies (Bae et al. 2008; Cheung et al 2009; Peng et al. 2011) and OLS regression between performance and RPTs (Jiang and Wong 2010; Jiang et al 2009; Ying and Wong 2014;Kang et al 2014). In India, evidence of tunneling and propping is sparse in nature and scope for methodologies is constrained due to the lack database (Seigel and choudhary 2012) and listing of RPTs with stock exchanges.[1] Even after such problems studies on Indian business groups is presented by researchers like Bertrand et al (2002); Gopalan et al (2007) and Kali and Sarkar (2011).
2.5 Hypothesis Development
In India, family controlled business groups have number of affiliated firms organized under controlling minority structures, wherein pyramid is the most widely known structure. In Pyramids, family (promoters) has a control either direct or indirect and thus an incentive for private benefits of control arises. In family business groups, controlling insiders are family members, therefore, Principal-Agent problem is minimal but, separation of ownership and control motivates controller to indulge in activities that cause private benefits to them and in such case expropriation of minority shareholders is found. This problem is known as Principal-principal problem.
In India, if we look into the pattern of external source of financing (Annexure 1) we find that in past five years there is a sharp increase in long term borrowings while equity issue has been declined. An obvious curiosity arises for the use of external borrowings. Therefore it is intuitive to ask about the relationship between related party transactions and leverage.
Hypothesis 1: There is a positive relationship between leverage and RPTs.
Next, the more is the number of RPTs does not necessarily expropriate the minority shareholders’. In essence it is not solely responsible for the tunneling or propping. A relationship between tunneling rate and RPTs is established. We have number of related party transactions like Asset sales, assets purchase, loan guarantees given or taken etc (Annexure 2). These transactions are responsible for tunneling when occurs below market price to the related party and responsible for propping when occurs at high market price. Therefore, ex ante first we assume the asset sales and purchase occurs at below market price and decides for tunneling and propping and then, tries to explore the same after assuming these transactions above market price.
Hypothesis 2: Tunneling (Propping) rate is positively related with related party transactions.
Further, tunneling and propping rate has an impact on firm performance. When tunneling occurs in a group affiliated firm it is penalized by the investors and performance is badly affected, while, on the other hand, investors promote if propping occurs. Therefore, performance is proposed to decline when tunneling occurs and increases for propping related RPTs.
Hypothesis 3: performance is negatively related with tunneling RPTs and is positively related with propping RPTs.
Data and Methodology
The data is collected from CMIE Prowess for the period 2009-2013. Despite so many critiques of CMIE Prowess (Siegel and choudhary 2012; Srinivasan 2012), It is a reliable source due to several reasons like ease to access, improvisations in the database during the period, and wide acceptance among researchers. The data for RPTs with related parties is available in the database for the given period but, it doesn’t mention anywhere that whether transactions are below market price or above price. Therefore, first assuming that assets sales and purchase occurs above market price we decide sales as propping RPT and purchase as tunneling RPT. When we assume the sales and purchase below market price, sales is considered as tunneling RPT and purchase as propping RPTs.
To collect data it is better to rely upon CMIE Prowess database due to the fact that it is the most reliable, available & widely used source of information. Here we require the data for related party transactions which can be accessed from Prowess as it saves time and efforts. Though, critiques for the use of CMIE Prowess are available but, authors also advocates for the use for CMIE Prowess[2]. Prowess is widely used database by various researchers and has been upgraded since 2006. In this study to carry out the hypothesis tests, the data for top 50 business groups affiliated firms is considered. The data is taken for past four years, i.e. from 2009-2013. Initially we consider group affiliated companies for top 50 business groups (2720). This narrows to 1966 companies when financial services sector companies are excluded. Out of this, we consider only affiliated companies listed in NSE (205). Out of 205, we exclude two more companies as these are established after 2010. In this way we have 203 Group affiliated companies from top 50 business groups as sample for the study.
Model Description
PBIDTt+1 = α + β1* RPT_tunneling + β2 * RPT_propping + β3 *SIZE + β4*Leverage + εt
TOBIN’s Q = α + β1* RPT_tunneling + β2 * RPT_propping + β3 *SIZE + β4*Leverage + εt
In the above model, PBDIT (profit before dividend interest and tax) is a dependent variable, which is useful when considered for non-finance companies. TOBIN’s Q is the ratio between total market capitalization and total asset. Tobin’s Q gives the opportunity for growth of a firm. Further, RPT_tunneling is the RPTs occurred in the given year and is assumed to be tunneling RPTs. RPT_propping is the propping related RPTs, SIZE in natural logarithms of total assets and proxy for Leverage is the ratio of total debt to total assets.
[1] In India, Bertrand’s methodology is questioned by Siegel and Chaudhary (2012) and counts several methodological and database related issues. Apart from this, event studies are also not possible as the listing of RPTs was not possible till Oct 2014.
[2] For critiques see Srinivasan (2011) while authors those have taken data from CMIE prowess are Bertrand et al. (2002), Gopalan et al. (2007) and Siegel and Chaudhary (2012).
Empirical analysis and Results
First, it is an obvious question to find the RPTs which are the main and considerable here for analysis. For this we have tried to find which particular RPT in a given category is having the highest proportion and which party is involved therein.
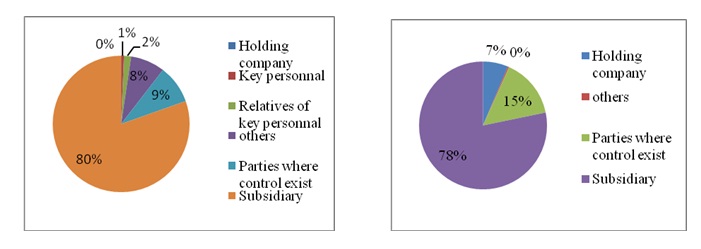
For this, we first consider the Total revenue receipts/Income category and found that the highest proportion is for ‘income from sale of raw material/finished goods (55%)’ and income from services (36%). The largest related party involved is “Subsidiary (60%)” and “Parties where control exists (33%).
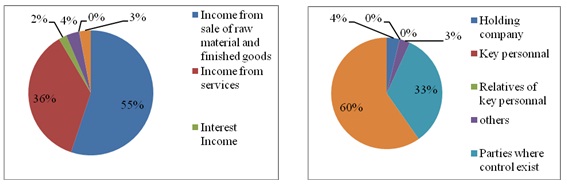
Here, we consider only these two RPTs for our cross section regression analysis and it becomes tunneling RPT when assumed to occur at below market price and propping RPT when assumed to occur at above market price.
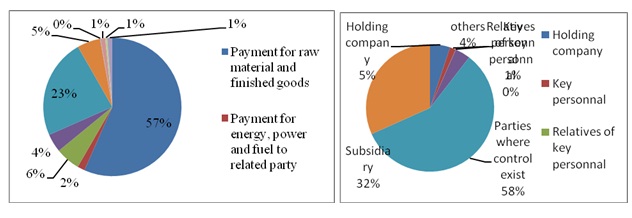
In Total revenue expenses/payment category, the highest proportion is from ‘Payment for raw material and finished goods (57%)’ and for ‘Operating expenses (23%)’. The largest party is the parties where control exists (58%) and subsidiary (32%). Hence we consider only these two RPTs for the analysis and consider it as tunneling RPT when assumed at above market price or propping RPT when assumed at below market price.
Total capital receipts are propping RPTs when considered and is divided in two category, i.e. ‘receipt from sale of fixed assets’ and ‘receipt from sale of investments’. Out of these two, highest is the receipt from sale of investments. Both these two types of transactions occur at most with subsidiaries. This provides us the basis to further investigate into the subsidiaries responsible for propping these group affiliated firms.
Total capital account payment is another category wherein most of the transactions have occurred with subsidiaries (80%).
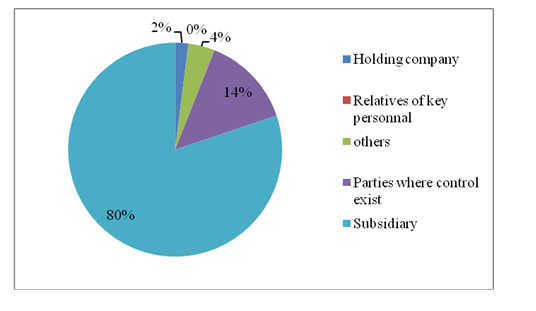
The last category is the loan guarantee which is divided into loan guarantees given and guarantees taken when combined with outstanding and given/taken during the year. In this category, outstanding guarantees given are the highest which indicates for tunneling at larger extent. In guarantees given, the largest related party is subsidiary while in guarantees taken category the largest related party is ‘Parties where control exists’
From the above discussion and analysis it is clear that most transaction have been occurred with only two parties, i.e. “Parties where control exists” and “Subsidiaries”. This guides us for further careful analysis and taking account of the transactions with those parties more carefully.
4.2 Test Statistics and summary Results
When Revenue receipts and revenue payments are assumed to below market prices
Here we first tried to estimate the results for impact of tunneling RPTs and propping RPTs on PBDITA. From the table given below it is observed that across years initially propping is negatively related with PBDITA i.e. till year 2011 and positively related for the year 2012. Relationship of tunneling RPTs is initially positive till year 2011 but, later becomes negative for the year 2012 and 2013. This depicts that initially in the post crisis period Propping RPTs are taken as negative i.e. being avoided but, later preferred. The p values are not significant for tunneling and propping RPTs which suggest considering additional control variables. The p values for Total assets and leverage is significant for most of the years and the coefficient of parameter is positive which suggests that large and highly levered firms’ performance is better.
Table 1
|
2009
|
|
|
|
|
|
Included observations: 187
|
|
|
|
|
|
Variable
|
Coefficient
|
Std. Error
|
t-Statistic
|
Prob.
|
|
Dependent Variable: PBDITA
|
|
|
|
|
|
RPT_TUNNELING
|
0.015
|
0.04145
|
0.36178
|
0.7179
|
|
RPT_PROPPING
|
-0.0999
|
0.26252
|
-0.3806
|
0.7039
|
|
TOTAL_ASSETS
|
109.201
|
23.9591
|
4.55783
|
0
|
|
LEVERAGE
|
0.438
|
0.206
|
2.12623
|
0.0348
|
|
R-squared
|
0.10285
|
|
|
|
|
Adjusted R-squared
|
0.08814
|
|
|
|
|
Mean dependent var
|
606.452
|
|
|
|
|
S.D. dependent var
|
2218.13
|
|
|
|
|
2010
|
|
|
|
|
|
Dependent Variable: PBDITA
|
|
|
|
|
|
Included observations: 200
|
|
|
|
|
|
Variable
|
Coefficient
|
Std. Error
|
t-Statistic
|
Prob.
|
|
|
|
|
|
|
|
RPT_TUNNELING
|
0.12167
|
0.0723
|
1.68292
|
0.094
|
|
RPT_PROPPING
|
-0.5406
|
0.37607
|
-1.4376
|
0.1521
|
|
TOTAL_ASSETS
|
130.842
|
26.5294
|
4.93196
|
0
|
|
LEVERAGE
|
0.04819
|
0.08822
|
0.54633
|
0.5855
|
|
R-squared
|
0.08344
|
|
|
|
|
Adjusted R-squared
|
0.06941
|
|
|
|
|
Mean dependent var
|
672.263
|
|
|
|
|
S.D. dependent var
|
2607.09
|
|
|
|
|
2011
|
|
|
|
|
|
Dependent Variable: PBDITA
|
|
|
|
|
|
Included observations: 203
|
|
|
|
|
|
Variable
|
Coefficient
|
Std. Error
|
t-Statistic
|
Prob.
|
|
RPT_TUNNELING
|
0.05689
|
0.073
|
0.77933
|
0.4367
|
|
RPT_PROPPING
|
-0.3361
|
0.29881
|
-1.1249
|
0.262
|
|
TOTAL_ASSETS
|
142.802
|
34.6586
|
4.12024
|
0.0001
|
|
LEVERAGE
|
0.76034
|
0.35705
|
2.12949
|
0.0344
|
|
R-squared
|
0.10316
|
|
|
|
|
Adjusted R-squared
|
0.08964
|
|
|
|
|
Mean dependent var
|
825.318
|
|
|
|
|
S.D. dependent var
|
3371.61
|
|
|
|
|
2012
|
|
|
|
|
|
Dependent Variable: PBDITA
|
|
|
|
|
|
Included observations: 195
|
|
|
|
|
|
Variable
|
Coefficient
|
Std. Error
|
t-Statistic
|
Prob.
|
|
RPT_TUNNELING
|
-0.0627
|
0.059
|
-1.0634
|
0.2889
|
|
RPT_PROPPING
|
0.05817
|
0.12403
|
0.46896
|
0.6396
|
|
TOTAL_ASSETS
|
139.5
|
33.9746
|
4.10601
|
0.0001
|
|
LEVERAGE
|
0.88257
|
0.3347
|
2.63692
|
0.0091
|
|
R-squared
|
0.09982
|
|
|
|
|
Adjusted R-squared
|
0.08568
|
|
|
|
|
Mean dependent var
|
843.714
|
|
|
|
|
S.D. dependent var
|
3313.49
|
|
|
|
|
2013
|
|
|
|
|
|
Dependent Variable: PBDITA
|
|
|
|
|
|
Included observations: 202
|
|
|
|
|
|
Variable
|
Coefficient
|
Std. Error
|
t-Statistic
|
Prob.
|
|
RPT_TUNNELING
|
-0.0244
|
0.03267
|
-0.7472
|
0.4558
|
|
RPT_PROPPING
|
0.00831
|
0.04318
|
0.19253
|
0.8475
|
|
TOTAL_ASSETS
|
132.455
|
32.7075
|
4.04968
|
0.0001
|
|
LEVERAGE
|
0.75897
|
0.31133
|
2.43782
|
0.0157
|
|
R-squared
|
0.0921
|
|
|
|
|
Adjusted R-squared
|
0.07834
|
|
|
|
|
Mean dependent var
|
810.02
|
|
|
|
|
S.D. dependent var
|
3227.07
|
|
|
|
When Revenue receipts and revenue payments are assumed above market prices
When we consider the Total revenue receipt and payments above market prices the results for tunneling RPTs and propping RPTs is given in the table 2. From table 2 it can be concluded that relationship between tunneling and propping RPTs is same for the year 2009, but is reverse from the year 2010, i.e. tunneling is negatively related with performance and propping is positively related. This suggests that most transactions are being carried out at above market prices which depicts for the tunneling and negatively affecting the performance
Table 2
|
2009
|
|
|
|
|
|
Dependent Variable: PBDITA
|
|
|
|
|
|
Included observations: 185
|
|
|
|
|
|
Variable
|
Coefficient
|
Std. Error
|
t-Statistic
|
Prob.
|
|
RPT_TUNNELING
|
0.01493
|
0.041635
|
0.358602
|
0.7203
|
|
RPT_PROPPING
|
-0.100735
|
0.263728
|
-0.381966
|
0.7029
|
|
TOTAL_ASSETS
|
109.3445
|
24.07966
|
4.540949
|
0
|
|
LEVERAGE
|
0.437989
|
0.206905
|
2.116858
|
0.0356
|
|
R-squared
|
0.104003
|
|
|
|
|
Adjusted R-squared
|
0.089152
|
|
|
|
|
Mean dependent var
|
605.7171
|
|
|
|
|
S.D. dependent var
|
2229.211
|
|
|
|
|
2010
|
|
|
|
|
|
Dependent Variable: PBDITA
|
|
|
|
|
|
Included observations: 194
|
|
|
|
|
|
Variable
|
Coefficient
|
Std. Error
|
t-Statistic
|
Prob.
|
|
RPT_TUNNELING
|
-0.131686
|
0.080776
|
-1.630261
|
0.1047
|
|
RPT_PROPPING
|
0.305226
|
0.117146
|
2.605525
|
0.0099
|
|
TOTAL_ASSETS
|
132.4195
|
26.59641
|
4.97885
|
0
|
|
LEVERAGE
|
0.062471
|
0.587426
|
0.106347
|
0.9154
|
|
R-squared
|
0.097564
|
|
|
|
|
Adjusted R-squared
|
0.083315
|
|
|
|
|
Mean dependent var
|
695.2594
|
|
|
|
|
S.D. dependent var
|
2644.091
|
|
|
|
|
2011
|
|
|
|
|
|
Dependent Variable: PBDITA
|
|
|
|
|
|
Included observations: 195
|
|
|
|
|
|
Variable
|
Coefficient
|
Std. Error
|
t-Statistic
|
Prob.
|
|
RPT_TUNNELING
|
-0.037521
|
0.074546
|
-0.503327
|
0.6153
|
|
RPT_PROPPING
|
0.143106
|
0.090513
|
1.581048
|
0.1155
|
|
TOTAL_ASSETS
|
165.2638
|
34.90656
|
4.734461
|
0
|
|
LEVERAGE
|
-13.223
|
18.36292
|
-0.720092
|
0.4723
|
|
R-squared
|
0.078565
|
|
|
|
|
Adjusted R-squared
|
0.064092
|
|
|
|
|
Mean dependent var
|
859.9741
|
|
|
|
|
S.D. dependent var
|
3435.995
|
|
|
|
|
2012
|
|
|
|
|
|
Dependent Variable: PBDITA
|
|
|
|
|
|
Included observations: 198
|
|
|
|
|
|
Variable
|
Coefficient
|
Std. Error
|
t-Statistic
|
Prob.
|
|
RPT_TUNNELING
|
-0.075593
|
0.068485
|
-1.103801
|
0.271
|
|
RPT_PROPPING
|
0.077707
|
0.070292
|
1.10548
|
0.2703
|
|
TOTAL_ASSETS
|
167.4412
|
33.10326
|
5.058148
|
0
|
|
LEVERAGE
|
-8.50232
|
13.69012
|
-0.621055
|
0.5353
|
|
R-squared
|
0.079399
|
|
|
|
|
Adjusted R-squared
|
0.065163
|
|
|
|
|
Mean dependent var
|
830.9301
|
|
|
|
|
S.D. dependent var
|
3289.79
|
|
|
|
|
2013
|
|
|
|
|
|
Dependent Variable: PBDITA
|
|
|
|
|
|
Included observations: 195
|
|
|
|
|
|
Variable
|
Coefficient
|
Std. Error
|
t-Statistic
|
Prob.
|
|
RPT_TUNNELING
|
-0.027088
|
0.032167
|
-0.842107
|
0.4008
|
|
RPT_PROPPING
|
0.05432
|
0.035307
|
1.538502
|
0.1256
|
|
TOTAL_ASSETS
|
161.1229
|
33.48164
|
4.812277
|
0
|
|
LEVERAGE
|
-25.23116
|
23.50462
|
-1.073455
|
0.2844
|
|
R-squared
|
0.081762
|
|
|
|
|
Adjusted R-squared
|
0.06734
|
|
|
|
|
Mean dependent variable
|
839.0974
|
|
|
|
|
S.D. dependent variable
|
3281.043
|
|
|
|
Conclusion
In this paper we have tried estimating the impact of related party transactions upon the performance of company. Literature says that most RPTs may be responsible for the tunneling or propping but depends whether these transactions are being carried out above market prices or below market prices. Therefore, first we consider RPTs below market prices and categorize them as tunneling RPT or Propping RPT. The relationship between performance and Tunneling RPTs is positive for the period between 2009-2011 and is negative thereafter. The relationship between performance and propping RPTs is negative for the period between 2009-2011 and is positive thereafter. When we consider the above market price transactions the relationship between performance and tunneling RPT is positive only for year 2009 and is negative thereafter. At above market prices, the relationship between performance and propping is positive for all years except 2009.
References
Atanasov, V. A., Black, B. S., & Ciccotello, C. S. (2008). Unbundling and Measuring Tunneling. SSRN eLibrary. doi:10.2139/ssrn.1030529
Atanasov, V., Boone, A., & Haushalter, D. (2010). Is there shareholder expropriation in the United States? An analysis of publicly traded subsidiaries.
Bai, C., & Song, F. M. (2004). Bad News is Good News : Propping and Tunnelling Evidence from China ∗ Bad News is Good News : Propping and Tunnelling Evidence from, (852).
Baysinger, B. D., & Butler, H. N. (1985). The role of corporate law in the theory of the firm. Journal of Law and Economics, 179–191.
Bebchuk, L. A. (1999). A Rent-Protection Theory of Corporate Ownership and Control. National Bureau of Economic Research.
Bebchuk, L. A., Kraakman, R., & Triantis, G. (2000). Stock pyramids, cross-ownership, and dual class equity: the mechanisms and agency costs of separating control from cash-flow rights. In Concentrated corporate ownership (pp. 295–318). University of Chicago Press.
Berle, A. A., & Means, G. G. C. (1932). The modern corporation and private property. Transaction Books.
Bertrand, M., Mehta, P., & Mullainathan, S. (2002). Ferreting Out Tunneling: an Application to Indian Business Groups. The Quarterly Journal of Economics, 117(1), 121–148. doi:10.1007/s10551-008-9934-6
Cheung, Y.-L., Jing, L., Lu, T., Rau, P. R., & Stouraitis, A. (2009). Tunneling and propping up: An analysis of related party transactions by Chinese listed companies. Pacific-Basin Finance Journal, 17(3), 372–393. doi:10.1016/j.pacfin.2008.10.001
Claessens, S., Djankov, S., Fan, J., & Lang, L. (1999). Expropriation of Minority Shareholders in East Asia, 1–57.
Cronqvist, H., & Nilsson, M. (2003). Agency costs of controlling minority shareholders. The Journal of Financial and Quantitative Analysis, 38(4), 695–719. doi:10.2307/4126740
Demsetz, H. (1967). Toward a theory of property rights. The American Economic Review, 57(2), 347–359.
Demsetz, H., & Lehn, K. (1985). The Structure of Corporate Ownership: Causes and Consequences. Journal of Political Economy. doi:10.1086/261354
Faccio, M., Lang, L. H., & Young, L. (2001). Debt and corporate governance. In Meetings of Association of Financial Economics in New Orleans.
Fama, E. F., & Jensen, M. C. (1983a). Agency problems and residual claims. Journal of Law and Economics, 26(2), 327–349.
Fama, E. F., & Jensen, M. C. (1983b). Separation of ownership and control. Journal of Law and Economics, 26(2), 301–325.
Friedman, E., Johnson, S., & Mitton, T. (2003). Propping and tunneling. Journal of Comparative Economics, 31(4), 732–750. doi:10.1016/j.jce.2003.08.004
Gilson, R., & Gordon, J. (2003). Controlling controlling shareholders. University of Pennsylvania Law Review, 152(1), 785–844.
Gomes, A. (2000). Going public without governance: Managerial reputation effects. The Journal of Finance, 55(2), 615–646. doi:10.1111/0022-1082.00221
Gopalan, R., Nanda, V., & Seru, A. (2007). Affiliated firms and financial support: Evidence from Indian business groups. Journal of Financial Economics, 86(3), 759–795.
Grossman, S. J., & Hart, O. D. (1986). The Costs and Benefits of Ownership: A Theory of Vertical and Lateral Integration. Journal of Political Economy. doi:10.1086/261404
Jensen, M. C., & Meckling, W. H. (1976). Theory of the firm: Managerial behavior, agency costs and ownership structure. Journal of Financial Economics. doi:10.1016/0304-405X(76)90026-X
Jian, M., & Wong, T. J. (2008). Propping through related party transactions. Review of Accounting Studies, 15(1), 70–105. doi:10.1007/s11142-008-9081-4
Kali, R., & Sarkar, J. (2005). Diversification, Propping and Monitoring: Business Groups, Firm Performance and the Indian Economic Transition. Working Paper Series No. WP-2005-006. Retrieved from http://www.igidr.ac.in/pdf/publication/WP-2005-006.pdf
Kali, R., & Sarkar, J. (2011). Diversification and tunneling: Evidence from Indian business groups. Journal of Comparative Economics, 39(3), 349–367. doi:10.1016/j.jce.2011.04.001
La, R., Lopez-de-silanes, F., Shleifer, A., & Vishny, R. (2002). Investor Protection and Corporate Valuation, 57(3), 1147–1170.
López de Silanes, F., Johnson, S., La Porta, R., & Shleifer, A. (2000). Tunneling. In American Economic Review Papers and Proceedings (Vol. 90, pp. 22–27).
Morck, R., & Yeung, B. (2003). AGENCY PROBLEMS IN LARGE, (780).
Peng, W. Q., Wei, K. C. J., & Yang, Z. (2011). Tunneling or propping: Evidence from connected transactions in China. Journal of Corporate Finance, 17(2), 306–325. doi:10.1016/j.jcorpfin.2010.08.002
Porta, R. La, Lopez-de-Silanes, F., & Shleifer, A. (1999). Corporate Ownership around the World. The Journal of Finance, 54(2), 471–517. doi:10.2307/2697717
Riyanto, Y. E., & Toolsema, L. A. (2008). Tunneling and propping: A justification for pyramidal ownership. Journal of Banking and Finance, 32(10), 2178–2187.
Sarkar, J., & Sarkar, S. (2011). Corporate governance in India. SAGE India.
Shirur, S. (2011). Tunneling vs Agency Effect: A Case Study of Enron and Satyam, 36(3), 9–21.
Schulze, W. S., Lubatkin, M. H., Dino, R. N., & Buchholtz, A. K. (2001). Agency Relationships in Family Firms: Theory and Evidence. Organization Science, 12(2), 99–116. doi:10.1287/orsc.12.2.99.10114
Siegel, J., & Choudhury, P. (2012). A Reexamination of Tunneling and Business Groups: New Data and New Methods. Review of Financial Studies, 25(6), 1763–1798. doi:10.1093/rfs/hhs008
Slovin, M. B., & Sushka, M. E. (1993). Ownership concentration, corporate control activity, and firm value: Evidence from the death of inside blockholders. The Journal of Finance, 48(4), 1293–1321.
Thomsen, S., & Pedersen, T. (1998). Industry and ownership structure. International Review of Law and Economics, 18(4), 385–402.
Ying, Q., & Wang, L. (2013). Propping by controlling shareholders, wealth transfer and firm performance: Evidence from Chinese listed companies. China Journal of Accounting Research, 6(2), 133–147. doi:10.1016/j.cjar.2013.02.001
Young, M., Peng, M., Ahlstrom, D., & Bruton, G. (2002). Principal-principal agency. In Academy of Management Annual Meetings. Denver, CO.