A Refereed Monthly International Journal of Management
A Time Series Analysis on the Relation between Foreign Direct Investment & Total
Factor Productivity Growth of the Indian Organised Manufacturing Sector: 1980-81
to 2010-11
AUTHORS
|
Narasingha Das
Research Scholar, Dept. of Economics, Vidyasagar University, West Bengal, India.
Email- narasinghadas@gmail.com
A Time Series Analysis on the Relation between Foreign Direct Investment & Total
Factor Productivity Growth of the Indian Organised Manufacturing Sector: 1980-81
to 2010-11
|
Abstract
This paper attempts to measure productivity performance of the Indian Manufacturing
Industry during the period 1980-81 to 2010-11. To measure total factor productivity
growth& various other related performance indicators a non-parametric approach,
namely, Malmquist Data Envelopment Analysis has been used.A comparative analysis
between the pre (1980-81 to 1990-1991)& post liberalisation (1991-92 to 2010-11)
era has also been taken up in this study. The paper also seeks to examine the impact
of foreign direct investment on the overall total factor productivity growth of
the Indian Manufacturing Industry. The present study shows a positive TFP growth
for the entire period. But, again, there is a fall in the TFPG from pre to post-liberalisation
period.Interestingly, we observed a positive impact of foreign direct investment
on total factor productivity growth for the Indian Manufacturing Industries.
Key Words: Indian Manufacturing Industry, Total Factor Productivity,
Malmquist index, Data Envelopment Analysis, FDI.
JEL Classification: C14, C32, D24.
Introduction:
The impact on the host economy of investment by multinational enterprises remains
an unresolved and debated issue (Aghion et al. 2006, Bitzer and Görg 2005).
Some countries and industries benefit significantly from foreign entry in terms
of productivity and knowledge spillovers. Others benefit less or are even hurt.
While academics tend to treat FDI as a homogenous capital flow, policy makers, on
the other hand, seem to believe that some FDI projects are better than others. National
policies toward foreign directinvestment (FDI) seek to attract some types of FDI
and regulate other types in a pattern which seems to reflect a belief among policymakers
that FDI projects differ greatly in terms of the national benefits to be derived
from them. UNCTAD’s World Investment Report 2006 for instance describes “quality
FDI” as “the kind that would significantly increase employment, enhance
skills and boost the competitiveness of local enterprises.”
While in theory the nexus between FDI and growth (in terms of output and productivity)
is in general positive, the empirical literature is far less conclusive. Some studies
find positive effects from outward FDI for the investing country (Van Pottelsberghe
and Lichtenberg, 2001; Nachum et al., 2000), but suggest a potential negative impact
from inward FDI on the host country. This results from a possible decrease in indigenous
innovative capacity or crowding out of domestic firms or domestic investment. Thus,
in their view and in line with the standard literature on the determinants of FDI
(i.e. Dunning’s OLI paradigm, see Dunning 1988) inward FDI is intended to
take advantage of host country (locational) characteristics instead of disseminating
new technologies originating in the sending country. Other studies report more positive
findings: Nadiri (1993) finds positive and significant effects from US sourced capital
on productivity growth of manufacturing industries in France, Germany, Japan and
the UK. Also Borensztein et al. (1998) find a positive influence of FDI flows from
industrial countries on developing countries’ growth. However, they report
also a minimum threshold level of human capital for the productivity enhancing impact
of FDI, emphasizing the role of absorptive capacity. Absorptive capacity or minimum
threshold levels in a country’s ability to profit from inward FDI is often
mentioned in the literature (see also Blomström et al. 1996). Consequently
the effect of FDI depends among other things to a large extent on the characteristics
of the country that receives FDI. However, the resulting issue of cross-country
heterogeneity has largely been neglected in the literature so far with few exceptions.
Blonigen and Wang (2005) stress explicitly cross-country heterogeneity as the crucial
factor which determines the effect of FDI on growth. Further, Nair-Reichert and
Weinhold (2001) and Mayer-Foulkes and Nunnenkamp (2005) explicitly take up this
aspect in their analysis. Our paper will follow their direction and introduce two
forms of heterogeneity, differences between countries and differences between receiving
industries.
We argue that since host country heterogeneity plays a role, it is equally likely
that the impact of FDI on the host economy differs greatly according to the receiving
industry. FDI in constant returns to scale industries will have different effects
than FDI in increasing returns to scale industries. Likewise, the effect of FDI
may be related to the technology and human capital intensity of the industry and
other factors. As a very intuitive example, heavy FDI in the extractive sector in
Nigeria has not improved the country’s growth performance (Akinlo, 2004).
Consequently, the potential for positive spillovers does not solely depend on a
country’s overall absorptive capacity, but also on which sectors or industries
in the economy receive FDI. Thus, the impact of FDI differs depending on country
specific absorptive capacity or stage of development as well as on the sectoral
and industrial structure and allocation of FDI. Since the two are in general related,
this implies a relationship between the industrial pattern of inward FDI and its
effect on the host country. The economy wide effect of industry specific FDI inflows
will then further depend on the extent of intra-industry versus inter-industry spillovers.
Brief Survey on Literature:
The concept of technical efficiency indicates the degree of success in the utilization
of productive resources. Technical efficiency is considered to be an important determinant
of productivity growth and international competitiveness in any economy (Taymaz
and Saatci, 1997). There are different schools of thought in estimating the technical
efficiency. Technical efficiency consists of maximizing the level of production
that can be obtained from a given combination of factors. In the Indian context,
number of studies examined the technical efficiency of the manufacturing industry,
e.g., Page (1984), Little et al. (1987), Patibandla (1998), Mitra (1999), Agarwal
(2001), and Mitra et al. (2002), Bhandari et al. (2007a, 2007b) and many others.
Krishna and Mitra (1998) investigated the effects on competition and productivity
of the dramatic 1991 trade liberalization in case of Indian manufacturing industries.
Using firm-level data from a variety of industries, they find some evidence of an
increase in the growth rate of productivity. Driffield and Kambhampati (2003) estimate
frontier production functions for six manufacturing industries. Their findings suggest
an increase in overall efficiency in five out of the six manufacturing industries
in the post-reform period. Mukherjee and Ray (2005) examined the efficiency dynamics
of a ‘typical’ firm in individual states during the pre and post-reform
period. Their findings establish no major change in the efficiency ranking for different
states after the reforms was initiated. Using a panel dataset of 121 Indian manufacturing
industries from 1981 to 1998, Pattnayak and Thangavelu (2005) find evidence of total
factor productivity improvements for most of the industries after the reform period.
While the 1991 economic reform was radical, India adopted a gradualist approach
to reform, meaning a frustratingly slow pace of implementation (Ahluwalia, 2002).
It suggests that it is more appropriate to examine the effect of liberalization
on manufacturing sectors’ efficiency using a longer time span for both pre
and post-reform. How did this economic reform program shifted Indian manufacturing
into global stage and influencing technical and scale economies of major industries?
In answering this question, we employ a nonparametric approach in explaining productivity
changes, technical progress and scale efficiencies of industries within the sector.
In this paper, we examine the impact of liberalization on the technical efficiency
of Indian Manufacturing industry by comparing pre and post economic reform periods.
Analysis of technical efficiency of manufacturing industries in developing countries
has received considerable attention in the economic literature in recent years.
Recent literature includes Onderet al. (2003) for Turkey, Pham et al. (2009) for
Vietnam, Margonoet al. (2010) for Indonesia, and Mastromarco (2008) for developing
countries among others. Technical efficiency is concerned with how closely the production
unit operates to the frontier for the production possibility set. The historical
roots of a rigorous approach to efficiency measurement can be traced to the works
of Debreu (1951) and Farrell (1957). Over the past three decades, a variety of approaches,
parametric and non-parametric, have been developed to investigate the failure of
producers to achieve the same level of efficiency. For a detailed survey on such
methodologies, see Kalirajan and Shand (1999). In parametric models, one specifies
an explicit functional form for the frontier and econometrically estimates the parameters
using sample data for inputs and output, and hence the accuracy of the derived technical
efficiency estimates is sensitive to the nature of the functional form specified.
In contrast, the method of Data Envelopment Analysis (DEA) introduced by
-
Charneset al. (1978) and further generalized by Banker et al. (1984) offers a non-parametric
alternative to parametric frontier production function analysis. A production frontier
is empirically constructed using linear programming methods from observed input-output
data of sample decision making units (DMUs). In this study, we adopt the output-oriented
(OO) DEA that seeks the maximum proportional increase in output production, with
input levels held fixed. Lovell (1996) gives a clear description of how the DEA
based Malmquist approach implements such decomposition.
In this regard, to judge the relation between the total factor productivity growth
(TFP) and foreign direct investment (FDI), though there is a lack of literature,
we reviewed some important works which expose the relation between these two factors
for other countries.
In a first set of studies, the relation between FDI and industrial growth is analysed
at a city (Démurger 1996a, Wei 1994 and 1996) or a provincial level (Démurger
1996b and 2000, Modyand Wang 1997).
Wei (1994), shows that between 1988 and 1990 the level of FDI contributed more to
differences in nominal industrial output than did exports. He specifically notes
that such investment results in a spill-over oftechnological and managerial know-how
between firms in the same city.
Moreover, Wei (1996) finds that a 1 percent increase in the share of FDI in relation
with industrial output in 1988 has been associated with a 0.32 percent higher growth
rate in output between 1988 and 1990 and that about 20% of the difference between
the cities’ output growth could be explained by the difference in the share
of FDI’s in output.
Démurger (1996a) confirms,within an augmented production function framework,
the predominant short-term impact of FDI in annual average growth rates of real
industrial output. Moreover, the paper not only points out the overall predominance
of FDI but also indicates that in the short run, the contribution of FDIto industrial
growth tends to dominate, and even replace, that of exports. It also tests whether
the influence of export growth on industrial growth depends upon the relative size
of foreigninvestment. Results indicate that the marginal effect of export growth
on industrial growth is reduced where FDI is relatively high and thus suggest that
FDI could have been a substitute to exports as a growth factor, at least at the
end of the 80s.
At a provincial level, Démurger (1996b) investigates the relation between
industrial growth and opening-up for 19 provinces over the 1983-92 period. The results
show that i) both FDI and exports have a positive contribution to industrial productivity
and that, at least in the short term, FDI has a higher contribution than exports
and that ii) FDI has a positive effect on the domestic accumulation of capital.
It indeed explains almost half of the variations in total investment and does not
appear as a substitute for domestic capital, but rather as a stimulus. The hypothesis
of a crowding-out effect on domestic investment can thus be rejected for the studied
period.
Furthermore, Démurger (2000) gives an explanation of the economic growth
of Chinese provinces up to the mid-90s based on the dynamics between FDI and growth,
as well as on a dynamics due to the geographical propagation of growth itself. The
evaluation of the interdependence of growth between Chinese provinces and, within
provinces, between cities gives an additional explanation for the Chinese growth
process since inter-provincial propagation of growth reinforces the dynamism of
coastal provinces, but also contributes to the overall growth process.
Finally, using sector data, Mody and Wang (1997) also show that FDI – as a
percentage of population – has a significant impact in the short-term on industrial
output growth. However,they also observe that the effect of FDI tends to decrease
in a longer term. Their interpretation of this result is that in the short-term,
FDI is the most mobile factor and is therefore a dominant driving force for growth.
On the other hand, over the longer term, variables such as education and infrastructure
respond to the rise in demand for complementary assets and the contribution of FDI
diminishes. Finally, they underline the fact that the effectiveness of education
is enhanced when it is associated with the foreign expertise that accompanies investment.
Another part of the empirical literature on the role of FDI in industry focuses
on the relative efficiency of foreign-funded firms and their impact on domestic
firms.
Within this literature, the research work carried out by Sun (1998) provides an
extensive assessment of FDI impact on China’s economy, and more precisely
on industry. Sun (1998, chapter 5) notably highlights the differences between the
characteristics and performances of FIEs and those of domestic firms, especially
SOEs. FIEs have a higher capital intensity than domestic firms do in all sectors,
indicating a higher technology content of the production process. Moreover, the
investigation of productive efficiency in different categories of firms, carried
out on the basis of the 1995 Census data, shows that the average productivity of
both labour and capital in FIEs is respectively 2.8 and 2.2 times higher than that
of State-owned enterprises. It also shows that the elasticity of output with regard
to labour and capital is greater in FIEs than in SOEs, thus suggesting a better
technical and management efficiency.
In a similar perspective, Fan (1999, chapter 5) gives estimations of total factor
productivity (TFP) growth by ownership categories (state-owned, collective and foreign-funded
enterprises). Using industrial level data on 28 manufacturing industries for 20
provinces throughout the 1993-95 period, she particularly shows that the “foreign
category” experienced the highest TFP growth (with an average of 4.9 % per
year), the gap between domestic and FDI firms being higher in capital intensive
industries. Furthermore, investigating the issue of technological spill-over from
foreign to domestic firms, Fan (1999, chapter 7) shows that positive andsignificant
spill-over appears only in industries “which are mainly labour-intensive and
have alow to moderate technology gap between Chinese and foreign firms” (p.
169).
In a comparative perspective too, Zhang and Zheng (1998) carry out an investigation
centred on the impact of multinational enterprises (MNEs) on industrial structure
and efficiency. They note that since 1992 the pattern of FDI inflows has undergone
significant changes, due to the fact that MNEs have massively entered the Chinese
market and initiated a structural adjustment in the form of a reallocation of resources
from labour intensive to more capital intensive sectors. They compare the performance
of a selected sample of MNEs’ affiliates in China with that of all enterprises
and other FIEs on the basis of the 1995 census. MNEs’ affiliates are found
to be more profitable (profit/sales) and less export-oriented than other FIEs. Compared
to all industrial firms and to all FIEs, their production is more concentrated in
the sectors with the highest degree of capital intensity (assets per capita). Their
distribution across sectors shows that they are relatively specialised in transport
equipment, electric and electronic goods. Estimating the statistical relation between
several structural variables, and the sector distribution of MNEs and large and
medium-sized domestic enterprises, the study finds a positive correlation between
the share of MNEs in sales and labour productivity, profitability, average wage,
the level of education of employees, R&D expenditures, concentration ratio and
size effects. Although these relations do not give any information about the direction
of causation, they suggest that marginal changes in MNEs sales share will be associated
with an increase in the related variables.
The in-depth analysis of the determinants of technical efficiency in Chinese manufacturingindustries,
made by Sun et al. (1999), confirms the observation of a higher efficiency in FIEs.Using
the Data Envelopment Analysis approach (DEA), Sun et al. (1999) compute technical
efficiency scores for 28 manufacturing industries across 29 provinces in 1995 and
compare them across sectors and provinces. The industry-based comparison indicates
that on average,textile, timber processing and non-ferrous metal industries have
lower technical efficiency scores while the provincial comparison shows that the
most efficient provinces are on average coastal ones. Sun et al. then look at the
determinants of technical efficiency differentials across provinces and industries
and find some evidence on the role of economic openness. Their results thus generally
confirm the positive relationship between economic openness, measured either by
the export-output ratio or the share of FDI in total equity, and technical efficiency
in light manufacturing industries located in the coastal region (rather than in
hinterland).
The presence of FIEs has thus a direct positive effect on industrial performance.
As shown by Sun (1998, chapter 6), FIEs also have indirect effects through their
linkages with domestic sectors. According to this investigation, FIEs are located
in industrial sectors which have high backward linkage indices and output multipliers
(as derived from input-output table of China in 1992) and thus, have strong potential
linkage effects on the domestic economy. FIEs, which are now important industrial
producers, contribute to the growth of the domestic sectors through their input
demand to domestic firms. The case studies of car industry and electronic sectors
confirm this observation as they show the relatively high local content of inputs
used in FIEs.
The localisation of inputs in major automobile FIEs has considerably increased in
the 90s (and reached 80% in Shanghai Volkswagen in 1993). In electronic industry,
the top ten FIEs also show high rates of input localisation. The localisation rates
are generally higher in TVproduction, and lower in more technically complex products,
indicating that there is still scopefor improving the technological capacities of
domestic firms.
Finally, the analysis made by Wu (2000) on 10 coastal provinces over the period
from 1983 to 1995 gives a complementary view of the temporal evolution of FDI efficiency.
The performance indicator for FDI, derived from a production frontier method, particularly
shows a few interesting patterns. First, for all provinces, it follows an increasing
trend over time, which indicates that while FDI efficiency was relatively poor in
the 80s, it has improved and converged across the 10 provinces during the 90s. By
1995, all coastal provinces thus tended
-
to use foreign capital rather efficiently. Second, on a province-to-province basis,
Shanghai appears as the best performer in terms of FDI efficiency since the late
80s.
McKinsey, 2005, argued that the US automotive industry is a sector that was significantly
exposed to foreign competition and benefited from it recently. The Big Three’s
responses to competitive threats from Japanese, German and Korean manufacturers
were largely responsible for increases in sector labor productivity in 1987-2002.
Rising 3.3% a year in the period, productivity growth in the US production of new
vehicles was substantially faster than 2.1% growth rate achieved by the non-farm
business sector. Process improvements, most notably changes in physical plants necessary
for adoption of “lean production”, were responsible for almost half
of productivity growth1, although it took 10-15 years for the Big Three to implement
the new methods. While capital deepening accounted for only 10% of productivity
growth in 1987-1996, it caused 60% of that growth in 1997-2002.
The experience of the Czech electronics industry was different. In many ways it
didn’t benefit from the entry of world-class players such as Philips and Panasonic.
These companies largely undertook contract manufacturing and invested little in
R&D. The R&D intensity of foreign affiliates is substantially lower than
that of domestic firms and below the average for the Czech manufacturing. For the
economy as a whole, foreign ownership was found to have a significant negative impact
on propensity to conduct R&D (UNCTAD, Srholec 2005).
Long run growth can only be increased through technological and population growth
and if FDI positively influences technology, then it will be growth advancing (Solow
1956).
Somwaru and Makki (2004) indicate that according to recent endogenous growth theory,
FDI can be growth advancing if it results in increasing returns in production through
spillover and technological transfers via diffusion processes.
In addition, Easterly et al. (1995) argue that technology transfer depends on the
diffusion process and that can take place through four modes: transfer of new technologies
and ideas; high technology imports; foreign technology adoption; and level of human
capital.
Findlay (1978) presents the contagion effect of managerial practices and advanced
technology introduced by foreign firms on the host country’s technology.
A recent study by Banga (2005) demonstrates that FDI, trade and technological progress
have differential impact on wages and employment. While higher extent of FDI in
an industry leads to higher wage rate in the industry, it has no impact on its employment.
On the other hand, higher export intensity of an industry increases employment in
the industry but has no effect on its wage rate. Technological progress is found
to be laboursaving but does not influence the wage rate. Further, the results show
that domestic innovation in terms of research and development intensity has been
labor utilizing in nature but import of technologyhas unfavorably affected employment
in India. Rajit Kumar Sahoo (2005) has pointed out that FDI has a direct and indirect
impact and on a certain particular sectors of the economy. A study on the impact
of FDI on manufacturing sector reveals that FDI inflows in chemicals, electrical
and electronics shows direct impact and FDI inflow in drugs and pharmaceutical sectors
shows indirect impact (spillover effects). FDI is an important vehicle for the transfer
of technology and knowledge and it demonstrates that it can have a long run effect
on growth by generating increasing return in production via positive externalities
and productive spill overs. Thus, FDI can lead to a higher growth by incorporating
new inputs and techniques (Feenstra and Markusen, 1994).
Research Gap:
In this backdrop, our study is an attempt to find out the relationship between FDI
and the total factor productivity growth for the overall Indian manufacturing industries.
Presently, when we survey the literature on this relationship, we find that there
is a dearth of literature on this particular aspect for Indian case. So, our study
makes an attempt to fill the gap in the existing literature.
Objectives of the Study:
The major objectives of our study are:
- To assess the total factor productivity growth of the Indian manufacturing industries
during the Pre as well as post reform period.
- To examine the long-run & causal relationship between total factor productivity
growth (TFPG) & foreign direct investment (FDI) for the Indian manufacturing
sector.
Section 2 deals with the methodological issues. Section 3 analyses the results obtained..
Lastly, Section 4 deals with summary & conclusion of our study.
-
Methodology:
2.1. Model Of TFPG Estimation:
Description of Data & Measurement of Variables:
The present study is based on manufacturing industry-level time
series data taken from several issues of Annual Survey of Industries, National Accounts
Statistics, CMIE and Economic Survey, Statistical Abstracts (several issues), RBI
bulletin etc. covering a period of 31 years commencing from 1980-81 to 2010-11.
Selection of time period is largely guided by availability of data. The entire period
is sub-divided into two phases as 1980-81 to 1990-91, 1991-92 to 2010-11 (Pre-reform
phase and Post-reform phase). Sub-divisions of total period is being taken logically
as such to assess conveniently the impact of reforms on total factor productivity
growth and employment.
Now, output in this context is measured as real gross value added index. The GDP
deflator has been used as the deflator of gross value added.
In this study Labour index is formed as a weighted sum of number of heads in two
groups (Workers & Other employees), weights being the relative group remunerations.
Relevant data is obtained from ASI & Indian Labour Statistics.
So far as capital input is concerned, we have taken into account the perpetual inventory
method. In our study, real gross fixed capital stock is taken as the measure of
capital input. Deflator used is obtained from data on GFCF at current and constant
prices. Data for the above purpose are obtained from various issues of ASI &
NAS published by CSO, Govt. of India.
Now, as discussed earlier in the literature section, FDI is an important vehicle
for the transfer of technology and knowledge and it demonstrates that it can have
a long run effect on growth bygenerating increasing returns in production via positive
externalities and productive spillovers. Thus, FDI can lead to a higher growth by
incorporating new inputs and techniques. Technology transfer through FDI depends
on the diffusion process that can take place through four modes: transfer of new
technologies and ideas; high technology imports; foreign technology adoption; and
level of human capital. So it is quite natural that based on these four modes there
may be enhancement of the total factor productivity growth for the manufacturing
industries. The data on foreign direct investment (FDI) is obtained from Secretariat
of Industrial Assistance (SIA’s), several issues, published by the Department
of Industrial Policy & Promotion, Govt. of India, Ministry of Commerce &
Industry.
Econometric Specification:
The conventional setup of Färeet al. (1992) is adopted in modelling the problem
as transformation of a vector of inputs xt∈ into a vector of output
yt∈ .The production technology at each time period t, denoted St,
is identified as the set of all technologically feasible input-output combinations
at time t (Lovell, 1996). It is constructed from the data as:
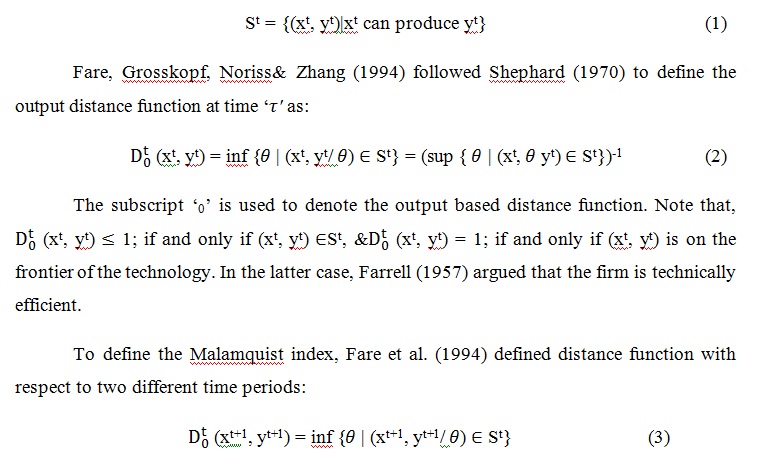
-
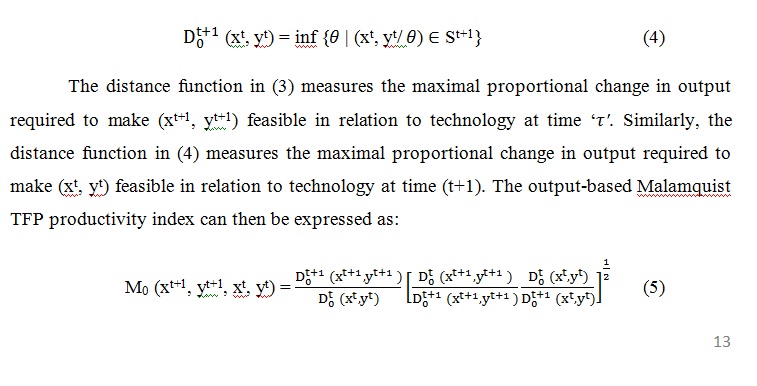
The term outside the brackets shows the change in technical efficiency while the
geometric mean of the two ratios inside the brackets measures the shift in technology
between the two period ‘t’ & ‘t+1’; this could be called
technological progress. So :

In each of the formulas i.e., equation (6) & (7), a value greater than one indicates
a positive growth of TFP (an improvement) from a period ‘t’ to ‘t+1’
and a value smaller than one represents deteriorations in performance over time.
We can decompose the total factor productivity growth in following way as well:
MTFPI = Technical Efficiency change X Technical Change
(Catching up effect) (Frontier effect)
MTFPI is the product of measure of efficiency change (catching up effect) at current
period ‘t’ and previous period ‘s’ (average geometrically)
and a technical change (frontier effect) as measured by shift in a frontier over
the same period. The catching up effect measures that a firm is how much close to
the frontier by capturing extent of diffusion of technology or knowledge of technology
use. On the other side frontier effect measures the movement of frontier between
two periods with regards to rate of technology adoption. In DEA-Malmquist TFP Index
does not assume all the firms or sectors are efficient so therefore any firm or
sector can be performing less than the efficient frontier. In this methodology we
will use the output oriented analysis because most of the firms and sectors have
their objective to maximize output in the form of revenue or profit. It is also
assumed that there is constant return to scale (CRS) technology to estimate distance
function for calculating Malmquist TFP index and if technology exhibits constant
return to scale (CRS), the input based and output based Malmquist TFP Index will
provide the same measure of productivity change.
2.2. Time Series Econometric tests to assess the nature of the relationship
between TFP and FDI:
Step – I: The Stationarity Test (Unit Root Test):
It is suggested that when dealing with time series data, a number of econometric
issues can influence the estimation of parameters using OLS. By regressing a time
series variable on other time series variables using OLS estimation can result in
a very high R2, although there is no meaningful relationship between
the variables. This situation reflects the problem of spurious regression between
totally unrelated variables generated by a non-stationary process. Therefore, prior
to testing Cointegration and implementing the Granger Causality test, econometric
methodology needs to examine the stationarity; for each individual time series.
Most macroeconomic data are non-stationary, i.e., they tend to exhibit a deterministic
and/or stochastic trend. Therefore, it is recommended that a stationarity (unit
root) test be carried out to test for the order of integration. A series (Xt)
is said to be stationary if the mean and variance are time-invariant. A non-stationary
time series will have a time dependent mean or make sure that the variables are
stationary, because if they are not, the standard assumptions for asymptotic analysis
in the Granger test will not be valid. Therefore, a stochastic process that is said
to be stationary simply implies that the mean [E(Xt)] and the variance
[var (Xt)] of X remain constant over time for all t, and the covariance
[cov(Xt, Xs)] i.e., the correlation between any two values
of X taken from different time periods depends on the difference apart in time between
the two values for all t≠s. Since standard regression analysis requires that
data series be stationary, it is obviously important that we first test for this
requirement to determine whether the series used in the regression process is a
difference stationary or trend stationary.
To test the stationary of the variables, we use the Augmented Dickey Fuller
(ADF)test, Phillips-Perron Unit Root Test&Dickey
Fuller test with GLS detrending.
Now, once the number of unit roots in the series is decided, the next step before
applying Johansen’s (1988) cointegration test is to determine an appropriate
number of lags to be used in estimation since the choice of lag length is crucial
in the Johansen procedure. In selection of appropriate lag length, standard literature
follows either Akaike Information Criteria (AIC) or Bayesian Information Criteria
(BIC) which is also known as Schwarz Information Criteria (SIC) or both. In our
study, the appropriate lag length is selected on the basis of Schwarz Information
Criteria (SIC) as we are more interested to identify the true model rather than
to find out the best approximating model to the unknown data generating process
which AIC actually gives (Henry de-Graft Acquah, 2009). Another reason is that,
AIC does not depend directly on sample size. Bozdogan (1987) noted that because
of this, AIC lacks certain properties of asymptotic consistency. Although BIC takes
a similar form like AIC, it is derived within a Bayesian framework, reflects sample
size and have properties of asymptotic consistency. For reasonable sample sizes,
BIC apply a larger penalty than AIC, thus other factors being equal it tend to select
simple models than does AIC. From a Bayesian view point this motivates the adoption
of the Bayesian information criteria. Bickel & Zhang (1992) & Zhang (1993)
demonstrate that BIC is consistent whilst in contrast AIC is not.
Step – II:The Cointegration Test
Regression on non stationary variables is permitted if their linear combination
is stationary. It has been recognized in recent literature that if a linear combination
of integrated variables is stationary then such variables are said to be cointegrated.
Although Engle and Granger (1987) was the first to introduce the cointegration test,
the tests propounded by Stock and Watson (1988), Johanson (1991) and Johansen and
Juselius (1990) are more useful in testing the long run equilibrium relationships
in multivariate setting.
Step III: The Granger Causality Test:
Causality is a kind of statistical feedback concept which is widely used in the
building of forecasting models. Historically, Granger (1969) and Sim (1972) were
the ones who formalized the application of causality in economics. Granger causality
test is a technique for determining whether one time series is significant in forecasting
another (Granger, 1969). The standard Granger Causality Test (Granger, 1988) seeks
to determine whether past values of a variable helps to predict changes in another
variable. The definition states that in the conditional distribution, lagged values
of Yt add no information to explanation of movements of Xt
beyond that provided by lagged values of Xt itself (Green, 2003). We
should take note of the fact that the Granger causality technique measures the information
given by one variable in explaining the latest value of another variable. In addition,
it also says that variable Y is Granger caused by variable X if variable X assists
in predicting the values of variable Y. if this is the case, it means that the lagged
values of variable X are statistically significant in explaining variable Y. The
null hypothesis (H0) that we test in this case that X variable does not
Granger cause variable Y and variable Y does not Granger cause variable X.
Empirical Results of MTFP Growth:
In this section, we have calculated total factor productivity growth and its component
using Malmquist Productivity Index under two inputs- labour & capital and one
output framework. Estimation of annual TFP growth rate of Indian manufacturing industries
for the pre as well as post-reform period at aggregate level are presented in Table:
1, Table: 2 & Table: 3 respectively.
Table: 1 – Malmquist Index Summary of Annual Means for the Entire Period
|
Year
|
EFFCH
|
TECHCH
|
PECH
|
SECH
|
TFPCH
|
|
1980-81
|
-
|
-
|
-
|
-
|
-
|
|
1981-82
|
1.000
|
1.177
|
1.000
|
1.000
|
1.177
|
|
1982-83
|
1.000
|
0.974
|
1.000
|
1.000
|
0.974
|
|
1983-84
|
1.000
|
1.088
|
1.000
|
1.000
|
1.088
|
|
1984-85
|
1.000
|
0.923
|
1.000
|
1.000
|
0.923
|
|
1985-86
|
1.000
|
1.017
|
1.000
|
1.000
|
1.017
|
|
1986-87
|
1.000
|
0.947
|
1.000
|
1.000
|
0.947
|
|
1987-88
|
1.000
|
1.083
|
1.000
|
1.000
|
1.083
|
|
1988-89
|
1.000
|
1.004
|
1.000
|
1.000
|
1.004
|
|
1989-90
|
1.000
|
1.146
|
1.000
|
1.000
|
1.146
|
|
1990-91
|
1.000
|
1.039
|
1.000
|
1.000
|
1.039
|
|
1991-92
|
1.000
|
1.110
|
1.000
|
1.000
|
1.110
|
|
1992-93
|
1.000
|
1.038
|
1.000
|
1.000
|
1.038
|
|
1993-94
|
1.000
|
0.918
|
1.000
|
1.000
|
0.918
|
|
1994-95
|
1.000
|
1.361
|
1.000
|
1.000
|
1.361
|
|
1995-96
|
1.000
|
1.014
|
1.000
|
1.000
|
1.014
|
|
1996-97
|
1.000
|
0.973
|
1.000
|
1.000
|
0.973
|
|
1997-98
|
1.000
|
0.917
|
1.000
|
1.000
|
0.917
|
|
1998-99
|
1.000
|
0.954
|
1.000
|
1.000
|
0.954
|
|
1999-2000
|
1.000
|
0.798
|
1.000
|
1.000
|
0.798
|
|
2000-01
|
1.000
|
0.871
|
1.000
|
1.000
|
0.871
|
|
2001-02
|
1.000
|
1.149
|
1.000
|
1.000
|
1.149
|
|
2002-03
|
1.000
|
0.879
|
1.000
|
1.000
|
0.879
|
|
2003-04
|
1.000
|
1.112
|
1.000
|
1.000
|
1.112
|
|
2004-05
|
1.000
|
1.211
|
1.000
|
1.000
|
1.211
|
|
2005-06
|
1.000
|
1.197
|
1.000
|
1.000
|
1.197
|
|
2006-07
|
1.000
|
1.040
|
1.000
|
1.000
|
1.040
|
|
2007-08
|
1.000
|
1.024
|
1.000
|
1.000
|
1.024
|
|
2008-09
|
1.000
|
0.996
|
1.000
|
1.000
|
0.996
|
|
2009-10
|
1.000
|
0.949
|
1.000
|
1.000
|
0.949
|
|
2010-11
|
1.000
|
0.902
|
1.000
|
1.000
|
0.902
|
|
Mean
|
1.000
|
1.020
|
1.000
|
1.000
|
1.020
|
Source: Authors own estimates by using DEAP software, version 2.1
From Table-1, we find that the annual average TFPG for the Indian manufacturing
sector for the entire period under study (1980-81 to 2010-11) is positive and it
is 2.0. From Table-2, for the pre-reform period (1980-81 to 1990-91) the annual
average TFPG is also positive and it is 3.70.
Table: 2 – Malmquist Index Summary of Annual Means for the Pre-reform Period
|
Year
|
EFFCH
|
TECHCH
|
PECH
|
SECH
|
TFPCH
|
|
1980-81
|
-
|
-
|
-
|
-
|
-
|
|
1981-82
|
1.000
|
1.177
|
1.000
|
1.000
|
1.177
|
|
1982-83
|
1.000
|
0.974
|
1.000
|
1.000
|
0.974
|
|
1983-84
|
1.000
|
1.088
|
1.000
|
1.000
|
1.088
|
|
1984-85
|
1.000
|
0.923
|
1.000
|
1.000
|
0.923
|
|
1985-86
|
1.000
|
1.017
|
1.000
|
1.000
|
1.017
|
|
1986-87
|
1.000
|
0.947
|
1.000
|
1.000
|
0.947
|
|
1987-88
|
1.000
|
1.083
|
1.000
|
1.000
|
1.083
|
|
1988-89
|
1.000
|
1.004
|
1.000
|
1.000
|
1.004
|
|
1989-90
|
1.000
|
1.146
|
1.000
|
1.000
|
1.146
|
|
1990-91
|
1.000
|
1.039
|
1.000
|
1.000
|
1.039
|
|
Mean
|
1.000
|
1.037
|
1.000
|
1.000
|
1.037
|
Source: Authors own estimates by using DEAP software, version 2.1
Table: 3 – Malmquist Index Summary of Annual Means for the Post-reform Period
|
Year
|
EFFCH
|
TECHCH
|
PECH
|
SECH
|
TFPCH
|
|
1991-92
|
1.000
|
1.110
|
1.000
|
1.000
|
1.110
|
|
1992-93
|
1.000
|
1.038
|
1.000
|
1.000
|
1.038
|
|
1993-94
|
1.000
|
0.918
|
1.000
|
1.000
|
0.918
|
|
1994-95
|
1.000
|
1.361
|
1.000
|
1.000
|
1.361
|
|
1995-96
|
1.000
|
1.014
|
1.000
|
1.000
|
1.014
|
|
1996-97
|
1.000
|
0.973
|
1.000
|
1.000
|
0.973
|
|
1997-98
|
1.000
|
0.917
|
1.000
|
1.000
|
0.917
|
|
1998-99
|
1.000
|
0.954
|
1.000
|
1.000
|
0.954
|
|
1999-2000
|
1.000
|
0.798
|
1.000
|
1.000
|
0.798
|
|
2000-01
|
1.000
|
0.871
|
1.000
|
1.000
|
0.871
|
|
2001-02
|
1.000
|
1.149
|
1.000
|
1.000
|
1.149
|
|
2002-03
|
1.000
|
0.879
|
1.000
|
1.000
|
0.879
|
|
2003-04
|
1.000
|
1.112
|
1.000
|
1.000
|
1.112
|
|
2004-05
|
1.000
|
1.211
|
1.000
|
1.000
|
1.211
|
|
2005-06
|
1.000
|
1.197
|
1.000
|
1.000
|
1.197
|
|
2006-07
|
1.000
|
1.040
|
1.000
|
1.000
|
1.040
|
|
2007-08
|
1.000
|
1.024
|
1.000
|
1.000
|
1.024
|
|
2008-09
|
1.000
|
0.996
|
1.000
|
1.000
|
0.996
|
|
2009-10
|
1.000
|
0.949
|
1.000
|
1.000
|
0.949
|
|
2010-11
|
1.000
|
0.902
|
1.000
|
1.000
|
0.902
|
|
Mean
|
1.000
|
1.012
|
1.000
|
1.000
|
1.012
|
Source: Authors own estimates by using DEAP software, version 2.1
Table-3 represents the annual average TFPG of the Indian Manufacturing industries
and it is 1.2. Therefore we can say that there is a fall in the TFPG from pre to
post reform period. This results reveals that decline in the industry’s TFPG
is due to its productivity based frontier capability.
3.2 Empirical results from the causal relationship between
change in foreign direct investment and change in total factor productivity growth
for the Indian Manufacturing Industry:-
From unit root testing, we have the following results as presented in Table 3.2.1,
3.2.3& 3.2.4.
Table 3.2.1: Results from ADF Unit Root Test
|
Variables
|
Intercept Only
|
Trend & Intercept
|
|
Level
|
1st Difference
|
Level
|
1st Difference
|
|
ΔTFP
|
-5.031369*
|
-9.610398*
|
-4.944927*
|
-9.432294*
|
|
ΔFDI
|
-1.921073
|
-4.308293*
|
-1.635656
|
-5.240784*
|
Source: Authors own estimate. (*, **, *** represents the significance level at 1%,
5% & 10% respectively)
The result of ADF unit root tests is presented in Table-3.2.1. Each variable is
tested in their level & first difference with intercept only and trend &
intercept. It is found that the null hypothesis of unit roots cannot be rejected
at conventional significance levels for FDI. Therefore it can be concluded that
all series are stationary at level i.e., all the series are I(1). For the ADF test,
the optimum lag selection is based on Schwartz Information Criterion. Table 3.2.2
suggest that the appropriate lag length is 2 for the total factor productivity and
for FDI the appropriate lag length is 1.
Table 3.2.2: Selection of Appropriate Lag Length by SIC
|
Lags
|
SIC
|
|
ΔTFP
|
ΔFDI
|
|
Intercept Only
|
Trend & Intercept
|
Intercept Only
|
Trend & Intercept
|
|
1
|
0.594739
|
0.479411
|
4.745224*
|
4.803730*
|
|
2
|
0.472002*
|
0.350986*
|
4.904462
|
4.969009
|
Source: Authors own estimate
The asterisks (*) in the table 3.2.2 indicates the best (that is, minimized) values
of the SIC.
Table 3.2.3: Results from Phillips-Perron Unit Root Test
|
Variables
|
Intercept Only
|
Trend & Intercept
|
|
Level
|
1st Difference
|
Level
|
1st Difference
|
|
ΔTFP
|
-5.052008*
|
-9.610398*
|
-4.971133*
|
-9.432214*
|
|
ΔFDI
|
-1.906710
|
-10.39929*
|
-4.333240*
|
-17.86455*
|
Source: Authors own estimate. (*, **, *** represents the significance level at 1%,
5% & 10% respectively)
The result of Phillips-Perron unit root tests is presented in Table-3.2.3. Each
variable is tested in their level & first difference with intercept only and
trend & intercept. It is found that the null hypothesis of unit roots cannot
be rejected at conventional significance levels for FDIs. Thus it can be concluded
that all series are stationary at level i.e., all the series are I(1).
Table 3.2.4: Results from DF- GLS detrending Unit Root Test
|
Variables
|
Intercept Only
|
Trend & Intercept
|
|
Level
|
1st Difference
|
Level
|
1st Difference
|
|
ΔTFP
|
-4.598083*
|
-7.565914*
|
-4.862391*
|
-9.102501*
|
|
ΔFDI
|
-0.975706
|
-5.936419*
|
-1.249187
|
-5.948666*
|
Source: Authors own estimate. (*, **, *** represents the significance level at 1%,
5% & 10% respectively)
The result of DF-GLS detrending unit root tests is presented in Table-3.2.4. Each
variable is tested in their level, first difference and second difference with intercept
only and trend & intercept. It is found that the null hypothesis of unit roots
also cannot be rejected at conventional significance levels for the ΔFDI.
Therefore it can be concluded that all series are stationary at their level i.e.,
all the series are I(1).
Results from Cointegration Test:
Having established the time series properties of the data, the test for presence
of long-run relationship between the variables using the Johansen Cointegration
test is conducted. The Johansen approach can determine the number of cointigration
vectors for any given number of non-stationary variables of the same order. The
results reported in Table-3.2.5.suggests that the null hypothesis of no cointegrating
vectors can be rejected at 1% level of significance. It can be seen from the trace
statistics that we have one co-integration equation at both 1% and 5% level.
Table 3.3.5: Johansen Cointegration Test Results
|
Hypothesized
|
|
Trace
|
5 Percent
|
1 Percent
|
|
No. of CE(s)
|
Eigenvalue
|
Statistic
|
Critical Value
|
Critical Value
|
|
|
|
|
|
|
|
None **
|
0.623142
|
30.98047
|
25.32
|
30.45
|
|
At most 1**
|
0.618507
|
17.658024
|
12.25
|
16.26
|
|
|
|
|
|
|
|
Trace test indicates 1 cointegrating equation (s) at both 5% and 1% levels
|
|
*(**) denotes rejection of the hypothesis at the 5%(1%) level
|
|
|
|
From Johansen Co integration test result the normalized co integration equation
can be written as:
ΔTFP= 2.768683 + 0.619896 ΔFDI
(3.12*) (2.91*)
From the above normalized cointegration equation we can say that one unit change
in FDI leads to 0.62 unit change in TFP for the Indian Manufacturing industry. t-statistics
are given in the parenthesis which are also significant at l% (*) level of significance.
Thus we can say that there is a long-run relationship between total factor productivity
growth and foreign direct investment for the Indian manufacturing industries.
Findings from Granger Causality Test:
The results of Pair wise Granger Causality between ΔTFP and ΔFDI for
the Indian Manufacturing industry are presented in Table-3.2.6. The results reveal
that there is a unidirectional causal relationship between change in TFP and change
in FDI. Our result confirms that change in FDI is the Granger cause of change in
TFP at lag 2, 3 & 4.
Table 3.2.6: Granger Causality test Results
|
Null Hypothesis
|
Lag
|
Observations
|
F-Statistics
|
Probability
|
Decision
|
|
ΔFDI does not Granger Cause Real wage rate ΔTFP
|
1
|
30
|
1.1007
|
0.1590
|
Accept
|
|
2
|
29
|
4.8999
|
0.0216
|
Reject
|
|
3
|
28
|
4.20891
|
0.0281
|
Reject
|
|
4
|
27
|
4.10091
|
0.0298
|
Reject
|
|
ΔTFP does not Granger Cause ΔFDI
|
1
|
30
|
0.08902
|
0.7270
|
Accept
|
|
2
|
29
|
0.40231
|
0.6501
|
Accept
|
|
3
|
28
|
0.37881
|
0.8289
|
Accept
|
|
4
|
27
|
0.91890
|
0.1771
|
Accept
|
Source: Authors own estimate.
- Summary & Conclusion:
The following are the major findings of our study:
First, the result on the overall productivity displays a declining trend of MTFPG
in post reform period as compared to pre reform period for the Indian Manufacturing
industry. Therefore, it may be concluded that the liberalization policies has its
adverse impact on the overall Indian manufacturing industry’s TFP growth.
Second, our result also confirms a significant causal and long-run relationship
between foreign direct investment and total factor productivity for the Indian Manufacturing
industry. The direction of causality is from FDI to real TFP growth.
Therefore, FDI act as an ingredient of total factor productivity growth for the
Indian Manufacturing Industries.
References:
Acquah H. de-Graft. (2010), Comparison of Akaike information criterion (AIC) and
Bayesian information criterion (BIC) in selection of an asymmetric price relationship,
Journal of Development and Agricultural Economics Vol. 2(1) pp. 001-006, January,
2010
Agarwal, R.N. (2001), Technical efficiency and productivity growth in the central
public sector enterprises in India during 1990s, Discussion Paper No.28/2001, Institute
of Economic Growth, New Delhi.
Aghion, Philippe; Blundell, Richard; Griffith, Rachel; Howitt, Peter and Prantl,
Susanne (2006).“The Effects of Entry on Incumbent Innovation and Productivity”.
NBER Working Paper 12027
Aitken Brian and Harrison Ann (1999). „Do Domestic Firms Benefit from FDI?
Evidence from Venezuela“. American Economic Review 89
Ahluwalia, I.J.1985, Industrial Growth in India, Oxford University Press, Delhi.
Ahluwalia, M.S. (2002), Economic reforms in India since 1991: has gradualism worked?
Journal of Economic Perspectives, 16(3), pp. 67-88.
Akaike H (1973). Information Theory and an Extension of the Maximum Likelihood Principle.
In: B.N. Petrov and F. Csaki (eds.) 2nd International Symposium on Information
Theory: 267-81 Budapest: AkademiaiKiado.
Balasubramanyam, V. N., M. Salisu and D. Sapsford (1999). “Foreign Direct
Investment as an Engine of Growth,” The Journalof International Trade &
Economic Development, 8,1, 27 40.
Banga, R. (2005) Impact of Liberalization on Wages and Employment in Indian Manufacturing
Industries, Working Paper No. 153, New Delhi: ICRIER.
Banker, R.D., Charnes, A., and Cooper, W.W. (1984), Some models for estimating technical
and scale inefficiencies in data development analysis, Management Science, 30(9),
pp.1078-1092.
Besley, T. and Burgess, R. (2004), Can labor regulation hinder economic performance?
Evidence from India, The Quarterly Journal of Economics, 119(1), pp.91-134.
Bitzer, Jurgen and Görg, Holger (2005).“The Impact of FDI on Industry
Performance“. University of Nottingham (unpublished manuscript)
Benfratello, Luigi and Sembenelli, Alessandro (2005). “Foreign Ownership and
Productivity: Is the Direction of Causality so Obvious?”. University of Torino
(unpublished manuscript)
Bhandari, A. K., and Maiti, P. (2007a), “Efficiency of Indian Manufacturing
Firms: Basic Metal Industry as a Case Study”, International Journal of Business
and Economics, 6 (1), 71-88.
Bhandari, A. K., and Ray, S. C. (2007b), “Technical Efficiency in the Indian
Basic Metals Industry: A Nonparametric Analysis of Firm-Level Data”, Department
of Economics .Working Paper Series: 49, University of Connecticut, USA.
Bickel.P, Zhang.P (1992).Variable selection in nonparametric regression with categorical
covariates. J. Am. Stat. Assoc. 87: 90–97.
Bozdogan.H (1987). Model Selection and Akaike’s Information Criterion (AIC):
The General Theory and Its Analytical Extensions. Psychometrika (52)3: 345-370.
Borensztein E. and J. Ostry (1996), “Accounting for China’s Growth Performance,”
American Economic Review, Vol. 86, No.2, 224-28.
Brahmananda, P.R.(1982): Productivity in Indian Economy: Rising inputs for falling
outputs. Himalaya Publishing House.
Broadman H. G. and X. Sun (1997), “The Distribution of Foreign Direct Investment
in China”, The World Economy, Vol. 20, No. 3, May, 339-361.
Chen C. H. (1996), “Regional determinants of foreign direct investment in
Mainland China”, Journal of Economic Studies, Vol. 23, No. 2, 18-30.
Chow G. C. (1993), “Capital Formation and Economic Growth in China,”
Quarterly Journal of Economics, Vol. 103, No. 3, 809-42.
Coughlin C. C. and E. Segev (2000), “Foreign Direct Investment in China: A
Spatial Econometric Study”, The World Economy, Vol. 23, No. 1, January, 1-23.
Démurger S. (1996a), “Différencesrégionales de la croissanceindustrielle
en Chine”, Revue d’Economie du Développemnt, No. 1-2, June.
Démurger S. (1996b), “On the role of openness in the Chinese industrial
growth process: A city-level assessment”, Étudeset Documents, Ec.96.04,
CERDI-IDREC, Clermont-Ferrand, France.
Démurger S. (2000), Economic Opening and Growth in China, OECD Development
Centre Studies, Paris, March.
Dickey, D.A., Fuller, W.A. (1979). Distribution of the estimators for the autoregressive
time series with a unit root. Journal of the American Statistical Association, 74,
427-431.
Dickey, D.A., Fuller, W.A. (1981). Distribution of the estimators for the autoregressive
time series with a unit root.Econometrica, 49, 1057-1072.
Driffield, N.L. and Kambhampati ,U.S. (2003), Trade liberalization and the efficiency
of firms in Indian manufacturing, Review of Development Economics, 7(3), pp.419-430.
Elliott, Graham, Rothenberg, Thomas J., and James H. Stock.(1996) Efficient Tests
for an Autoregressive Unit Root. Econometrica, 64:4, pp.813-836.
Engle, R. F.,&Granger, C.W. J. (1987). Cointegration and error correction: representation,
estimation, and testing. Econometrica, 251–276.
Färe, R. and Lovell, C.A.K. (1978), Measuring the technical efficiency of production,
Journal of Economic Theory, 19(1), pp.150-162.
Färe, R., Grosskopf,S. Lindgren, B. and Roos P. (1992), Productivity changes
in Swedish pharmacies 1980-1989: a non-parametric Malmquist approach, Journal of
ProductivityAnalysis, 4, pp.85-101.
Färe, R., Grosskopf, S. Norris, M. and Zhang Z. (1994), Productivity growth,
technical progress and efficiency change in industrialized countries, American Economic
Review, 84, pp.66-83.
Farrell, M.J. (1957), The measurement of productive efficiency, Journal of the Royal
Statistical Society, 120(3), pp.253-290.
Fikkert, B. and Hasan, R. (1998).Returns to scale in a highly regulated economy:
evidence from Indian firms, Journal of Development Economics, 56, 51-79.
Findlay, R. (1978), “Relative Backwardness, Direct Foreign Investment and
the Transfer of Technology: A Simple Dynamic Model.” Quarterly Journal of
Economics, 92: 1-16.
Goldar, B. Kumari, S. (2002), ‘Import Liberalization and Productivity Growth
in Indian Manufacturing Industries in the 1990s’, Working Paper E/219/2002,
Institute of Economic Growth, Delhi, India.
Goldar, B. (2004), Productivity trends in Indian manufacturing in the pre and post
reform periods, Working Paper No.137, Indian Council for Research on International
Economic Relations (ICRIER), New Delhi, India.
GörgHolger and Kerekes Monika (2005).“Does FDI Transfer Technology Across
Borders.A Reexamination”. Free University of Berlin Discussion Paper No. 2005/7
Granger, C. W.J., (1969), “ Investigation Causal Realtions by Econometrics
Model and Cross Spectral Methods”, Econometrica, 37, 424-438
Griliches, Z and Y. Ringstad (1971), Economics of scale and the form of the production
function, North Holland, Amsterdam
Hu, Chan G and Bharat Trehan., (1995), “ Modeling the Time Series Behaviour
of the Aggregate Wage Rate”, Federal Reserve Bank of San Francisco, Economic
Review, 3-13.
Kalirajan, K.P. and Shand, R.T. (1999), Frontier production functions and technical
efficiency measures, Journal of Economic Surveys, 13(2), pp.149-172.
Kalirajan, K.P., and Shand, R.T. (2001), Technology and farm performance: paths
of productive efficiencies over time, Agricultural Economics, 24(3), pp.297-306.
Lin J. Y., F. Cai and Z. Li (1996), The China Miracle, The Chinese University Press,
Hong Kong.
Lovell, K.C.A. (1996), Applying efficiency measurement techniques to the measurement
of productivity change, Journal of Productivity Analysis, 7, pp.329-340.
Mody A. and F. Y. Wang (1997), “Explaining Industrial Growth in Coastal China:
Economic Reforms... and What Else?”, The World Bank Economic Review, Vol.
11, No. 2, May, 293-325.
Mitra, A. (1999), Total factor productivity growth and technical efficiency in Indian
industries, Economic and Political Weekly, Vol.34 No.31, pp.
Mitra A., A. Varoudakis and M-A.Véganzonès (1998), “State Infrastructure
and Productive Performance in Indian Manufacturing”, OECD Technical Paper,
139, August, Paris.
Krishna, P. and Mitra, D. (1998), Trade liberalization, market discipline and productivity
growth: new evidence from India, Journal of Development Economics ,56(2), 447-462.
Kumar Sunil., (2012), “Regional Variations in Labor Productivity Growth in
Indian Manufacturing Sector”. Anvesak, 32(2), 111 – 136
Mukherjee, D. and Majumder, R. (2007), Efficiency, technological progress and regional
comparative advantage: a study of the organized manufacturing sector in India, Asia-Pacific
Development Journal, 14(2), pp.23-54.
Mukherjee, K. and Ray, S.C. (2005), Technical efficiency and its dynamics in Indian
manufacturing: an inter-state analysis, Indian Economic Review, 40(2), 101-125.
Nehru V. and A. Dhareshwar (1994), “New Estimates of Total Factor Productivity
Growth for Developing and Industrial Countries”, World Bank Policy Research
Working Paper, No. 1313, June.
Onder, O.A., Deliktas, E. and Lenger, A. (2003), Efficiency in the manufacturing
industry of selected provinces in Turkey: a stochastic frontier analysis, Emerging
Markets Financeand Trade, 39(2), pp.98-113.
Page, J.M. (1984), Firm size and technical efficiency: applications of production
frontiers to Indian survey data, Journal of Development Economics, 16(1), 129-152.
Patibandla, M. (1998), Structure, organizational behavior, and technical efficiency:
the case of an Indian industry, Journal of Economic Behavior& Organization,
34(3), 419-434.
Pattnayak, S.S. and Thangavelu S.M. (2005), Economic reform and productivity growth
in Indian manufacturing industries: an interaction of technical change and scale
economies, Economic Modelling, 22(4), 601-615.
Phillips, P.C.B. and P. Perron (1988). “Testing for Unit Roots in Time Series
Regression,” Biometrika, 75, pp.335-346.
Pindyck, Robert S and D.L.Rubinfeld., (1998), “ Econometrics Model and Economic
Forecasts” Irwin McGraw-Hill, Singapore.
Schwarz G (1978). Estimating the Dimension of a Model. Annals of Statistics 6: pp.461–464.
Solow, R.M. (1956), “A Contribution to the Theory of Economic Growth”,
The Quarterly Journal of Economics, Vol. 70, No. 1. (Feb., 1956), pp. 65-94.
Sun H. (1998), Foreign Investment and Economic Development in China: 1979-1996,
Ashgate.
Sun H., P. Hone and H. Doucouliagos (1999), “Economic openness and technical
efficiency”, Economics of Transition, Vol. 7, No. 3, 615-636.
Taymaz, E. and Saatci, G. (1997), Technical change and efficiency in Turkishmanufacturing
industries, Journal of Productivity Analysis, 8, pp.461-475.
Unel, B. (2003), Productivity trends in India’s manufacturing sectors in the
last two decades, Working Paper No.03/22, International Monetary Fund (IMF), USA.
UNCTAD (1999). World Investment Report 1999.
UNCTAD (2005).World Investment Report 2005.“Transnational Corporations and
the Internationalization of R&D.”
Wei S. J. (1994), “The Open Door Policy and China’s Rapid Growth: Evidence
from City-Level Data”, in T. Ito and A. O. Krueger (eds.), Growth Theories
in Light of the East AsianExperience, The University of Chicago Press, Chicago and
London.
Wei S. J. (1996): “Foreign Direct Investment in China: Sources and Consequences”,
in T. Ito and A. O. Krueger, Financial Deregulation and Integration in East Asia,
NBER, The University of Chicago Press.
Wei Z. B., O. Varela and M. K. Hassan (2002), "Ownership and performance in Chinese
manufacturing industry", Journal of Multinational Financial management, 12, 61-78.
World Bank (1997), World Development Report 1997: The State in a Changing World,
New York: Oxford University Press.
Zhang F. and J. Zheng (1998), “The Impact of Multinational Enterprises on
Economic Structure and Efficiency in China”, China Centre for Economic Research,
Discussion Paper No. E1998007.
Zhang.P (1993).On the convergence of model selection criteria.Comm.Stat.-Theory
Meth. 22: pp.2765-2775.

