|
Dr. Falguni H. Pandya Assistant professor, Centre for Management Studies, Dharmsinh Desai University, Nadiad, Gujarat Postal Address B.No. 45, Gayatri Nagar Society, Nr. G E B, Maktampur Road, Bharuch-392012 Email: fhpandya@gmail.com (m) 0 9913879766 |
The paper has attempted to document the market behavior and the psychology of individual decision making. The study was undertaken to investigate the possibility of overreaction for selected time interval. In an attempt to study the market efficiency of NSE, it was investigated whether individuals behave in violation of Bayers’ rule and such behavior affects stock prices. Based on the monthly return data of NSE, it was found that market follows contrarian investment movement and this evidence questions presence of weak form of EMH in Indian market. However, such evidence was found largely for long-term portfolio and poorly proves for medium term portfolio. For a short-term portfolio, it can be said that overreaction hypothesis is rejected.
The Efficient Market Hypothesis (EMH) concept coined by Fama (1969) advocate that at any given time share prices fully, fairly and rapidly reflect all historical and all new information as and when it comes. This theory is further confirmed by random walk theory which says that as share prices move in a random fashion it is impossible to earn abnormal return by predicting future share prices movement based on past prices movement. As a result, EMH says that an investor can earn only average return by using all available information. The weak-form of EMH says that the share prices reflect all historical information such as past share price movement and trading history and it is futile to study past price movement and predict future share price movement in order to outperform the market and earn abnormal return. It further says that as market moves in a random manner no trend or pattern is formed. There are tests like run test, serial correlation test, filter test etc to test whether the market is weak form efficient or not. (Pandya, 2013).
It has been noted that both market behavior and psychology of investors’ decision making is characterized and displayed by ‘overreaction’. As per Bayers’ rule, over reaction or reaction means correct reaction to new information. However, it is now very well documented that Bayers’ rule is not only exclusive criterion to study how individuals respond to new information. As per Kahneman and Tversky (1982), individuals tend to overweight recent information and underweight past or prior information data. It has been observed that analysts and market participants are sometimes very much optimistic for ‘good’ performing stocks and are very bearish for bad performing stocks and as a result stocks that have been depressed for some time are usually wonderful value players.
Despite the evidence that support the weak form of EMH, technical analysts or chartists have shown evidence of various patterns such as head and shoulders, reverse bottom, cup and handle, flag, symmetrical triangle etc that occur repeatedly over time. Similar to this, study by De Bondt and Thaler (1985) empirically proved that market shows strong reversal pattern, as portfolios formed of loser stocks (worst performing stocks) tend to outperform portfolio of winner stocks (best performing stocks).
Contrary to EMH, contrarian investment strategy and momentum investment strategy says that market moves in certain pattern and it is possible to earn superior return based on that. Contrarian investment strategy says that ‘today’s losers are tomorrow’s winners and today’s winners are tomorrow’s losers and therefore it is claimed that buy today’s losers and sell today’s winners to earn superior profit. Contrary to contrarian strategy, momentum strategy says that today’s winners will be tomorrow’s winners and today’s losers will be tomorrow’s losers and therefore investment strategy should be buy today’s winners and sell today’s losers to earn return.
Many researchers have shown evidence that average stock returns are related to past performance. Seminal work done by De Bondt and Thaler (1985) suggested to buy today’s losers and sell tomorrow’s winners. Research by De Bondt and Thaler (1985, 1987) discovered substantial weak form market inefficiencies as it was found that the portfolios of shares showing worst performance over the last three to five years subsequently outperformed the best performing portfolios of the past periods. In other words, prior losers outperform prior winners. This strong reversal phenomenon resembles head and shoulder pattern of technical analysis. Authors proved return reversal over long horizons and found that firms with poor past returns of three to five year period earn higher average returns than firms that performed well in the past. In that response, research by Fama and French (1996) showed that long-term return reversals could be consistent with a multifactor model of returns. However, model shown by the authors could not explain medium term performance. Chan et al (1996) attempted to address this issue in their research and found reasons for medium term return continuation. They found that for that under reaction to earnings information is responsible.
Jegadeesh and Titman (1993) confirmed the evidence of contrarian strategy in the long term but also showed evident of momentum strategy to generate abnormal profit in the short run (3 to 12 months). Further research by Jegadeesh and Titman (2001) reaffirmed that momentum strategy does not generate abnormal return beyond twelve months period. Study by considering US market data, Conrad and Kaul (1993) found that contrarian strategy is profitable for long term (two to five years or more than that) and short term intervals (weekly or monthly); while momentum strategy is profitable for medium term intervals ( three to twelve months interval). Confirming this, empirical evidence by Joshipura (2009) supported overreaction led momentum profits in the short run and contrarian profits in the long run. Moreover, the research found that the presence of contrarian and momentum returns could not be associated with risk adjustment only.
Chang (1995) tested contrarian strategy for Japanese market and said that it generates abnormal profit. Confirming to Chang (1995); study by Chui (2000) further showed evidence of earning abnormal return in Japanese and Korean market. Similar to this, Hameed and Ting (2000) empirically found existence of contrarian movement in Malaysia. Kang (2002) said that short-term abnormal return is generated by this contrarian strategy in China. However, findings by Hameed and Kusandi (2002) rejected evidence of contrarian profits in Pacific Basin markets. Similar to Hameed and Kusandi (2002); evidence by Griffin and Martin (2005) concluded no or negligible evidence of abnormal return by contrarian strategy in non-US countries. The research said that it does not exist in Asia also.
Rouwenhorst (1998) documented evidence of international return continuation in a sample of 12 European countries for the period 1980 to 1995 and it was found that an internationally diversified portfolio of past winners outperformed a portfolio of past losers by about 1 percent per month.
Bernstein(1985) said that the results of De Bondt and Thaler (1985) are convincing and most impressive; the authors have not justified some elements of the marketplace that would enrich the analysis. Author argued that the stock market in particular is highly efficient in rapidly incorporating information that effect on prices in the short run even if it fails to process more complex and longer run information in an efficient manner. Finally, author concluded that the Efficient Market Hypothesis justifies markets behavior in the short run even if it rejects the hypothesis in the long run.
Unlike De Bondt and Thaler (1985); Kryzanowski and Zhang (1992) found statistically significant continuation behavior for the next one and two years for winners and losers, and insignificant reversal behavior for winners and losers over longer formation of up to ten years. Chan (1988) found no strong evidence in support of the hypothesis. Author further noted that an investor follows the contrarian strategy is likely to find that his or her risk exposure varies inversely with the level of economic activity. In addition, on an average, the investor realizes above market returns, but that excess return is likely to be a normal compensation for the risk in the investment strategy.
Study by Grinblatt et al (1995) analyzed the extent to which mutual funds purchase stocks based on their past returns as well as their tendency to exhibit herding behavior and found that 77 percent of mutual funds were momentum investors and purchased those stocks which were past winners and most sold past losers. On an average, it was found that funds that invested on momentum realized significantly better performance than other funds. The research also found relatively weak evidence that funds tended to buy and sell the same stocks at the same time.
Based on the extant review of literature it was decided to study contrarian and momentum investment strategy in Indian context as no enough empirical evidence was noted in Indian context except empirical testing performed by Joshipura (2009). The following objective was tested for the study.
Objective
To examine whether market overreacts or not and to find out the presence of contrarian and/or momentum movement in the Indian market for portfolios constructed for short term, medium term and long term period.
Data and Methodology
There are number of evidences noted in developed and developing economies about over reaction and momentum strategies. In this paper, an attempt has been made to study the same for Indian market. The study attempts to test whether contrarian strategies exists in the Indian market or not as the research carried out earlier indicated no significant evidence for Asian and non-US market.
The overreaction hypothesis explains two well-known consequences of the markets. To test the presence of contrarian profits in the Indian market, it is required to measure the performance of winners and losers portfolio over the next 6 month, 1 year and so on. Here it was attempted to measure the presence of contrarian strategy by constructing portfolios of winners and losers stocks for a short to long term.
Steps in methodology are explained using three-year formation and three-year performance period. For that, all 30 stocks of Sensex were considered for the study for the formation of short term, medium term and long-term portfolio. For the present study, 25 stocks out of 30 stocks of Sensex were considered in order to maintain the consistency of the samples throughout the studied period. The period considered for the study is from October 2006 to September 2015.
For the above mentioned period, monthly prices were collected for Sensex and stock; and return was calculated. After that, abnormal return (AR) of given security with respect to market was calculated.
These excess returns are a measure of the stockholder’s actual return minus return generated from market. The daily excess return or abnormal return for the security is estimated by
ARit= Rit – Rmt (ii)
Where t=time considered for the study, ARit =abnormal return on the security for the day t, Rit =actual return on the security for time t; Rmt = return generated by the market model for time t.
Finally cumulative abnormal return (CAR) was computed based on the abnormal return. Daily cumulative abnormal returns (CAR) are the sum of the average abnormal return over event time. Cumulative Abnormal Return (CAR) is the cumulative sum of stock i’s prediction error
(Abnormal returns) over the selected period.
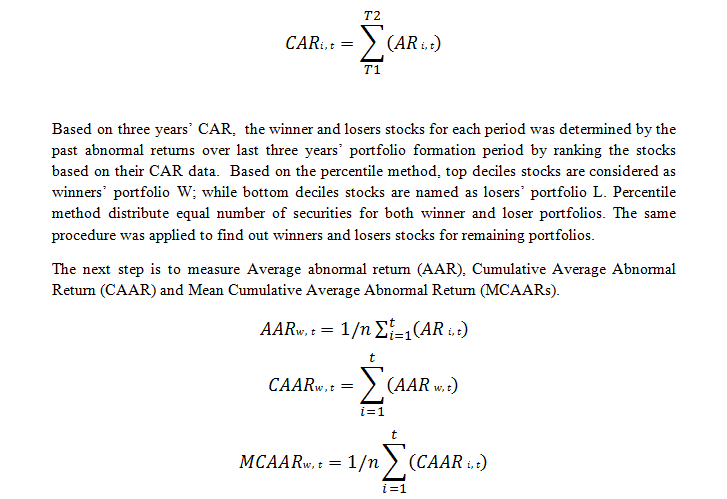
Where n indicates number of stocks in a portfolio, t shows time considered for the study. The same calculation was applied to loser portfolio too.
For a long term portfolio, period considered for the study is (1) From October 2006 to September 2009, and from October 2009 to September 2012, (2) From October 2007 to September 2010 and from October 2010 to September 2013, (3) From October 2008 to September 2011 and from October 2011 to September 2014 and (4) From October 2009 to September 2012 and from October 2012 to September 2015. For each four portfolios, the first half time period is known as formation period (e.g. From October 2006 to September 2009) while remaining half is considered as performance period (e.g. from October 2009 to September 2012). From this portfolio formation and portfolio performance period, it can be realized that two year is an overlapping period for each of the set studied here. Overlapping increases sample for the study and thus improves reliability of the study. Moreover, it works against overreaction and thus increases rigidness of the analysis. Thus, four sets and eight portfolios based on monthly data were formed for the period mentioned above.
Similarly, for medium term portfolios period considered for the study is same (October 2006 to September 2015); but eight sets and sixteen portfolios were formed with the period of one year. These portfolios were constructed for the period (1) From October 2006 to September 2007 and from October 2007 to September 2008; (2) From October 2007 to September 2008 and from October 2008 to September 2009; (3) From October 2008 to September 2009 and from October 2009 to September 2010; (4) From October 2009 to September 2010 and from October 2010 to September 2011; (5) From October 2010 to September 2011 and from October 2011 to September 2012; (6) From October 2011 to September 2012 and from October 2012 to September 2013; (7) From October 2012 to September 2013 and from October 2013 to September 2014 and (8) From October 2013 to September 2014 and from October 2014 to September 2015.
Here for each set, first half shows the formation period and second half shows the portfolio performance period. From the above set of eight portfolios, it can be realized that performance period of portfolio one is formation period of portfolio two and so on.
In a similar way, seventeen sets and thirty four portfolios were formed to test the strategy based on short-term time. These portfolios were constructed for the period From October 2006 to March 2007 and from April 2007 to September 2007 and so on. Like medium term portfolio, in short-term portfolio also; performance period of portfolio one becomes the formation period of portfolio two and so on.
Results and Discussion
Table 1: Winner and Loser Portfolio for Long term Period
|
Loser Portfolio |
Winner Portfolio |
|||
|
Formation |
Performance |
Formation |
Performance |
|
|
Portfolio |
MCAAR |
MCAAR |
MCAAR |
MCAAR |
|
1 |
-19.16% |
9.10% |
56.51% |
-19.29% |
|
2 |
-6.98% |
-3.14% |
55.97% |
7.61% |
|
3 |
-37.82% |
8.89% |
44.78% |
17.45% |
|
4 |
-38.01% |
9.45% |
20.37% |
-16.21% |
(Source: Author’s Calculation)
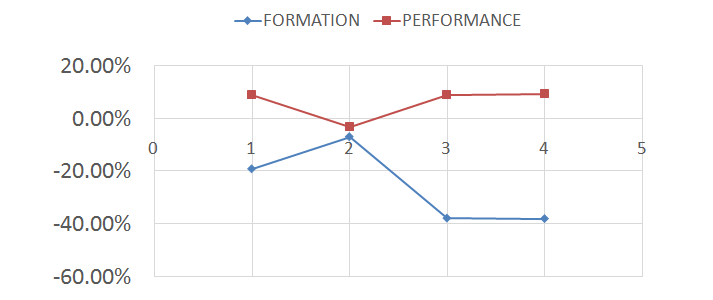
From above table and the figure it can be realized that loser portfolio consistently give negative return in the formation period while in testing or performance period it generates positive return or at least less negative return. Thus, out of four portfolios, three portfolios that were generating negative return have revert with positive return. The behavior of losers portfolios in longer-term results in to winners’ portfolio meaning today’s losers are tomorrow’s winners.
Figure 1: MCAAR of Loser Portfolio (Long Term)
Portfolios of the winner stocks which were providing whooping average abnormal return in the range of 20.37 percent to 56.51 percent; shows very dissatisfying performance and provides return in the range of -19.29 percent to 17.45 percent. Two portfolios namely portfolio one and four have tended in to negative return generating portfolios with the return of -19.29 percent and -16.21 percent respectively. Further, remaining two portfolios namely portfolio two and three have shown drastic fall in their return. Thus, it can be realized that today’s winners are tomorrow’s losers as best performing stocks have resulted in to worst performing stocks over a three year period. Therefore, it can concluded that in long term both losers portfolios and winners portfolio strongly supports evidence in favor of contrarian investment strategy.
Figure 1: MCAAR of Winner Portfolio (Long Term

(Source: Author’s Calculation)
However, by comparing figure 1 and figure 2, it is realized that losers’ portfolio shows strong reversal of pattern compared to winners’ portfolio.
Table 2: Winner and Loser Portfolio for Medium Term Period
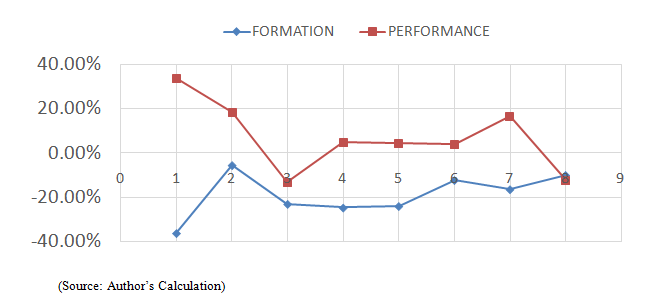
Portfolios formed for a medium term period by overlapping of one-year shows the evidence in favor of contrarian strategy. However, the evidence is clearer in case of current winners’ portfolio than losers’ portfolio.
|
Loser Portfolio |
Winner portfolio |
|||
|
Formation |
Performance |
Formation |
Performance |
|
|
Portfolio |
MCAAR |
MCAAR |
MCAAR |
MCAAR |
|
1 |
-36.36% |
33.59% |
26.32% |
10.55% |
|
2 |
-5.69% |
18.15% |
50.36% |
-5.99% |
|
3 |
-23.17% |
-13.44% |
35.19% |
5.75% |
|
4 |
-24.85% |
4.70% |
16.83% |
-10.93% |
|
5 |
-24.14% |
4.28% |
18.26% |
-0.08% |
|
6 |
-12.43% |
3.69% |
18.73% |
0.25% |
|
7 |
-16.56% |
16.40% |
20.49% |
4.91% |
|
8 |
-10.13% |
-12.52% |
18.08% |
-20.30% |
(Source: Author’s Calculation)
In case of losers’ portfolio, barring results of portfolio three and portfolio eight; return pattern has reversed in performance period compared to formation period. Thus, like long-term portfolios, medium term portfolios prove that market over reacts over a medium term time and therefore it supports contrarian investment strategy. However, when losers’ portfolio performance is compared between long term and medium term, the evidence is more strong in long term. Therefore, it can be concluded that when period considered for the study is not longer enough, evidence in favor of contrarian strategy weakens.
Figure 3: MCAAR of Loser Portfolio (Medium Term)
From the table and the figure of the winners’ portfolio performance for a medium term time period, it is evident that behavior of winners’ portfolio is more clear cut and in favor of contrarian strategy as the portfolios of the winner stocks have provided very good return in the range of 18.08 percent to 50.36 percent in the formation period. The same portfolios’ returns have reverted and have turned either negative or negligible positive in the range of -20.30 percent to 10.55 percent in the performance period.
Figure 4: MCAAR of Winner Portfolio (Medium Term)

(Source: Author’s Calculation)
Thus for the medium term time framework, it can be concluded that portfolios of the winners stocks more accurately support contrarian strategy compared to portfolios of losers stock. Further, when this is compared with long term and medium term it is realized that pattern of winners’ portfolio in medium term strongly favor the overreaction hypothesis.
Table 2: Winner and Loser Portfolio for Short Term Period
From the below table it can be summarized that like medium term portfolio; in short-term portfolio too, losers portfolio shows slightly clearer pattern than winners portfolio. However, by comparing medium term and short-term portfolio with long-term portfolio; it can be concluded that whether market shows evidence of contrarian or investment strategy; more clarity is obtained when period considered for investment is reasonably of longer duration.
|
Losers Portfolio |
Winners Portfolio |
|||
|
Formation |
Performance |
Formation |
Performance |
|
|
Portfolio |
MCAAR |
MCAAR |
MCAAR |
MCAAR |
|
1 |
-10.51% |
-7.43% |
16.87% |
-3.01% |
|
2 |
-28.82% |
13.67% |
15.09% |
5.57% |
|
3 |
-2.31% |
8.97% |
24.13% |
14.75% |
|
4 |
-8.67% |
-2.58% |
32.42% |
8.17% |
|
5 |
-10.65% |
5.36% |
18.20% |
2.14% |
|
6 |
-25.07% |
-3.86% |
30.56% |
10.46% |
|
7 |
-11.34% |
-10.07% |
17.94% |
-7.98% |
|
8 |
-27.45% |
3.68% |
9.22% |
-11.98% |
|
9 |
-16.06% |
-2.14% |
8.10% |
-3.77% |
|
10 |
-16.44% |
5.71% |
13.25% |
5.74% |
|
11 |
-3.13% |
0.11% |
13.17% |
-3.51% |
|
12 |
-11.29% |
0.03% |
7.85% |
-1.25% |
|
13 |
-11.80% |
-8.28% |
12.02% |
4.28% |
|
14 |
-17.57% |
4.73% |
20.03% |
0.27% |
|
15 |
-8.25% |
6.78% |
11.72% |
-3.16% |
|
16 |
-10.30% |
-12.67% |
14.15% |
1.32% |
|
17 |
-25.31% |
-21.77% |
15.65% |
5.92% |
(Source: Author’s Calculation)
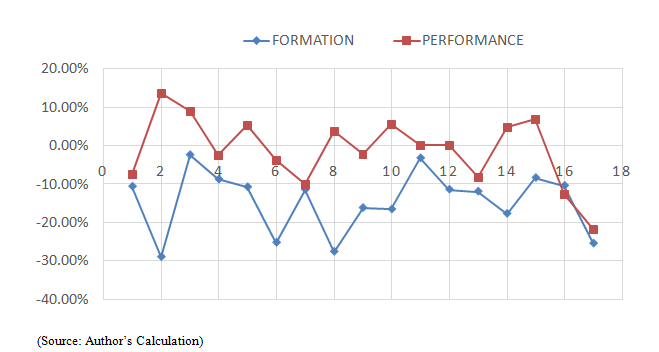
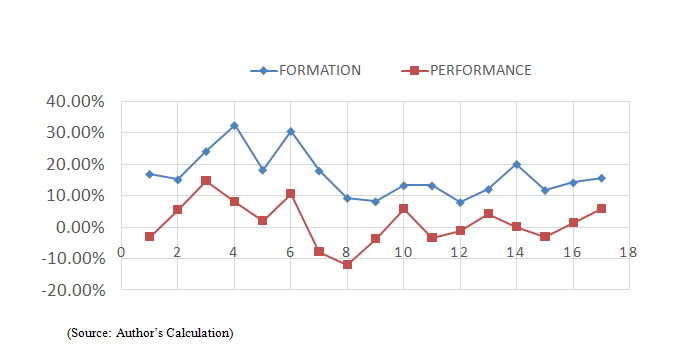
In case of the losers portfolio, out of 17 portfolios which has given negative return in the formation period in the range of -2.31 percent to 28. 82 percent; have poorly revert in the performance period within a range of 0.03 percent to 13.67 percent. Thus, all the losers portfolio of portfolio formation period have not tended to winner portfolios in the performance period as it is evident from the above table that out of 17 portfolios only nine portfolios have given positive return. Further, five portfolios have shown very negligible positive return in the performance period. Contrary, the remaining eight portfolios that has given negative return in the performance period is substantially high.
Figure 5: MCAAR of Loser Portfolio (Short Term)
(Source: Author’s Calculation)
In case of winners’ portfolio, all seventeen portfolios which have given positive return in the range of 7.85 percent to 32.42 percent; have shown performance in the performance period in the range of 0.27 percent to -11. 98 percent. The formation period column of the above table reveals that out of seventeen portfolios, seven portfolios have provided negative return and remaining ten portfolios have shown positive performance. Thus, it can be said that in a short term portfolio, both losers and winners portfolio do not provide clear cut patterns and so no evidence of contrarian or momentum strategy. However, based on performance period of both losers and winners portfolio, it can be said that portfolios formed with shorter period fails to provide evidence
Figure 6: MCAAR of Winner Portfolio (Short Term)
Conclusion and Findings
From the above analysis, it can be revealed that Indian market does not follow random walk and does not show any evidence of weak form of EMH. The analysis carried out with 26 stocks of NSE reveals that market shows evidence of contrarian investment strategy or contrarian movement for a long-term portfolio and partly for a medium term portfolio. However, the contrarian movement does not work for short-term portfolio. Or in other words, it can be said that portfolios constructed with short term horizon proves momentum investment as losers portfolio and winners portfolio have repeated their performance in performance or testing period. Contrarian investing also known as value investing by some practiconers is an attempt to exploit some of the theories of behavioral finance as it has been documented in behavioral finance that investors as a group tend to overweight recent trends when predicting the future meaning a poorly performing stocks will remain poor and a well performing stock will perform well. Further, it was found that both losers and winner portfolios have almost equally contributed for momentum strategy. The results found here are consistent with the findings of De Bondt and Thaler (1985, 1987); Jegadeesh and Titman (1993, 2001) and Joshipura (2009). In nutshell, it can be said that the study confirms contrarian movement for longer-term portfolio and momentum movement for short-term portfolio. Further, it can be said that Indian market shows partial evidence of weak form efficiency for a short-term period but fails for the same in longer tem period. The subsequent adjustment of the market by over reaction in the end shows long-term contrarian profits.
Appendix
Stocks Considered for Long Term Portfolio
|
Portfolio 1 |
Loser's Portfolio |
Winner's Portfolio |
Portfolio 2 |
Loser's Portfolio |
Winner's Portfolio |
|
From Oct 2006 to Sep 2009 |
Oct 2009 to Sep 2012 |
From Oct 2007 to Sep 2010 |
Oct 2010 to Sep 2013 |
||
|
M&M |
-88.53% |
68.92% |
airtel |
-49.59% |
10.25% |
|
TCS |
-65.30% |
56.14% |
RIL |
-40.18% |
-21.35% |
|
airtel |
-38.78% |
-19.83% |
HDFC |
-38.37% |
15.18% |
|
cipla |
-26.11% |
13.51% |
L&T |
-15.51% |
-65.28% |
|
HUL |
-23.00% |
51.15% |
NTPC |
-15.25% |
-20.12% |
|
INFOSYS |
-19.08% |
1.69% |
M&M |
-1.53% |
67.66% |
|
hindalco |
-17.41% |
-3.18% |
TCS |
-1.06% |
66.73% |
|
WIPRO |
-7.15% |
-47.27% |
MARUTI SUZUKI |
3.06% |
4.42% |
|
dr rerddy |
6.38% |
33.41% |
WIPRO |
10.15% |
24.95% |
|
SUN PHARMA |
12.03% |
-7.28% |
ICICI BANK |
15.28% |
-9.71% |
|
ICICI BANK |
16.84% |
24.26% |
ONGC |
19.38% |
-56.96% |
|
ONGC |
20.15% |
-62.34% |
TATA STEEL |
29.82% |
-53.43% |
|
NTPC |
20.27% |
-36.58% |
GAIL |
30.7552% |
6.83% |
|
GAIL |
24.19% |
-5.54% |
HUL |
31.62% |
83.01% |
|
HDFC BANK |
26.73% |
-24.78% |
LUPIN INDIA LTD |
43.19% |
73.61% |
|
MARUTI SUZUKI |
33.30% |
-8.56% |
HDFC BANK |
43.22% |
-45.60% |
|
ITC |
36.84% |
6.47% |
VEDANTA |
45.57% |
-33.29% |
|
TATA STEEL |
36.86% |
-12.52% |
hindalco |
49.92% |
-46.49% |
|
HDFC |
46.55% |
-61.97% |
INFOSYS |
50.34% |
15.61% |
|
LUPIN INDIA LTD |
51.66% |
-0.09% |
cipla |
53.34% |
27.16% |
|
L&T |
66.10% |
-1.07% |
ITC |
60.64% |
73.03% |
|
SBI |
70.43% |
-5.14% |
SUN PHARMA |
61.26% |
-30.49% |
|
axis bank |
82.31% |
18.72% |
SBI |
67.91% |
-52.07% |
|
RIL |
82.77% |
-81.13% |
axis bank |
73.68% |
-13.36% |
|
VEDANTA |
120.35% |
-55.87% |
dr rerddy |
90.89% |
40.19% |
|
Portfolio 1 |
From Oct 2008 to Sep 2011 |
Oct 2011 to Sep 2014 |
Portfolio 4 |
From Oct 2009 to Sep 2012 |
Oct 2012 to Sep 2015 |
|
Loser's Portfolio |
Winner's Portfolio |
Loser's Portfolio |
Winner's Portfolio |
||
|
HDFC |
-85.26% |
3.89% |
HDFC |
-61.97% |
17.06% |
|
RIL |
-83.55% |
-28.44% |
RIL |
-81.13% |
-22.53% |
|
airtel |
-81.00% |
-26.80% |
ONGC |
-62.34% |
-0.13% |
|
SUN PHARMA |
-65.37% |
32.44% |
VEDANTA |
-55.87% |
10.43% |
|
ONGC |
-49.19% |
5.81% |
WIPRO |
-47.27% |
-39.64% |
|
HDFC BANK |
-44.44% |
20.75% |
NTPC |
-36.58% |
21.35% |
|
NTPC |
-35.08% |
-57.74% |
HDFC BANK |
-24.78% |
-53.84% |
|
HUL |
-10.55% |
31.65% |
airtel |
-19.83% |
11.49% |
|
WIPRO |
-6.93% |
16.64% |
TATA STEEL |
-12.52% |
28.46% |
|
cipla |
-5.95% |
40.59% |
MARUTI SUZUKI |
-8.56% |
29.49% |
|
LUPIN INDIA LTD |
2.45% |
72.32% |
SUN PHARMA |
-7.28% |
101.86% |
|
INFOSYS |
11.04% |
-4.49% |
GAIL |
-5.54% |
-58.70% |
|
GAIL |
13.61% |
-30.80% |
SBI |
-5.14% |
-41.12% |
|
SBI |
15.25% |
-0.40% |
hindalco |
-3.18% |
-9.85% |
|
L&T |
18.44% |
-8.42% |
L&T |
-1.07% |
-21.87% |
|
MARUTI SUZUKI |
25.24% |
79.78% |
LUPIN INDIA LTD |
-0.09% |
98.17% |
|
axis bank |
28.38% |
-49.03% |
INFOSYS |
1.69% |
-22.68% |
|
TCS |
32.96% |
53.99% |
ITC |
6.47% |
38.86% |
|
ICICI BANK |
49.32% |
21.01% |
cipla |
13.51% |
-84.58% |
|
hindalco |
53.11% |
-8.88% |
axis bank |
18.72% |
-63.79% |
|
M&M |
54.06% |
26.45% |
ICICI BANK |
24.26% |
-0.84% |
|
TATA STEEL |
56.06% |
-19.93% |
dr rerddy |
33.41% |
-73.46% |
|
ITC |
60.64% |
73.03% |
HUL |
51.15% |
-16.51% |
|
VEDANTA |
66.24% |
14.32% |
TCS |
56.14% |
-70.18% |
|
dr rerddy |
77.67% |
27.47% |
M&M |
68.92% |
57.13% |