A Refereed Monthly International Journal of Management
STUDY OF INDIA ’ S TRADE DEFICIT WITH THE OBJECTIVE OF PROPOSING AN AGENDA FOR POLCY FORMULATION
Author
|
Author: Jitendra Shreemali, Assoc. Prof. & HoD, SoM, SPSU, Udaipur, Rajasthan (jitendrapshreemali@gmail.com)
Dr.Harshita Shrimali, Dean & Provost, Marudhar Mahila Shikshan Sangh, Vidyawadi, Rani, Rajasthan.
Dr.Sapna Shrimali, Assoc. Prof. & HoD, Mathematics, Pacific University, Udaipur, Rajasthan
|
ABSTRACT
This study examines the trade balance for India in the recent past to identify commodities and factors that have consistently maintained it at a negative values exceeding 119 Billion USD in the period under consideration. The negative balance is on account of high import bill of: (a) Mineral fuels/oils and associated products; (b) Electrical machinery/equipment, TV and sound recorders; (c) Natural/cultured pearls, precious or semi-precious stones/metals and related articles besides imitation Jewelry and coins; (d) Nuclear reactors, boilers, machinery and mechanical appliances; and (e) Animal or vegetable fats/oils and related products. These commodities were examined to explore the possibility of restoring trade balance. Categories (a), (b) and (d) above do not present much hope for restoring trade balance in the short and medium term. However, investing in alternate sources of energy, pearl farming, developing indigenous technology and encouraging indigenous production do appear to be possible ways of reducing the deficit. The biggest challenge among partner countries remains China with a rapidly growing deficit highlighting the need for urgent measures to restore India’s trade balance.
Key words: Trade balance, Current account balance, deficit, imports, exports
INTRODUCTION
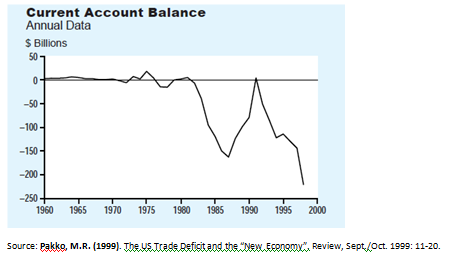
Pakko (1999) points out the current balance status of USA over the years from 1960 to show that despite stellar performance of US economy in the 1990s with strong economic growth, low unemployment, low inflation, high consumer confidence and high investments, the current account balance was at its worst in 1998 (A deficit of about 220 Billion USD with Merchandise accounting for negative balance of nearly 247 Billion USD). Simple calculation equating net of exports over imports with sum of private savings and government savings minus investments suggests savings falling short of investments under conditions of continued trade deficit as faced by USA.
Figure 1: Current account Balance of USA from 1960 onwards
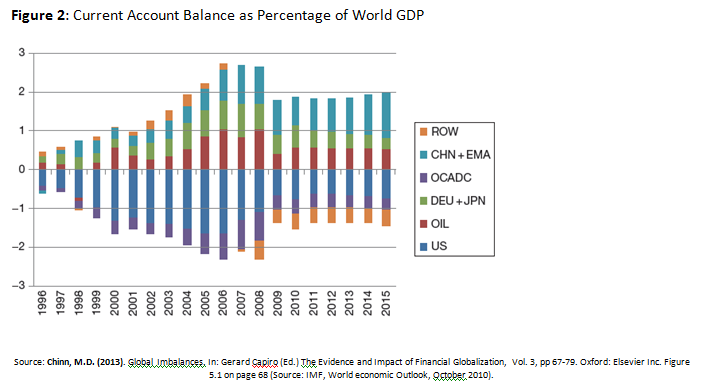
The factors causing current account surplus or deficit could be either country specific or on account of global trends. Large economies like US inevitable have a greater impact on the global scenario. Chinn (2013) presents a comparison of current account balance for groups of countries and shows that the current account deficit of USA occupies a prominent position on a global scale as well.
In the figure below, the groups are: CHN + EMA is China plus Emerging Asia, DEU + JPN is Germany and Japan, OCADA is Other Advanced Countries, OIL is Oil exporters, US is United States of America and ROW is Rest of the World. Current account imbalances are rising again though they have not reached the same levels as in the 2006-2008 period. One important difference is the reduced surplus enjoyed by oil exporters compared to 2006-2008 and another in the increased surplus enjoyed by China and emerging Asia.
Figure 2: Current Account Balance as Percentage of World GDP
Prasad, Sathish and Singh (2014) compare the growth in exports by India with that by China to find that India’s merchandise export share in the world grew from 0.5% to 1.7% from 1990 to 2013, China’s share increased from 1.8% to 11.8%. Further, increasing India’s share to about 4% of world merchandise exports would require a CAGR of about 30% for 5 years in succession. This is a difficult challenge considering that merchandise exports by India grew at a CAGR of 23.8% from 2004-05 to 2008-09 and about 14.0% in the preceding five years. To achieve this challenging target, the recommended measures/steps include addressing the several policy issues including: (a) Product diversification along with market diversification; (b) Improve the export infrastructure; (c) Focus on regional trade agreements; (d) Issues of inverted duty structure ; (d) Prevalence of multiple export promotion schemes; (e) Inadequate export credit financing compared to developed countries; (f) Introduction of new taxes on SEZs; (g) Trade documentation and procedural issues leading to very high costs of importing as well as exporting compared to many other countries; (h) Effective use of Trade Fairs; and (i) Sector specific issues. Growth in exports depends upon various factors including the global economic scenario as seen in the dip in world trade volumes in 2008 and 2009.
Figure 3: Growth in World Trade Volumes for Goods and Services
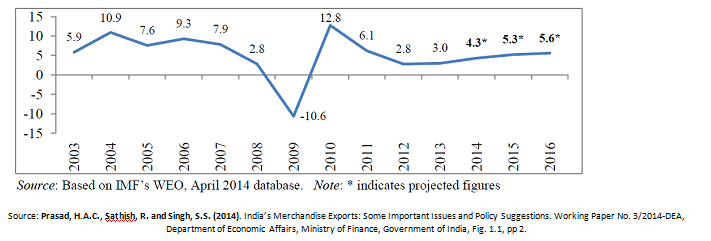
India too faced a dip in exports entering the negative zone twice in 2009-10 (on account of the 2008 crisis) and in 2012-13 (on account Euro zone crisis along with global slowdown). Focus on exports, then, requires appreciating the global scenario/trends as well as assessing the immediate needs of the export market besides building on prevailing strengths.
Table 1: Changing Composition (Percentage Share) of Exports from India: 2003-04 to 2013-14
Source: Prasad, H.A.C., Sathish, R. and Singh, S.S. (2014). India’s Merchandise Exports: Some Important Issues and Policy Suggestions. Working Paper No. 3/2014-DEA, Department of Economic Affairs, Ministry of Finance, Government of India, Table. 1.3, pp 5.
Suresh and Gautam (2015) examine the possibility of high Indian fiscal deficit causing deficit in the external account since India has experienced current account as well as budget account deficits since 1960s to find that no long term relationship exists between current account deficit and fiscal deficits though these are seen to be related in the short term. Polaski et. al. (2008) discuss the trade policy challenges facing India in the face of the fact that while on one hand it is the second most populous country in the world and the biggest ‘reservoir of poverty’ with 300 Million Indian below the national poverty line and 800 Million earning less than 2 USD/day, on the other hand the fast growing high tech service sector employs less than 1% of Indians. The challenges include not just extreme poverty, unemployment as well as under employment, a very large percentage of Indians dependent upon stagnating agricultural growth. Though continued trade liberalization at the multilateral level can surely help India’s growth needs, the need is careful negotiations that balance the dire needs of the poor with the quest for growth in a fast changing world. Rossow (2015) points out that India’s trade deficit with China in the fiscal year 2015 jumped by 34%, to a value close to 48.5 Billion USD and this caused a greater emphasis from India on local manufacturing, something that riled US companies and brought forth various reactions from the US. This study examines the trade balance for India in the recent past to identify commodities and factors that have consistently maintained it at a negative values exceeding 119 Billion USD from 2009-10 onwards and proposes ways to consider for restoring trade balance. While the problem has been identified earlier, a commodity wise analysis on key factors causing the imbalance along with learning from international experience in different sectors was not available for the recent past. This study will add to the body of knowledge on the subject and assist decision makers consider additional options.
RESEARCH METHODOLOGY
This study focusses on secondary data available on the internet. Based on data on the website of the Ministry of Commerce and Industry, a list of countries were identified. The selection criteria was that these countries should account for either greater than or equal to 1% of India’s total imports or exports in the given year. This brought 39 countries within the scope of this study. These 39 countries accounted for about 83% of India’s exports and about 88.5% of imports in 2014-15. Import and Export data from these countries were analyzed using simple graphs and sorting of data. Countries where the deficit exceeded 10 Billion USD were included in the scope of further analysis and these countries are: China, Switzerland, Saudi Arab, Qatar, Iraq, Kuwait, Venezuela, Nigeria and Indonesia. Subsequently, the export-import data from these countries was analyzed with respect to commodities traded to explore the possibilities of restoring a balance, particularly in areas where the deficit is high or increasing.
THE EXPORT IMPORT SCENARIO OF INDIA
Given below is the summary of India’s export and import performance from 2010 till 2015.
Table 2: India’s Trade Balance from 2010-15
|
2010-2011
|
2011-2012
|
2012-2013
|
2013-2014
|
2014-2015
|
|
India's Total Export
|
249,815.55
|
305,963.92
|
300,400.58
|
314,405.30
|
310,338.48
|
|
India's Total Import
|
369,769.13
|
489,319.49
|
490,736.65
|
450,199.79
|
448,033.41
|
|
Trade Balance (Exports-Imports)
|
-119,953.58
|
-183,355.57
|
-190,336.07
|
-135,794.49
|
-137,694.93
|
Source: Website of Ministry of Commerce & Industry, Government of India, Department of Commerce. http://commerce.nic.in/eidb/
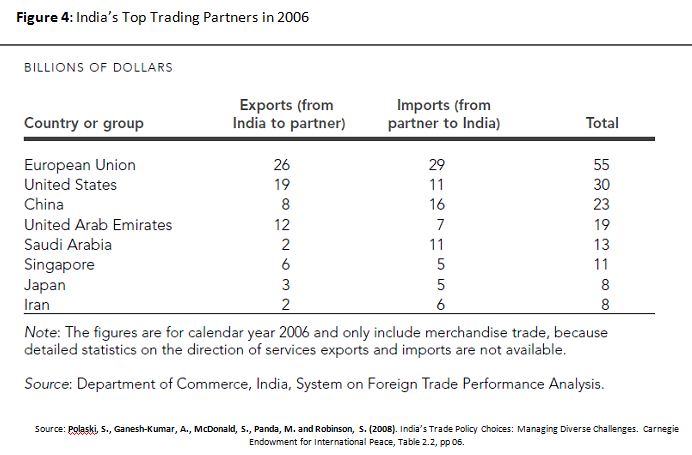
This trade is spread across several countries and trading blocks with the amount of trade with a specific trading partner obviously not being constant over time. Given below are the top 10 trading partners in 2006.
The country wise change over the years is shown in the table below and presented as a graph in the figure below.
Figure 5: India’s Top Trading Partners from 2010-11 to 2014-15
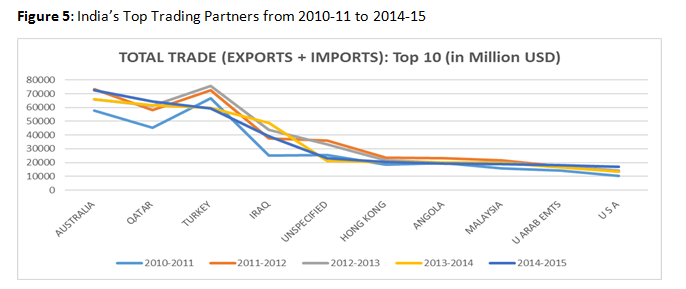
The total trading with each of these trading partners from 2010 to 2015 is given below. The top three trading partners from 2010-11 to 2014-15 were Australia, Qatar and Turkey though the order changed during this time suggesting that a five year period is not necessarily sufficient for big changes to take place as regards international trade.
Table 3: Total Trade: India’s Key Trading Partners 2010-15 (Amount in Mill. USD)
|
S.No.
|
Country
|
2010-2011
|
2011-2012
|
2012-2013
|
2013-2014
|
2014-2015
|
|
1
|
AUSTRALIA
|
57648.62
|
73390.13
|
65783.21
|
65858.98
|
72347.42
|
|
2
|
QATAR
|
45342.63
|
58196.52
|
61359.95
|
61647.18
|
64263.26
|
|
3
|
TURKEY
|
66575.55
|
72681.84
|
75455.01
|
59540.24
|
59167.99
|
|
4
|
IRAQ
|
25069.68
|
37500.99
|
43783.89
|
48622.6
|
39268.99
|
|
5
|
UNSPECIFIED
|
25491.79
|
35854.3
|
33283.82
|
21107.96
|
23201.74
|
|
6
|
HONG KONG
|
18642.55
|
23543.92
|
21571.99
|
20448.22
|
20325.2
|
|
7
|
ANGOLA
|
19735.66
|
23340.61
|
20186.37
|
20053.94
|
19171.87
|
|
8
|
MALAYSIA
|
15619.41
|
21443.92
|
20210.79
|
19598.5
|
19047.96
|
|
9
|
U ARAB EMTS
|
14202.58
|
17164.34
|
17307.37
|
16679.29
|
18132.06
|
|
10
|
U S A
|
10394.75
|
13454
|
14395.13
|
13427.81
|
16934.29
|
|
11
|
NEPAL
|
16964.75
|
25246.2
|
21105.62
|
19273.03
|
16933.83
|
|
12
|
SOUTH AFRICA
|
12886.66
|
17459.78
|
14826.15
|
16765.59
|
16364.34
|
|
13
|
IRAN
|
14394.2
|
17562.19
|
15554.17
|
17129.36
|
16325.39
|
|
14
|
VIETNAM SOC REP
|
7195.26
|
13724.3
|
16380.26
|
16677.05
|
15659.69
|
|
15
|
RUSSIA
|
13723.27
|
18327.97
|
18512.35
|
16294.82
|
15516.93
|
|
16
|
CHINA P RP
|
9686.44
|
19682.44
|
20525.44
|
19438.89
|
15076.98
|
|
17
|
NIGERIA
|
12169.65
|
17621.05
|
17649.21
|
18214.69
|
14580.86
|
|
18
|
KOREA RP
|
12681.74
|
15724.23
|
14905.63
|
15824.17
|
14338.01
|
|
19
|
U K
|
13421.11
|
16201.49
|
14945.53
|
15278.51
|
13130.08
|
|
20
|
SINGAPORE
|
12502.02
|
18055.36
|
15434.35
|
12122.8
|
13029.37
|
|
21
|
SAUDI ARAB
|
5385.96
|
6916.62
|
14351.81
|
14137.09
|
11987.96
|
|
22
|
KUWAIT
|
11052.92
|
15702.93
|
13994.82
|
11149.55
|
11798.51
|
|
23
|
GERMANY
|
18707.74
|
17476.02
|
7362.41
|
15641.56
|
11724.12
|
|
24
|
ITALY
|
7573.04
|
10041.22
|
10874.29
|
9273.41
|
11364.73
|
|
25
|
JAPAN
|
8914.14
|
8890.89
|
9638.39
|
8800.18
|
9372.74
|
|
26
|
SRI LANKA DSR
|
6546.3
|
8244.85
|
9085.78
|
9043.47
|
9330.71
|
|
27
|
INDONESIA
|
8807.6
|
10004.78
|
9083.78
|
9429.36
|
9324.12
|
|
28
|
MEXICO
|
3716.34
|
5441.96
|
6282.15
|
8036.19
|
9261.23
|
|
29
|
SWITZERLAND
|
9530.66
|
11769.75
|
12944.11
|
11134.51
|
9127.62
|
|
30
|
VENEZUELA
|
4009.23
|
5016.22
|
4609.68
|
5201.28
|
7459.89
|
|
31
|
KENYA
|
3689.65
|
4374.93
|
5784.32
|
6651.27
|
7072.84
|
|
32
|
BANGLADESH PR
|
3570.21
|
4569.17
|
5997.84
|
5194.18
|
6822.77
|
|
33
|
FRANCE
|
5289.45
|
6542.58
|
6527.24
|
6015.66
|
6346.23
|
|
34
|
SPAIN
|
2076.22
|
3947.1
|
5665.86
|
5899.87
|
6254.7
|
|
35
|
THAILAND
|
5173.29
|
6675.86
|
6096.37
|
6058.52
|
5617.89
|
|
36
|
NETHERLAND
|
2681.46
|
3271.54
|
3631.94
|
4122.23
|
5198.68
|
|
37
|
BRAZIL
|
5787.56
|
7079.4
|
7646.33
|
6528.34
|
5170.28
|
|
38
|
BELGIUM
|
4052.87
|
4809.05
|
4681.41
|
4727.83
|
5153.32
|
|
39
|
ISRAEL
|
2305.99
|
2390.85
|
3876.29
|
4008.78
|
4235.35
|
Source: Website of Ministry of Commerce & Industry, Government of India, Department of Commerce. http://commerce.nic.in/eidb/
Picture on trade deficit or surplus with these trading partners is presented below.
Table 4: India’s Country Wise Trade Balance (Exports - Imports) from 2010-15 in Million USD.
|
S.No.
|
Country
|
2010-2011
|
2011-2012
|
2012-2013
|
2013-2014
|
2014-2015
|
|
1
|
CHINA P RP
|
-29310.9
|
-37237.03
|
-38713.45
|
-36210.26
|
-48478.92
|
|
2
|
SWITZERLAND
|
-24112.21
|
-33663.62
|
-31049.26
|
-17514.06
|
-21064.58
|
|
3
|
SAUDI ARAB
|
-15700.88
|
-26134.41
|
-24212.33
|
-24184.7
|
-16946.13
|
|
4
|
QATAR
|
-6444.48
|
-12108.4
|
-15005.9
|
-14738.93
|
-13549.73
|
|
5
|
IRAQ
|
-8330.16
|
-18154.5
|
-17969.18
|
-17602.83
|
-13418.34
|
|
6
|
KUWAIT
|
-8457.63
|
-15258.23
|
-15527.05
|
-16092.41
|
-12183.08
|
|
7
|
VENEZUELA
|
-5033.96
|
-6417.18
|
-13883.53
|
-13743.17
|
-11471.82
|
|
8
|
NIGERIA
|
-8688.78
|
-12055.76
|
-9346.07
|
-11430.09
|
-11001.6
|
|
9
|
INDONESIA
|
-4217.85
|
-8087.94
|
-9548.19
|
-9898.1
|
-10961.32
|
|
10
|
KOREA RP
|
-6748
|
-8459.64
|
-8902.87
|
-8261.91
|
-8926.16
|
|
11
|
AUSTRALIA
|
-9075.98
|
-13101.68
|
-10737.05
|
-7522.24
|
-7465.11
|
|
12
|
MALAYSIA
|
-2652.41
|
-5493.28
|
-5506.99
|
-5031.95
|
-5301.19
|
|
13
|
BELGIUM
|
-2825.44
|
-3240.67
|
-4539.57
|
-4374.72
|
-5286.45
|
|
14
|
GERMANY
|
-5140.19
|
-7658.34
|
-7079.59
|
-5416.6
|
-5250.52
|
|
15
|
IRAN
|
-8435.31
|
-11378.83
|
-8243.39
|
-5335.81
|
-4779.96
|
|
16
|
JAPAN
|
-3540.79
|
-5670.89
|
-6312.23
|
-2666.68
|
-4745.79
|
|
17
|
ANGOLA
|
-4436.68
|
-6170.74
|
-6668.75
|
-5456.28
|
-4065
|
|
18
|
UNSPECIFIED
|
10072.78
|
15397.5
|
3512.53
|
7447.42
|
-3401.54
|
|
19
|
THAILAND
|
-1997.88
|
-2322.83
|
-1619.44
|
-1636.93
|
-2401.05
|
|
20
|
RUSSIA
|
-1910.59
|
-2986.04
|
-1935.88
|
-1773.14
|
-2152.21
|
|
21
|
SOUTH AFRICA
|
-3228.18
|
-6240.59
|
-3780.96
|
-1000.97
|
-1194.53
|
|
22
|
MEXICO
|
-250.68
|
-1212.36
|
-2409.38
|
-1444.99
|
-531.6
|
|
23
|
FRANCE
|
1505
|
225.33
|
333.67
|
1416.4
|
540.58
|
|
24
|
BRAZIL
|
475.28
|
1498.28
|
1222.77
|
1831.53
|
562.91
|
|
25
|
ITALY
|
295.56
|
-238.6
|
-338.76
|
1116.14
|
860.5
|
|
26
|
ISRAEL
|
666.27
|
1405.18
|
1383.05
|
1435.36
|
961.81
|
|
27
|
SPAIN
|
1077.71
|
1189.49
|
1050.09
|
1040.99
|
1142.92
|
|
28
|
SINGAPORE
|
2686.13
|
8469.22
|
6132.86
|
5748.05
|
2684.89
|
|
29
|
VIETNAM SOC REP
|
1586.54
|
1996.22
|
1652.59
|
2847.69
|
3254.53
|
|
30
|
NETHERLAND
|
5824.46
|
6532.75
|
8185.93
|
4856.67
|
3521.82
|
|
31
|
TURKEY
|
1928.09
|
2525.35
|
1929.48
|
3673.32
|
3895.03
|
|
32
|
NEPAL
|
1654.66
|
2171.6
|
2545.74
|
3062.37
|
3918.86
|
|
33
|
KENYA
|
2058.03
|
2164.07
|
3664.39
|
3755.52
|
4000.51
|
|
34
|
U K
|
1888.18
|
1455.63
|
2319.45
|
3733.97
|
4301.45
|
|
35
|
BANGLADESH PR
|
2796.15
|
3203.47
|
4505.66
|
5682.59
|
5830.1
|
|
36
|
SRI LANKA DSR
|
3005.77
|
3741.36
|
3358.06
|
3867.42
|
5947.55
|
|
37
|
U ARAB EMTS
|
1069.23
|
-830.8
|
-2821.71
|
1500.6
|
6888.17
|
|
38
|
HONG KONG
|
904.86
|
2523.19
|
4372.03
|
5409.54
|
8027.89
|
|
39
|
U S A
|
5241.19
|
11286.68
|
10950.49
|
16637.02
|
20634.06
|
Source: Website of Ministry of Commerce & Industry, Government of India, Department of Commerce. http://commerce.nic.in/eidb/
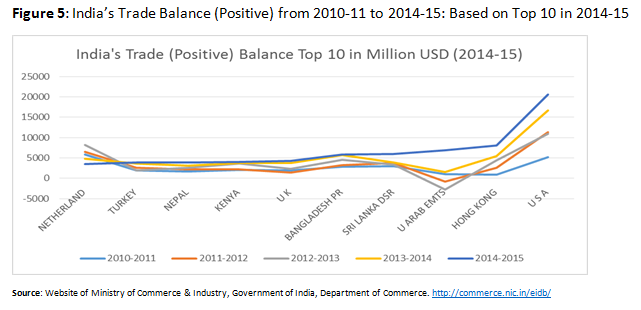
India enjoyed a positive balance with several countries in 2014-15, the highest positive balance coming from the US and showing a rising trend from 2010-11 to 2014-15 along with moderate rise in the case of Hong Kong and UAE.
Figure 5: India’s Trade Balance (Positive) from 2010-11 to 2014-15: Based on Top 10 in 2014-15
India also had a negative balance with several countries in 2014-15, the highest negative balance coming from the China and showing a increasingly negative rising trend from 2010-11 to 2014-15 along with relatively moderate trend in the case of Switzerland, Saudi Arab, and Qatar. Further the deficit in trade with China has been increasing year after year suggesting the possibility of lack of balancing factors in their trade. The trend remained the same in the first six months of FY 2016 with deficit crossing 27 Billion USD from April to Sept. 2015.
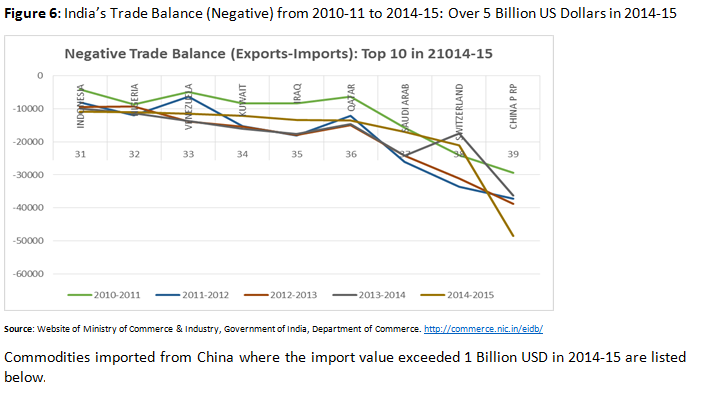
Commodities imported from China where the import value exceeded 1 Billion USD in 2014-15 are listed below.
Table 5: India’s Imports from China Exceeding 1 Billion USD in 2014-15 (Amount in Million USD)
|
Sl. No.
|
HS Code
|
Commodity
|
2009-10
|
2010-11
|
2011-12
|
2012-13
|
2013-14
|
2014-15
|
|
1
|
85
|
Electrical machinery & equipment and parts thereof; Sound recorders & reproducers, TV Image & sound recorders & reproducers and Parts
|
9667.06
|
11857.72
|
14183.07
|
13984.34
|
14228.73
|
16738.41
|
|
2
|
84
|
Nuclear reactors, boilers, machinery & mechanical appliances; parts thereof.
|
6173.98
|
7699.9
|
10143.52
|
10007
|
9455.31
|
10144.22
|
|
3
|
29
|
Organic Chemicals
|
3009.97
|
3853.42
|
4384.81
|
4946.74
|
5396.44
|
6327.5
|
|
4
|
31
|
Fertilizers.
|
401.17
|
1517.44
|
2596.01
|
2999.7
|
1925.7
|
3154.68
|
|
5
|
72
|
Iron & Steel
|
814.44
|
1986.38
|
1855.49
|
1495.32
|
976.26
|
2713.34
|
|
6
|
39
|
Plastics & articles thereof.
|
517.88
|
855.71
|
1057.69
|
1133.91
|
1320.57
|
1710.63
|
|
7
|
98
|
Project goods; Some special uses
|
2107.46
|
3181.56
|
5062.51
|
3708.82
|
2126.62
|
1451.74
|
|
8
|
73
|
Articles of Iron or steel
|
858.19
|
1178.18
|
1543.59
|
1476.78
|
1219.19
|
1392.09
|
|
9
|
71
|
Natural or cultured pearls, precious or semiprecious stones, pre. metals, clad with pre. metal and articles; imitation jewelry; coin.
|
279.56
|
685.02
|
935.42
|
197.53
|
950.76
|
1231.17
|
|
10
|
90
|
Optical, photographic cinematographic measuring, checking precision, medical or surgical instruments & apparatus parts and accessories thereof;
|
443.9
|
655.4
|
941.53
|
999.66
|
1043.6
|
1221.68
|
|
11
|
87
|
Vehicles other than railway or tramway rolling stock & parts and accessories thereof.
|
473.58
|
733.65
|
993.32
|
969.19
|
993.33
|
1165.34
|
|
12
|
89
|
Ships, Boats, HIPS & floating structures.
|
407.96
|
1213.39
|
1380.07
|
682.81
|
941.72
|
1122.27
|
Source: Website of Ministry of Commerce & Industry, Government of India, Department of Commerce. http://commerce.nic.in/eidb/
A study of this data over the years suggests that imports are rising for most of these commodities. This is shown in thee figure below:
Figure 6: Commodity wise Trend of India’s Imports from China with 2014-15 imports over 1 Billion USD
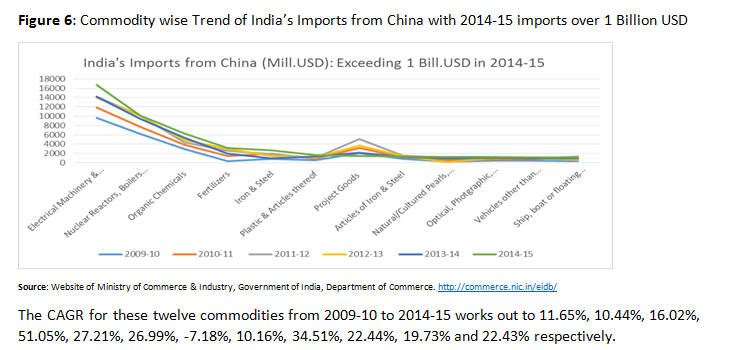
The CAGR for these twelve commodities from 2009-10 to 2014-15 works out to 11.65%, 10.44%, 16.02%, 51.05%, 27.21%, 26.99%, -7.18%, 10.16%, 34.51%, 22.44%, 19.73% and 22.43% respectively.
The second biggest exporter to India in 2014-15 was Switzerland. Imports from Switzerland were analyzed over the same period and imports of only one commodity exceeded 1 Billion USD in 2014-15. This commodity is “Natural or Cultured Pearls, Precious/Semi Precious Stones, Precious Metals clad with Precious Metals and Articles Thereof; Imitation Jewelry and Coins”. The large fluctuation in values suggests high volatility as regards factors that govern this import. The next in value was “Nuclear Reactors, Boilers, Machinery and Mechanical appliances; Parts Thereof” where the total exports to India was USD 401.1 Million in 2014-15 with a high of USD 643.6 Million in 2011-12. As regards other countries where the trade deficit was over 10 Billion USD in 2014-15, the commodities where imports exceeded 1 Billion USD in 2014-15 are listed below:
Table 6: Commodity-wise Imports Exceeding I Billion USD in 2014-15 (Amount in Million USD)
|
Sl. No.
|
Country
|
Commodity
|
2010-2011
|
2011-2012
|
2011-2012
|
2012-2013
|
2013-2014
|
2014-2015
|
|
1.
|
Switzerland
|
Natural/Cultured Pearls, Precious/Semi Precious Stones, Precious Metals, Imitation Jewelry, Coins etc.
|
12988.94
|
22815.23
|
32188.31
|
29679.47
|
17496.09
|
20384.67
|
|
2.
|
Saudi Arab
|
Mineral Fuels/Oils & Distillation products; Bitu-minous Substances, Waxes etc.
|
15390
|
17932.3
|
28302.4
|
29896.5
|
32781.6
|
23212.9
|
|
3.
|
Saudi Arab
|
Organic Chemicals
|
690.09
|
1009.23
|
1255.01
|
1248.98
|
1206.11
|
1265.24
|
|
4.
|
Saudi Arab
|
Plastics & Articles thereof
|
380.57
|
656.22
|
562.59
|
782.72
|
832.41
|
1135.75
|
|
5.
|
Saudi Arab
|
Natural/Cultured Pearls, Precious/Semi Precious Stones, Precious Metals, Imitation Jewelry, Coins etc.
|
0.26
|
5.16
|
33.42
|
40.72
|
186.26
|
758.62
|
|
6.
|
Saudi Arab
|
Fertilizers
|
76.74
|
---
|
257.24
|
540.63
|
309.12
|
612.68
|
|
7.
|
Qatar
|
Mineral Fuels/Oils & Distillation products; Bitu-minous Substances, Waxes etc.
|
4101.68
|
6060.95
|
11697.83
|
14578.34
|
14590.81
|
13415.31
|
|
8.
|
Iraq
|
Mineral Fuels/Oils & Distillation products; Bitu-minous Substances, Waxes etc.
|
6981.32
|
8954.66
|
18826.19
|
19166.06
|
18450.33
|
14177.22
|
|
9.
|
Kuwait
|
Mineral Fuels/Oils & Distillation products; Bitu-minous Substances, Waxes etc.
|
7909.8
|
9729.09
|
15718.33
|
15737.46
|
16121.78
|
12228.71
|
|
10.
|
Venezuela
|
Mineral Fuels/Oils & Distillation products; Bitu-minous Substances, Waxes etc.
|
2847.89
|
5203.69
|
6653.12
|
14105.91
|
13963.59
|
11669.14
|
|
11.
|
Nigeria
|
Mineral Fuels/Oils & Distillation products; Bitu-minous Substances, Waxes etc.
|
7201.29
|
10660.41
|
14621.44
|
11916.51
|
13959.6
|
13532.36
|
|
12.
|
Indonesia
|
Mineral Fuels/Oils & Distillation products; Bitu-minous Substances, Waxes etc.
|
2655.48
|
3054.14
|
5593.74
|
6110.42
|
6896.05
|
7497.34
|
|
13.
|
Indonesia
|
Animal/vegetable fats and oils & their cleavage products; Pre edible fats etc.
|
3413.64
|
3950.67
|
5658.82
|
5625.93
|
4615.43
|
3893.77
|
Source: Website of Ministry of Commerce & Industry, Government of India, Department of Commerce. http://commerce.nic.in/eidb/
In the case of Kuwait, Organic Chemicals accounted for an import of about 833 Million USD in 2014-15, the yearly import values from 2009-10 being 119.21 Million USD, 346.05 Million USD, 401.15 Million USD, 461.03 Million USD and 729.06 Million USD. This gives a high CAGR value of about 147.5%. The imports of Plastics and articles thereof from Kuwait also showed a CAGR of about 110% from 2009-10 to 2014-15.
A look at the data above indicates that the category of mineral fuels, oils and distillation products besides bituminous products constitutes the single biggest category where imports exceeded 1 Billion USD in 2014-15. In terms of restoring trade balance, it is worth examining whether there is any elasticity in demand. Similar studies suggest that the demand is not very elastic. Weber and Baranzini (2013) report very weak price elasticity of -0.09 in the short run and -0.34 in the long run for gasoline demand in Switzerland over the 1970-2008 period. As regards demand of fuel including gasoline and diesel, the corresponding figures are a little different at -0.08 and -0.27. Oxford Economics report (2011) on Fossil fuel price shocks and a low carbon economy discusses impact of policies on UK economy in the face of global energy price shocks through two scenarios: (a) Business as Usual; and (b) Low Carbon scenario wherein improved efficiency leads to reduced energy demand. Estimated price elasticity for different sectors is given below:
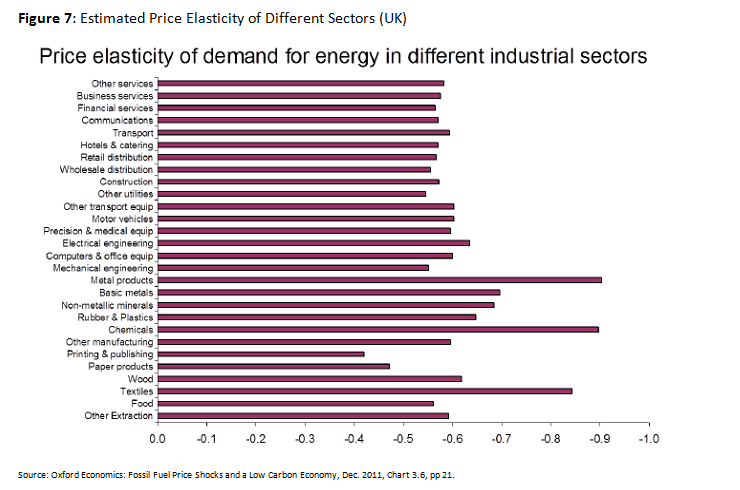
Elasticity is not constant for all sectors and is closely linked to the extent of energy used by the sector as indicated by the figure below.
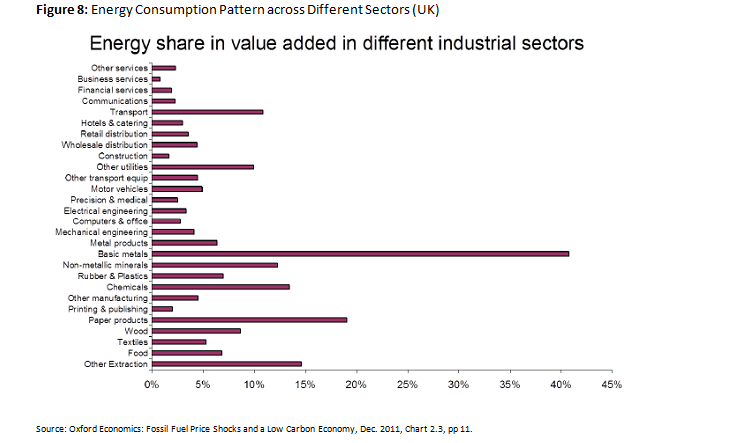
Industries making greater use of energy in their manufacturing process show greater inelasticity than those less dependent on energy as happens for the service sector. Goldar (2010) reported falling Energy Intensity (computed as ratio of energy cost to value of output, both deflated) in Indian manufacturing sector from 1973-74 to 2007-08 based on data from Annual Survey of Industries.
Figure 9: Energy Intensity Trends in Indian Manufacturing from 1973-74 to 2007-08
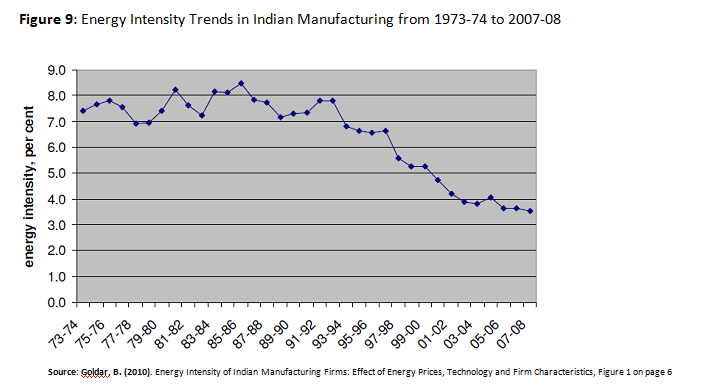
The data above shows that after remaining stable for almost two decades energy intensity started improving from 1992-93 onwards and reached about 3.5% in 2007-08. Further, the reduction varies across states as well as industries as indicated in the figure below.
Table 7: Energy Intensity Variation across States / Industries (Nine High Intensity Industries presented)
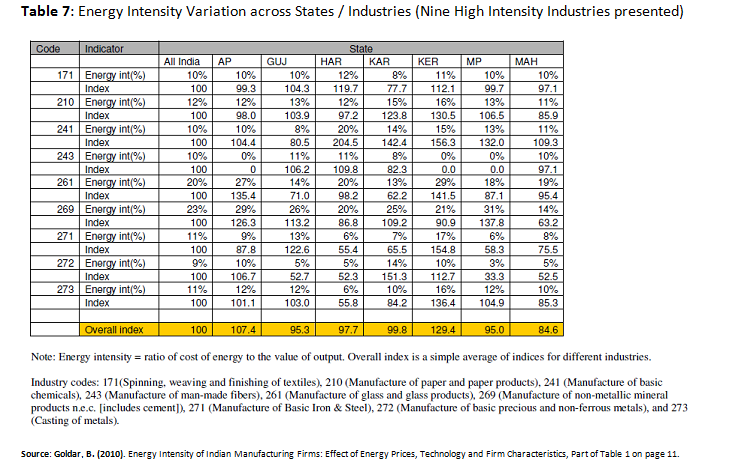
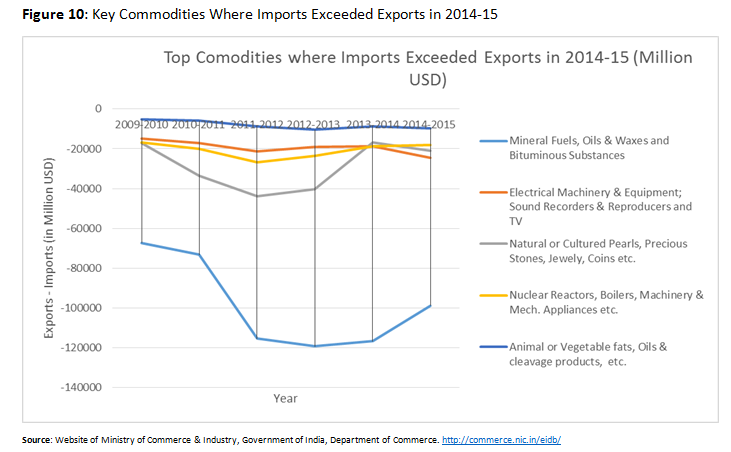
Improvement in energy intensity over the years along with significant variation across states points to a potential for continued improvement on an all India basis. However, given India’s large population, immense poverty and the need to grow her economy, reducing expenses in fuel may depend more on falling prices than reducing consumption in the short run though investments in environmentally friendly energy options could reduce import bill of mineral fuels and mineral oils in the long run. The other commodities where Indian imports exceeded exports by 10 Billion USD are listed in the Table below. The top areas where Imports exceeded exports by an amount close to 10 Billion USD or above in 2014-15 are:
- Mineral Fuels, Mineral Oils and Products of their distillation; Bituminous substances; Mineral Waxes (About 98.8 Billion);
- Electrical Machinery and Equipment and Parts Thereof; Sound Recorders and Reproducers, Television Image & Sound Recorders and Reproducers, and Parts (About 24.4 Billion);
- Natural or Cultured Pearls, Precious or Semi-Precious Stones, Pre. Metals, Clad with Pre. Metal and Articles thereof; Imit. Jewelry; Coin (About 20.8 Billion);
- Nuclear Reactors, Boilers, Machinery and Mechanical Appliances; Parts thereof (About 17.9 Billion);
- Animal or Vegetable Fats and Oils and their Cleavage Products; Pre. Edible Fats; Animal or Vegetable Waxes (About 9.7 Billion).
Table 8: India’s Commodity Trade Balance (2009-15): 2014-15 imports exceeding exports by USD 10 Bill.
|
Values in US $ Million
|
|
|
|
S.No.
|
Commodity
|
2009-2010
|
2010-2011
|
2011-2012
|
2012-2013
|
2013-2014
|
2014-2015
|
|
1
|
Mineral fuels, mineral oils and products of their distillation, Bituminous substances; Mineral waxes.
|
-67284.9
|
-73193.1
|
-115362
|
-119239
|
-116697
|
-98780
|
|
2
|
Electrical machinery and equipment and parts thereof; Sound recorders and reproducers, TV image and sound recorders and reproducers, and parts.
|
-14841
|
-17066.2
|
-21337.2
|
-18956.9
|
-18854.2
|
-24452.6
|
|
3
|
Natural or cultured pearls, Precious or semi precious stones, Precious metals, Clad with precious metals and articles thereof, Imitation jewelry, Coin.
|
-17118.9
|
-33369.5
|
-43797.2
|
-40128.1
|
-16772.5
|
-20830.2
|
|
4
|
Nuclear reactors, Boilers, Machinery and mechanical appliances; parts thereof.
|
-16802.4
|
-19908.4
|
-26705.9
|
-23685.9
|
-18592
|
-17927.8
|
|
5
|
Animal or vegetable fats and oils and their cleavage products; Pre. Edible fats; animal or vegetable waxes.
|
-5084.89
|
-5848.92
|
-8623.96
|
-10372.4
|
-8584.42
|
-9696.72
|
|
|
India's Total Export-Imports
|
-109621
|
-119954
|
-183356
|
-190336
|
-135794
|
-137695
|
Source: Website of Ministry of Commerce & Industry, Government of India, Department of Commerce. http://commerce.nic.in/eidb/
The commodity trade trends can be seen on the plot below.
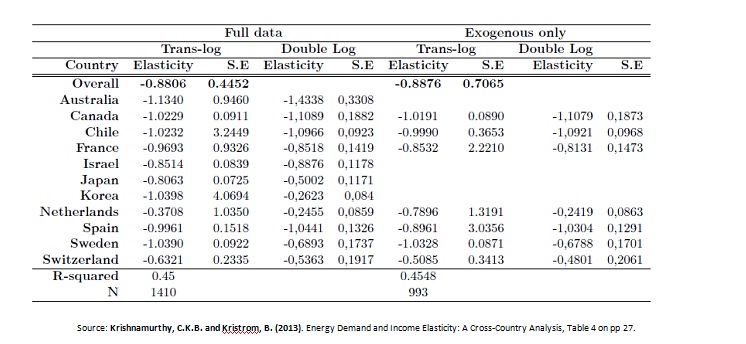
The ‘commodity’ after mineral fuels/oils in terms of import value includes electrical machinery, TV and sound recorders/reproducers. Import of electrical machinery is directly linked to growing energy consumption. Pachauri and Fillippini (2002) estimated the price and income elasticities of electricity demand in residential sector of all Indian urban areas using disaggregate level survey data for over 30000 Indian households in one month each from winter, monsoon and summer season. The study found that electricity demand is income and price inelastic in all three seasons with household, demographic and geographical variables playing a greater role in determining household electricity demand. Since these do not change in the short run, the imports are not likely to go down in the immediate future though there is a possibility of reducing these in the medium-to-long-term future by increased emphasis on skill development in the country coupled with local industry manufacturing quality machinery that can replace imports. Labanderia, Labeagaand Lopez-Otero (2009) estimated residential and industrial electricity demand in Spain to find that electricity demand is inelastic with respect to price in the short term though there are differences between industrial and residential demand. Elasticity of demand in provinces is related to the per capita income of the province with elasticity being lower for higher per-capita income provinces. As regards companies as well as large consumers there is little relationship between per capita income and elasticity. Chile too saw rapid increase in demand for electricity since early 1990s and Agostini, Plottier and Saavedra (n.d.) carried out a study on determinants of electricity demand for households and reported a price elasticity between -0.38 and -0.40 for residential consumption, very close to the value of -0.32 in winter months and -0.39 in monsoon months reported by Pachauri and Fillippini (2002). Price and income elasticities of 11 OECD countries using data of annual electricity consumption and sample derived average electricity price (Krishnamurthy and Kristrom (2013)) range from -0.63 to -1.13.
Table 9: Country wise (OECD) Price Elasticity for Electricity Consumption
“Natural or cultured pearls, Precious or semi-precious stones, Precious metals, Clad with precious metals and articles thereof, Imitation jewelry, Coin” forms the next category of commodities where imports exceeded exports by 10 Billion USD, the actual difference being about 20.83 Billion USD. Inability to find reliable data on elasticities for this category in Indian context led the researcher to look for related data from other studies. Monypenny and Haoatai (2011) estimate the price and income elasticities of raw pearl exports and report figures of -0.42 for price elasticity and 3.53 for income elasticity. Tisdell and Poirine (2007) report that demand for pearls is price inelastic but income sensitive. The study presents Golay Company’s estimates of the value of world production of pearls in 2004 (broken down in terms of types and producing countries) in the Table below.
Table 10: Value of World Production of Cultured Pearls in 2004 (Estimated by Golay Company)
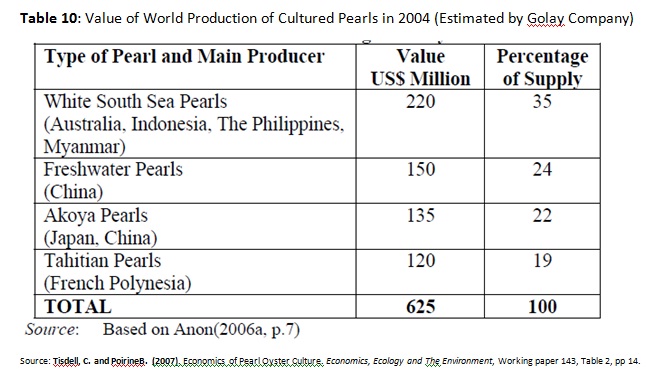
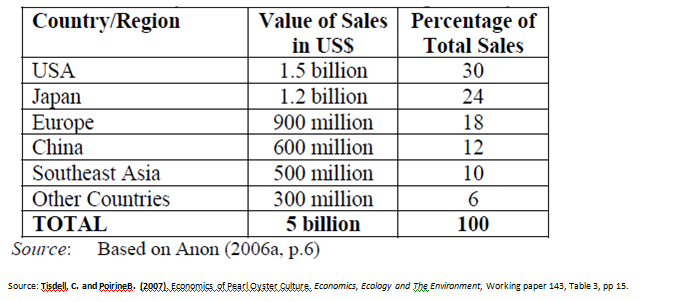
Quite clearly, Pearls production is dominated by a handful of countries though the markets are spread much wider as indicated in the Table below though Asia remains the major market for pearls.
Table 11: Value of Major Markets of the Pearl Industry in 2004 (Estimated by Golay Company)
Considering price inelasticity and income elastic nature of demand, building capability to produce pearls could be an important focus area for India to restore a trade balance. However, the challenges include: (a) Pearls being associated with a lifestyle of the rich, the emphasis is on its exclusiveness, something not very easy for a new player to establish; (b) Branding is synonymous with reputation and quality requiring large investments in advertising and quality control for a new entrant; (c) Economies of scale further require large pearl farms with Tisdell and Poirine (2007) citing an unpublished study Kugglemann andPoirine (2003) suggesting that the best profitability being achieved for a farm size of 200000 oysters in French Polynesia.
Table 12: Trade Balance with Key Partners: Pearls, precious stones, metals, Imit. jewelry, coin (USD Mill.)
|
|
EXPORTS
|
IMPORTS
|
EXPORTS - IMPORTS
|
|
Sl.
|
Country
|
2014-15
|
2015-16 (Apr-Sep)
|
2014-15
|
2015-16 (Apr-Sep)
|
2014-15
|
2015-16 (Apr-Sep)
|
|
1
|
HONG KONG
|
12,206.19
|
5,679.33
|
4094.58
|
2007.92
|
8,111.61
|
3,671.41
|
|
2
|
U S A
|
8,419.58
|
4,344.44
|
3521.72
|
1808.18
|
4,897.86
|
2,536.26
|
|
3
|
U ARAB EMTS
|
12,280.37
|
6,442.01
|
8795.44
|
4349.12
|
3,484.93
|
2,092.89
|
|
4
|
THAILAND
|
664.5
|
327.37
|
102.23
|
48.56
|
562.27
|
278.81
|
|
5
|
UNSPECIFIED
|
775.83
|
9.78
|
276.96
|
153.64
|
498.87
|
-143.86
|
|
6
|
JAPAN
|
283.49
|
121.8
|
46.88
|
37.03
|
236.61
|
84.77
|
|
7
|
SINGAPORE
|
493.39
|
189.56
|
313.23
|
76.64
|
180.16
|
112.92
|
|
8
|
FRANCE
|
104.32
|
48.28
|
5.57
|
4.32
|
98.75
|
43.96
|
|
9
|
ISRAEL
|
1,183.21
|
528.94
|
1090.94
|
467.03
|
92.27
|
61.91
|
|
10
|
ITALY
|
131.89
|
47.17
|
62.8
|
24.88
|
69.09
|
22.29
|
|
11
|
IRAN
|
58.93
|
11.81
|
2.26
|
1.13
|
56.67
|
10.68
|
|
12
|
MALAYSIA
|
71.27
|
24.03
|
20.56
|
15.23
|
50.71
|
8.80
|
|
13
|
KUWAIT
|
47.53
|
38.67
|
0.01
|
0.15
|
47.52
|
38.52
|
|
14
|
SPAIN
|
59.51
|
23.02
|
13.95
|
15.76
|
45.56
|
7.26
|
|
15
|
SRI LANKA DSR
|
32.59
|
16.1
|
2.75
|
1.1
|
29.84
|
15.00
|
|
16
|
PAKISTAN IR
|
25.16
|
20.92
|
0.49
|
0.02
|
24.67
|
20.90
|
|
17
|
LEBANON
|
12.96
|
10.17
|
3.67
|
0
|
9.29
|
10.17
|
|
18
|
TAIWAN
|
24.88
|
10.6
|
267.33
|
48.88
|
-242.45
|
-38.28
|
|
19
|
KOREA RP
|
45.93
|
30.63
|
373.68
|
149.75
|
-327.75
|
-119.12
|
|
20
|
GERMANY
|
113.88
|
51.58
|
458.36
|
59.42
|
-344.48
|
-7.84
|
|
21
|
CANADA
|
141.8
|
63.53
|
581.33
|
416.95
|
-439.53
|
-353.42
|
|
22
|
U K
|
508.58
|
274.79
|
1151.51
|
839.86
|
-642.93
|
-565.07
|
|
23
|
SAUDI ARAB
|
22.22
|
12.61
|
758.62
|
337.91
|
-736.40
|
-325.30
|
|
24
|
CHINA P RP
|
147.98
|
64.23
|
1231.17
|
239.02
|
-1,083.19
|
-174.79
|
|
25
|
AUSTRALIA
|
287.81
|
147.64
|
1647.25
|
557.48
|
-1,359.44
|
-409.84
|
|
26
|
S. AFRICA
|
77.76
|
38.19
|
1896.33
|
1197.98
|
-1,818.57
|
-1,159.79
|
|
27
|
BELGIUM
|
2,680.36
|
1,138.64
|
9017.19
|
3303.74
|
-6,336.83
|
-2,165.10
|
|
28
|
SWITZERLAND
|
294.12
|
74.96
|
20384.7
|
9424.2
|
-20,090.55
|
-9,349.24
|
Source: Based on Data Available at Website of Ministry of Commerce & Industry, Government of India, Department of Commerce. http://commerce.nic.in/eidb/
To reduce the deficit on account of “Natural or cultured pearls, Precious or semi-precious stones, Precious metals, Clad with precious metals and articles thereof, Imitation jewelry, Coin” India could consider either reducing imports or increasing exports. The total imports in this category from Apr-Sept. 2015 amounted to USD 30.199 Billion (compared to USD 62.38 Billion in 2014-15) while exports in this category from Apr-Sept. 2015 amounted to USD 19.89 Billion (compared to USD 41.55 Billion in 2014-15). Both six monthly values are roughly half the annual values suggesting little likely change in 2015-16 as compared to 2014-15.Further, the figure of Exports – Imports for key trading partners for this commodity shows that countries where exports exceeded imports or imports exceeded exports remained more or less the same suggesting limited flexibility in developing new partners.
Given the facts above, India would need to embark on a long term approach of enhancing its capability to produce/export this commodity by developing pearl farms, investing in quality of pearls and precious stones and developing brands. Cartier, Krzemnicki and Ito (2012) discuss experience of developing a domestic pearl industry starting with feasibility evaluation in 1987 in the Federated States of Micronesia (FSM). After going through initial learning difficulties, pear culturing took roots on four of the 607 FSM islands within the state of Pohnpei with a total volume of about 26000 oysters with funds beginning to come though funding problem does crop up at times. The challenges that are yet to be fully addressed to meet the growing demand of high quality pearls include successfully competing in the market place by sustaining high quality over an extended period and differentiating their product as ‘Micronesian Blue’ pearl that are very close to French Polynesia. The study highlights the possibility of developing a new industry that is likely to be price inelastic and could help restore India’s trade balance in the long term future. Cartier and Ali (2012) present the challenges in pearl farming as including patience (it takes at least 3-4 years to harvest pearls after birth of the oyster) and a high degree of care since not all oysters survive or produce a beautiful pearl with estimates indicating that 95% of pearl farms income flows in from about 2% of harvested pearls). Pearl farming requires a thriving ecosystem and conserving marine life as it is strongly impacted by climate change as well as coral and coastal habitat destruction.
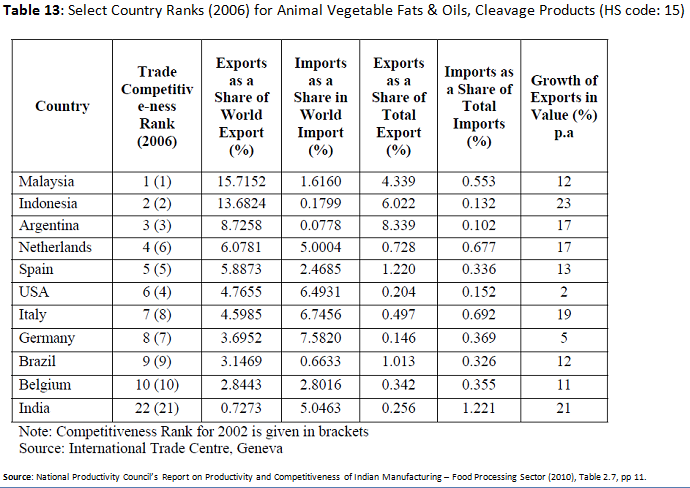
The last category of commodities where 2014-15 Imports exceeded Exports by 10 Billion USD is “Animal or vegetable fats and oils and their cleavage products; Pre. Edible fats; animal or vegetable waxes” with a trade deficit of 9.7 Billion USD and was included on account of the figure being much too close to 10 Billion USD to leave it out. The area represents an opportunity for Indian businesses as well as food processing sector. National Productivity Council’s Report on Productivity and Competitiveness of Indian Manufacturing – Food Processing Sector (2010) shows Malaysia, Indonesia and Argentina dominating the export markets of animal, vegetable fats and oils, cleavage products (HS Code: 15) with India the 22nd position in 2006, down from 21st in 2002. India’s healthy export growth of 21% during the period bettered only by Indonesia (at 23%) suggest the potential this sector has for India, more so because export earnings from China grew enormously during the period in question. The table below presents details relating to this group of commodities.
International Production of vegetable oil over a 32 year from 1975 is given below.
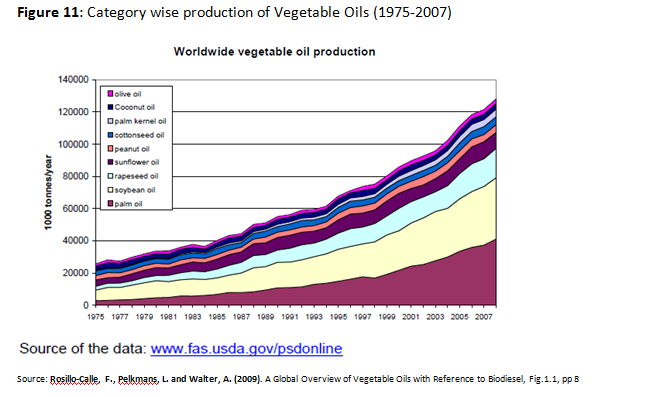
Worldwide usage of vegetable oils, naturally, shows a similar trend with an interesting addition to the market opportunity as shown in the figure below.
Figure 12: Key Usage of Vegetable Oils (1975-2007)
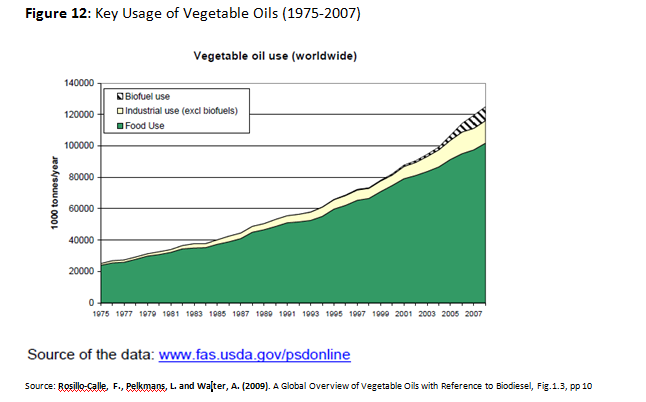
Biofuel presents a new category besides food use that was traditionally the main category. It is important to identify factors adversely affecting India’s performance in this sector. Findings of National Productivity Council’s survey of food processing units in March-April 2008 are presented below:
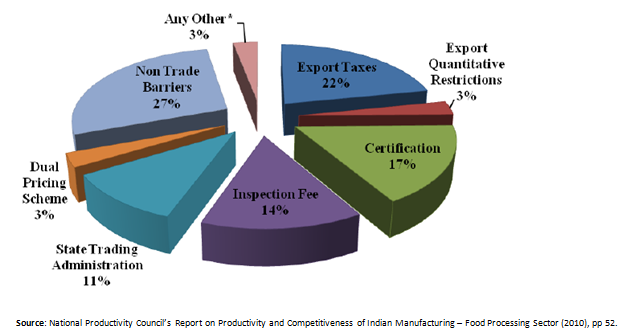
Besides the factors above, other impediments include inadequacy of skilled manpower, physical infrastructure like access to roads, specialized infrastructure like warehousing or cold storage, high cost of accessing testing laboratories, inefficient/unreliable supply chains and poor R&D further impede exports in food processing sector.
CONCLUSIONS AND RECOMMENDATIONS
The study carried out demonstrates that Policy makers in India have limited options in the short run. Based on data on Imports exceeding Exports by over 10 Billion USD, the negative balance is seen to be primarily on account of the following category of commodities:
- Mineral Fuels/Oils and Products of their distillation; Bituminous substances; Mineral Waxes;
- Electrical Machinery/Equipment, Sound Recorders/Reproducers and Television;
- Natural/Cultured Pearls, Precious/Semi-Precious Stones, Pre. Metals, Imit. Jewelry and Coin;
- Nuclear Reactors, Boilers, Machinery and Mechanical Appliances and Parts thereof; and
- Animal/Vegetable Fats/Oils and their Cleavage Products; Edible Fats; Animal or Vegetable Waxes.
Reversing the trade balance in the short run may, therefore, be far-fetched given the growing population and need to encourage economic growth. Categories (a), (b) and (d) above do not present much hope for restoring trade balance in the short and medium term. However, investing in alternate/renewable sources of energy, developing indigenous technology, encouraging indigenous production, investing in pearl farming and supporting food processing do appear to be possible ways of reducing the deficit. The biggest challenge among partner countries remains China with a rapidly growing deficit further highlighting the need for urgent measures to restore India’s trade balance.
LIMITATIONS OF THE STUDY
The study was carried out primarily as a desk study and reviewed data from 2009-10 onwards. Opinion of experts in different areas were not sought or considered barring what was available through available articles. Lack of field practitioner inputs presents itself as a primary limitation of this study. Further, since some of the recommendations, eg. Investing in renewable energy or in pearl farms have a long gestation period, such opinion becomes important is decisions are to be made on these findings. However, these findings do suggest possible areas of debate and discussion to restore India’s trade balance.
REFERENCES
- Agostini, C.A., Plottier, M.C. and Saavedra, E.H. (n.d.). Elasticities of Residential Electricity Demand in Chile. Retrieved from: http://www.uai.cl/RePEc/uai/wpaper/wp_034.pdf
- Cartier, L.E., Krzemnicki, M.S. and Ito, M. (2012). Cultured Pearl Farming and Production in the Federated States of Micronesia. Gems and Gemology, 48 (2): 108-122.
- Cartier, L. and Ali, S. (2012). Pearl Farming as a Sustainable Development Path. Solutions, 3 (4), Aug. 2012: 30-34. Retrieved from: http://espace.library.uq.edu.au/view/UQ:298115/UQ298115_OA.pdf
- Chinn, M.D. (2013). Global Imbalances. In: Gerard Capiro (Ed.) The Evidence and Impact of Financial Globalization, Vol. 3, pp 67-79. Oxford: Elsevier Inc. Retrieved from: http://www.ssc.wisc.edu/~mchinn/global_imbalances.pdf
- Goldar, B. (2010). Energy Intensity of Indian Manufacturing Firms: Effect of Energy Prices, Technology and Firm Characteristics. Retrieved from: http://www.mse.ac.in/Frontier/m13%20Goldar%20A.pdf
- Krishnamurthy, C.K.B. and Kristrom, B. (2013). Energy Demand and Income Elasticity: A Cross-Country Analysis. CERE Working Paper, 2013:5. Retrieved from: http://www.cere.se/documents/wp/2013/CERE_WP2013-5.pdf
- Labanderia, X., Labeaga, J.M. and Lopez-Otero, X. (2009). Estimation of Elasticity Price of Electricity with Incomplete Information. Economía de Cambio Climático, FEDEA – IBERDROLA, June 2009. Retrieved from: http://documentos.fedea.net/pubs/dt/2009/dt-2009-18.pdf
- Monypenny, R. and Haoatai, H. (2011). Export Demand for Tahitian Black Pearls. Australasian Agribusiness Review, 19, 2011. Retrieved from: https://www.agrifood.info/review/2011/Haoatai_Monypenny.pdf .
- National Productivity Council’s Report on Productivity and Competitiveness of Indian Manufacturing – Food Processing Sector (2010). Retrieved from: http://nmcc.nic.in/pdf/FoodProcessing_03July2010.pdf
- Oxford Economics (2011): Fossil Fuel Price Shocks and a Low Carbon Economy, Dec. 2011. Retrieved from: https://www.gov.uk/government/uploads/system/uploads/attachment_data/file/68831/5276-fossil-fuel-price-shocks-and-a-low-carbon-economy-.pdf
- Pachauri, S. and Fillippini, M. (2002). Elasticities of Electricity Demand in Urban Indian Households. CEPE Working Paper Nr.16, March 2002. Retrieved from: https://www1.ethz.ch/cepe/publications/workingPapers/CEPE_WP16.pdf
- Pakko, M.R. (1999). The US Trade Deficit and the “New Economy”. Review, September/October 1999: 11-20. Retrieved from: https://research.stlouisfed.org/publications/review/99/09/9909mp.pdf
- Polaski, S., Ganesh-Kumar, A., McDonald, S., Panda, M. and Robinson, S. (2008). India’s Trade Policy Choices: Managing Diverse Challenges. Carnegie Endowment for International Peace.
- Prasad, H.C., Sathish, R. and Singh, S.S. (2014). India’s Merchandise Exports: Some Important Issues and Policy Suggestions. Working Paper No. 3/2014-DEA, Department of Economic Affairs, Ministry of Finance, Government of India. Retrieved from: http://finmin.nic.in/workingpaper/Working%20Paper%20on%20Trade%2028082014.pdf
- Rosillo-Calle, F., Pelkmans, L. and Walter, A. (2009). A Global Overview of Vegetable Oils with Reference to Biodiesel. A report for the IEA Bioenergy Task 40, IEA Bioenergy, June 2009. Retrieved from: http://www.bioenergytrade.org/downloads/vegetableoilstudyfinaljune18.pdf
- Rossow, R. (2015). India’s Trade Reality: Goods Trade Imbalance with China Spikes. US-India Insight, 5 (6), June 2015. Retrieved from: http://csis.org/files/publication/150609_USIndiaInsight_June_Clean_0.pdf
- Suresh, K.G. and Gautam, V. (2015). Relevance of Twin Deficit Hypotheses: An Econometric Analysis with Reference to India. Theoretical Economics Letters, 2015, 5: 304-311.
- Tisdell, C. and Poirine, B. (2007). Economics of Pearl Oyster Culture. Economics, Ecology and The Environment, Working paper 143. Retrieved from: http://www.uq.edu.au/rsmg/docs/ClemWPapers/EEE/WP143.pdf. The study also cites Kuglemann, S. and Poirine, B. (2003), Etude Economique Des Determinants.
Weber,S. and Baranzini, A. (2013). Elasticities and Gasoline Demand in Switzerland. Energy Policy, 2013, 63: 674-680.

