A Refereed Monthly International Journal of Management
CAUSALITY BETWEEN ASSET INFLATION AND COMMODITY INFLATION
Author
|
Ritika Aggarwal
(Department of Economics, PGDAV College, Delhi University)
|
ABSTRACT
The relationship between asset price inflation and commodity price inflation, and more generally the significance of asset prices for monetary policy formulation, has been the subject of intense debate amongst academics and policymakers, particularly in the context of industrialized economies. Some developments evoked some curiosity about the role of asset price inflation in the general inflation process in a country like India that is undergoing financial liberalisation and rapid structural transformation and is being increasingly integrated with the global economy, abetted by wide-ranging market-oriented reforms initiated in the previous decade.
The objective of this paper is to analyse the impact of stock prices on the commodity price inflation in India for the period 1997-2016, using monthly data which would enable us to gather a much clearer picture of the relationship between asset prices and commodity prices.
Keywords: Inflation, Asset inflation, Commodity inflation, Cointegration, Granger causality
INTRODUCTION
Early work on the inclusion of asset prices in measures of inflation can be traced to Irving Fisher (1911). Fisher’s intent appears to have been a desire to find a broad transactions price metric to guide the monetary authority in establishing the price of gold. That is, he was considering an index number that best reflected the price level as implied by the equation of exchange.
A more recent development is the interest in the role of housing and equity prices for the design of monetary policy. Housing and equity prices may affect demand via direct and indirect wealth effects. A change in property and equity prices affects consumer wealth, which may induce consumers to change their consumption plans (Modigliani, 1971). Recent evidence reported in Case, Quigley and Shiller (2001) suggests that property prices have a stronger effect on household consumption than equity prices. A more indirect wealth effect of asset price movements operates via households’ and firms’ balance-sheets. Households and firms may be borrowing constrained due to asymmetric information in the credit market, which gives rise to adverse selection and moral hazard problems. As a result, households and firms can only borrow when they offer collateral, so that their borrowing capacity is a function of their net worth, which in turn depends on asset valuations. Share prices may provide a proxy for the net worth of listed companies. However, the balance sheet position of listed companies can, but does not necessarily have to be closely correlated with the balance sheet position of non-listed companies and of households. Property prices are likely to be a more useful indicator for the borrowing capacity of the private sector, since a large part of private sector credit is secured by real estate collateral.
Thus, from a theoretical point of view there seems to be a strong case also to consider property and share prices as determinants of aggregate demand, which would imply a direct reaction of monetary policy to movements in these asset prices. Cecchetti, Genberg, Lipsky and Wadwhani (2000) and Goodhart (2001) argue in favour of a direct response of monetary policy to asset price movements which are not in line with perceived fundamentals, while Bernanke and Gertler (1999) and Gertler, Goodfriend, Issing and Spaventa (1998) are more sceptical. The consequences of a direct response of monetary policy to asset prices is usually analysed based on calibrated models (see e.g. Bernanke and Gertler, 1999).
The financial crises in Japan during the early 1990s and, more recently, in Southeast Asia have only served to reinforce the concerns relating to asset prices, an upsurge in which had coexisted with low levels of commodity price inflation in those economies, apparently masking their impending and virulent collapse. More recently, the concerns relating to the sharp downturn in technology, media and telecommunications (TMT) stocks across the globe after their spectacular run-up, as well as evidence of the existence of strong links between asset (stock) prices and the real economy even in emerging market countries, have fuelled the ongoing debate. Such developments evoked some curiosity about the role of asset price inflation in the general inflation process in a country like India that is undergoing financial liberalisation and rapid structural transformation and is being increasingly integrated with the global economy, abetted by wide-ranging market-oriented reforms initiated in the previous decade.
Asset prices have until recently and quite understandably given the nascency of the reform process, been somewhat ignored in the traditional explanations of the inflation process in India, viz. the monetarist and structuralist schools. Consequent upon the external payments crisis of 1990-91, a process of structural reforms was set in motion in India. With the advent of reforms, financial markets, including capital markets, have undergone significant liberalisation, mainly reflected in the deregulation of interest rates, the progressive latitude accorded to private sector entities, including foreign players, institutional changes and the development of new products. These changes have not only resulted in the rapid growth of financial markets but have also strengthened their interlinkages. At the same time, a distinct moderation in the commodity price inflation rate was witnessed during the second half of the 1990s, from its relatively high average level of 8 to 9% in the past, reflecting to some extent the salutary impact of the reform process.
The review of the vast literature suggests a negative relationship between asset price inflation and commodity price inflation. We try and capture this relationship while testing the nature and direction of causality between the two. By plotting our raw data for asset inflation and commodity inflation over the period 1997-2016, we are able to establish the negative relationship, as can be seen in Chart 1.
CHART1: TRENDS IN ASSET INFLATION VS. COMMODITY INFLATION
(1997-2016)
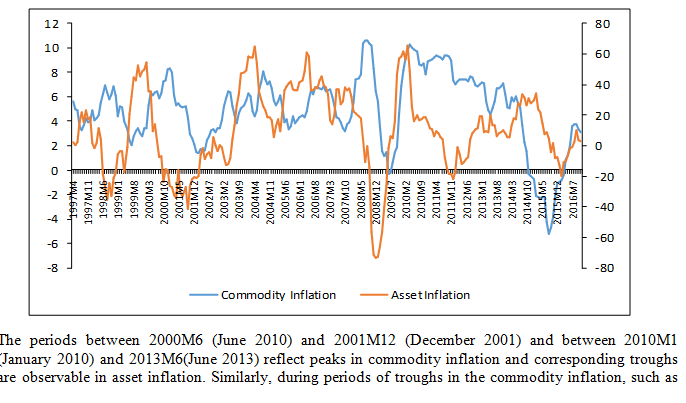
between 2014M10 (October 2014) and 2015M12 (December 2015), peaks are observed in the asset price inflation, thus indicating a negative relationship between the two variables.
- EMPRICAL MODEL AND DATA SOURCES
We construct a reduced form cointegrated vector autoregression model to study the importance of asset prices for commodity price inflation.
Commodity price inflation = f (asset price inflation, output growth, interest rate, money growth)
The importance of asset prices for commodity price inflation is explored by means of an unrestricted reduced form vector autoregression (VAR) model, in the tradition of Sims (1980). Accordingly, we construct a VAR model of the form:
Xt = B0 + C(L) Xt-1 (1)
where X is the vector of variables, and C(L) is a lagged polynomial operator of order N.
The choice of variables in our empirical investigation includes a proxy for commodity price inflation, a proxy for asset price inflation, the real output gap, a nominal interest rate, and a variable capturing monetary growth. We have taken equity as the chosen asset. The choice of the sample period is monthly data from April 1997 to November 2016.
Thus, the following variables have been taken into consideration.
- GIIP: Output gap (Y - Y*): GDP numbers in India have been available at a quarterly frequency only in the recent period. Hence, we use the monthly index of industrial production (IIP) as the proxy for the activity variable. Since we have confined our analysis to the stock market, a much narrower notion of industrial activity has been adopted, namely IIP on account of manufacturing (Y). In order to construct an index of potential output, we have taken Hodrick-Prescott filtered values of Y (denoted by Y*), and taken the deviation of Y from Y* as a measure of the output gap [Hodrick and Prescott (1997)].
Source: www.mospi.nic.in (CSO)
- GWPI (Inflation): Corresponding to the measure of output, we take the wholesale price index (WPI) for manufactured products as the relevant price index and its rate of change as the measure of inflation.
Source: www.mospi.nic.in (CSO, price indices of manufactured product)
- GBSE: Stock price inflation (S): This is taken as the rate of change in the BSE sensitive index (SENSEX).
Source: www.rbi.org. (Data on BSE index)
- CMR: Interest rate (i): The weighted call money rate in the Bombay market is taken as the interest rate.
Source: www.rbi.org
- GM3: Monetary growth rate (m): The growth rate of broad money, or M3, is taken as the monetary growth rate.
Source: www.rbi.org (monetary indices)
- METHODOLOGY FOR TESTING
Tests for Stationarity
The first econometric step in estimation strategy is to test if the series are stationary. The classical regression model requires that the dependent and independent variables in a regression be stationary in order to avoid the problem of what Granger and Newbold (1974) called ‘spurious regression’. Three different types of unit root testing have been conducted, Augmented Dickey Fuller (ADF), DF - GLS test, and Phillips-Peron test. Autocorrelation Functions (ACF) and Partial Autocorrelation Functions (PACF) are plotted for each variable to give the visual representation of the autocorrelation of the variables of interest. Through these graphs, we get a rough idea about the stationarity of the data series and the lag length to be used in testing for stationarity. However, as the graphs of the major variables show, there is no structural break in the data series, except of interest rates. Peron’s Test for structural break is conducted for interest rates.
Johansen Cointegration Testing
If the variables are nonstationary, we test for the possibility of a cointegrating relationship using the Johansen and Juselius (1990) methodology. If the variables are indeed cointegrated, we can construct a vector error-correction model that captures both the short run and long-run dynamics (Dua and Pandit, 2001). If two variables are cointegrated, i.e. they have a common trend, causality in the Granger (temporal) sense must exist in at least one direction (Granger, 1986; 1988). The concept of cointegration is that non-stationary time series are cointegrated if a linear combination of these variables is stationary. The cointegration requires the error term in the long-run relation to be stationary. Suppose there are two variables Yt and Xt and both follow I (1) process, Still the linear combination Ut = Yt – áXt is I (0). If so, both Yt and Xt are said to be cointegrated and ‘a’ is the cointegrating parameter.
The number of independent cointegrating vector is equal to the rank of matrix π, If rank of π = 0; then π is a null matrix and equation turns out to be a VAR model, whereas If rank of π =1, there is one cointegrating vector and π xt-1 is an error correction term. Johansen suggests that it can be done by testing the significance of characteristic roots of π.
Johansen suggests two test statistics to test the null hypothesis that numbers of characteristic roots are insignificantly different from unity.
where
λi= estimated characteristic roots or Eigen values
T = the number of usable observations
λtrace test the null hypothesis r = 0 against the alternative of r > 0
λmax test the null hypothesis r = 0 against the alternative of r = 1. The concept of Granger causality is extended in the framework of a vector error correction model (VECM) to include the error correction term in addition to lagged variables of the variables (Dua and Pandit, 2001).
Johansen Cointegration Test has the following steps: (1) Assess the order of integration for each variable under consideration (2) Estimate cointegration regression and construct error correction model, using variables with same order of integration and analyze cointegrating vector (CV) 3) Do the Granger Causality test
Engle and Granger (1987) method finds out only one co-integrating vector through two step estimation approach. While on the other hand, a number of vectors can be found using maximum likelihood testing procedure suggested by Johansen (1988) and Johansen and Juselius (1990) in the Vector Autoregressive (VAR) representation.
The general form of VAR can be written as following:
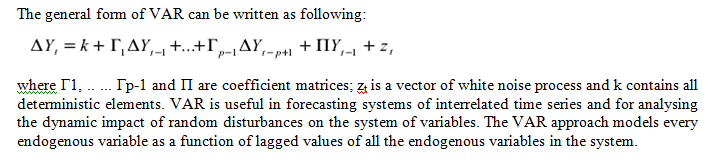
Impact Analysis
Impulse Response Functions (IRF) and Forecast Error Variance Decomposition (FEVD) are then estimated from the VAR system. The IRF trace the impact of one standard error change in the exogernous variable on the endogenous variable. The FEVD decomposes variations in an endogenous variable into component shocks giving information about the relative importance of each random shock to the variable. The FEVD tells us the proportion of movement in a sequence due to its “own” shocks versus the shocks due to other variables (Enders, 1995). The empirical validation of the model is carried out through cointegration analysis by estimating long-run relationship between the variables and the short-run dynamics employing VECM.
Generating Series for Output Gap using Hodrick-Prescott Filter
As explained above, we take Index of Industrial production as a proxy for output. In order to generate an index on potential output we use Hodrick-Prescott filter with a lambda of 14400 (since we are using monthly data). Then we take deviations from actual output to generate an index of output gap.
- RESULTS
Tests for Stationarity
The ACF and PACF graphs show that the series is decaying geometrically and oscillating and first four lags are significant. Hence, we will take only four lags in the series. Both trend and intercept are significant. We undertake Augmented Dickey Fuller (ADF) test and start with the full model, and conduct unit root testing in sequential way. The following results come through:
|
Only Levels
|
|
|
|
|
|
|
|
|
ADF test
|
|
|
|
|
|
|
|
|
Test Variable
|
Full Model: Null: γ=0: τt
|
Null: γ=a2=0: Φ3
|
Only Intercept: τµ
|
Φ1
|
a0=0: t-test
|
Τ
|
Conclusion on Unit root
|
|
Calculated
|
--4.93
|
|
|
|
|
|
Contains no unit root and drift
|
|
1%
|
-4.03
|
|
|
|
|
|
|
5%
|
-3.445
|
|
|
|
|
|
|
10%
|
-3.147
|
|
|
|
|
|
The ADF test suggest that the series is stationary at levels and is hence I(0).
The ACF and PACF graphs show that the series is decaying geometrically and oscillating and only the first lag is significant. When we conducted serial correlation testing for the residuals, it was found that it’s better to go with no lags. Both trend and intercept are significant. We start with the full model, and conduct unit root testing in sequential way. The following results come through:
|
Only Levels
|
|
|
|
|
|
|
|
|
ADF test
|
|
|
|
|
|
|
|
|
Test Variable
|
Full Model: Null: γ=0: τt
|
Null: γ=a2=0: Φ3
|
Only Intercept: τµ
|
Φ1
|
a0=0: t-test
|
Τ
|
Conclusion on Unit root
|
|
Calculated
|
-2.0195
|
2.1888
|
-2.0864
|
-2.2199
|
|
-0.687
|
Contains unit root and drift
|
|
1%
|
-4.029
|
8.73
|
-3.480
|
6.70
|
|
-2.583
|
|
5%
|
-3.444
|
6.49
|
-2.883
|
4.71
|
|
-1.943
|
|
10%
|
-3.147
|
5.47
|
-2.579
|
3.86
|
|
-1.6151
|
|
First Difference
|
|
|
|
|
|
|
|
|
Calculated
|
-13.7176
|
|
|
|
|
|
Contains no unit root and drift
|
|
1%
|
-4.030
|
|
|
|
|
|
|
5%
|
-3.444
|
|
|
|
|
|
|
10%
|
-3.147
|
|
|
|
|
|
The ADF test suggests that the series on growth rate of money supply is stationary at first difference. So it is I(1).
The ACF and PACF graphs show that the series is decaying geometrically and upto 12 lags are significant. When we conducted serial correlation testing for the residuals, it was found that it’s better to go with twelve lags only. Both trend and intercept are significant. We start with the full model, and conduct unit root testing in sequential way. The following results come through:
|
Only Levels
|
|
|
|
|
|
|
|
|
ADF test
|
|
|
|
|
|
|
|
|
Test Variable
|
Full Model: Null: γ=0: τt
|
Null: γ=a2=0: Φ3
|
Only Intercept: τµ
|
Φ1
|
a0=0: t-test
|
Τ
|
Conclusion on Unit root
|
|
Calculated
|
-3.7620
|
|
|
|
|
|
Contains no unit root and drift
|
|
1%
|
-4.030
|
|
|
|
|
|
|
5%
|
-3.444
|
|
|
|
|
|
|
10%
|
-3.147
|
|
|
|
|
|
The ADF test suggests that at 5% level of significance, the series does not contain any unit root. Hence the series is stationary in levels.
The ACF and PACF graphs show that the series is decaying geometrically and first three lags are significant. When we conducted serial correlation testing for the residuals, it was found that it’s better to go with three lags only. Both trend and intercept are significant. We start with the full model, and conduct unit root testing in sequential way. The following results come through:
|
Only Levels
|
|
|
|
|
|
|
|
|
ADF test
|
|
|
|
|
|
|
|
|
Test Variable
|
Full Model: Null: γ=0: τt
|
Null: γ=a2=0: Φ3
|
Only Intercept: τµ
|
Φ1
|
a0=0: t-test
|
Τ
|
Conclusion on Unit root
|
|
Calculated
|
-3.2794
|
5.578
|
-3.319
|
5.51
|
5.72
|
-2.736
|
Contains no unit root and drift
|
|
1%
|
-4.013
|
8.73
|
-3.482
|
6.70
|
|
-2.583
|
|
5%
|
-3.445
|
6.49
|
-2.884
|
4.71
|
|
-1.943
|
|
10%
|
-3.147
|
5.47
|
-2.5789
|
3.86
|
|
-1.615
|
If we conduct sequential testing, we find that at the smallest model without trend and intercept the series turns out to be stationary in levels, hence it is I(0).
The ACF and PACF graphs show that the series is decaying geometrically and only the first lag is significant. When we conducted serial correlation testing for the residuals, it was found that it’s better to go zero lags only. Both trend and intercept are significant. We start with the full model, and conduct unit root testing in sequential way. The following results come through:
|
Only Levels
|
|
|
|
|
|
|
|
|
|
ADF test
|
|
|
|
|
|
|
|
|
|
Test Variable
|
Full Model: Null: γ=0: τt
|
Null: γ=a2=0: Φ3
|
a0=0: t-test
|
Only Intercept: τµ
|
Φ1
|
a0=0: t-test
|
Τ
|
Conclusion on Unit root
|
|
Calculated
|
-3.842
|
7.469
|
3.157
|
-3.874
|
|
|
|
Contains no unit root and drift
|
|
1%
|
-4.02
|
8.73
|
|
-3.476
|
|
|
|
|
5%
|
-3.444
|
6.49
|
|
-2.88
|
|
|
|
|
10%
|
-3.145
|
5.47
|
|
-2.577
|
|
|
|
If we conduct sequential testing, we find that at the smallest model without trend and intercept the series turns out to be stationary in levels, hence it is I(0).
Johansen Cointegration Test Results
We follow the below mentioned steps:
Step 1: Asses the order of integration for each variable under consideration. We conduct the lag selection tests to find the order of lag for the cointegrating model.
TABLE 1: LAG SELECTION TESTS
|
Lag
|
LogL
|
LR
|
FPE
|
AIC
|
SC
|
HQ
|
|
1
|
-2474.608
|
NA
|
2291.674
|
21.92639
|
22.30241*
|
22.07810
|
|
2
|
-2417.379
|
109.4391
|
1727.738*
|
21.64367*
|
22.39572
|
21.94710*
|
|
3
|
-2401.818
|
29.07314
|
1878.151
|
21.72648
|
22.85455
|
22.18162
|
|
4
|
-2369.225
|
59.46910
|
1759.422
|
21.65987
|
23.16396
|
22.26672
|
|
5
|
-2355.055
|
25.23287
|
1938.956
|
21.75486
|
23.63499
|
22.51344
|
|
6
|
-2338.633
|
28.52114
|
2097.296
|
21.83012
|
24.08626
|
22.74040
|
|
7
|
-2321.319
|
29.31274
|
2253.818
|
21.89753
|
24.52971
|
22.95954
|
|
8
|
-2298.275
|
38.00298*
|
2306.862
|
21.91469
|
24.92289
|
23.12841
|
|
|
|
|
|
|
|
|
|
* indicates lag order selected by the criterion
|
|
|
|
|
LR: sequential modified LR test statistic (each test at 5% level)
|
|
|
|
FPE: Final prediction error
|
|
|
|
|
|
AIC: Akaike information criterion
|
|
|
|
|
|
SC: Schwarz information criterion
|
|
|
|
|
|
HQ: Hannan-Quinn information criterion
|
|
|
|
The next step is to find the number of cointegrating vectors. Here, both the trace test and maximum eigenvalue test show the rejection of no cointegrating vector. However, both the tests signify the presence of one cointegrating vector.
TABLE 2: TRACE TEST AND MAX EIGENVALUE TEST TO ASCERTAIN THE NUMBER OF COINTEGRATING VECTORS
|
Unrestricted Cointegration Rank Test (Trace)
|
|
|
Hypothesized
|
|
Trace
|
0.05
|
|
|
No. of CE(s)
|
Eigenvalue
|
Statistic
|
Critical Value
|
Prob.**
|
|
|
|
|
|
|
|
|
|
|
|
|
|
None *
|
0.167708
|
93.38741
|
76.97277
|
0.0017
|
|
At most 1
|
0.094756
|
50.61528
|
54.07904
|
0.0984
|
|
At most 2
|
0.055230
|
27.41988
|
35.19275
|
0.2682
|
|
At most 3
|
0.049364
|
14.18221
|
20.26184
|
0.2771
|
|
At most 4
|
0.010192
|
2.386900
|
9.164546
|
0.7001
|
|
|
|
|
|
|
|
Trace test indicates 1 cointegrating eqn(s) at the 0.05 level
|
|
* denotes rejection of the hypothesis at the 0.05 level
|
|
**MacKinnon-Haug-Michelis (1999) p-values
|
|
|
Unrestricted Cointegration Rank Test (Maximum Eigenvalue)
|
|
Hypothesized
|
|
Max-Eigen
|
0.05
|
|
|
No. of CE(s)
|
Eigenvalue
|
Statistic
|
Critical Value
|
Prob.**
|
|
|
|
|
|
|
|
None *
|
0.167708
|
42.77213
|
34.80587
|
0.0046
|
|
At most 1
|
0.094756
|
23.19540
|
28.58808
|
0.2098
|
|
At most 2
|
0.055230
|
13.23767
|
22.29962
|
0.5337
|
|
At most 3
|
0.049364
|
11.79531
|
15.89210
|
0.1982
|
|
At most 4
|
0.010192
|
2.386900
|
9.164546
|
0.7001
|
|
|
|
|
|
|
|
Max-eigenvalue test indicates 1 cointegrating eqn(s) at the 0.05 level
|
|
* denotes rejection of the hypothesis at the 0.05 level
|
|
**MacKinnon-Haug-Michelis (1999) p-values
|
|
Step 2: Estimate cointegration regression and construct error correction model, using variables with same order of integration as shown in table 3.
TABLE 3: COINTEGRATING EQUATION NORMALISED WRT GWPI
|
1 Cointegrating Equation(s):
|
Log likelihood
|
-2462.317
|
|
|
|
|
|
|
|
|
|
|
|
|
|
|
|
|
|
Normalized cointegrating coefficients (standard error in parentheses)
|
|
|
GWPI
|
GIIP
|
GBSE
|
GM3
|
CMR
|
C
|
|
1.000000
|
2.520258
|
-0.412418
|
-2.282796
|
4.400233
|
-9.080297
|
|
|
(0.54386)
|
(0.10339)
|
(0.66408)
|
(0.97090)
|
(11.8206)
|
|
|
|
|
|
|
|
|
Adjustment coefficients (standard error in parentheses)
|
|
|
|
D(GWPI)
|
-0.008127
|
|
|
|
|
|
|
(0.00382)
|
|
|
|
|
|
D(GIIP)
|
-0.074878
|
|
|
|
|
|
|
(0.01617)
|
|
|
|
|
|
D(GBSE)
|
-0.068804
|
|
|
|
|
|
|
(0.04824)
|
|
|
|
|
|
D(GM3)
|
0.009362
|
|
|
|
|
|
|
(0.00612)
|
|
|
|
|
|
D(CMR)
|
-0.037452
|
|
|
|
|
|
|
(0.01067)
|
|
|
|
|
|
|
|
|
|
|
|
The estimated long-run relationship is:
2.520 GIIPt - 0.412 GBSEt - 2.283 GM3t + 4.400CMRt - 9.080
Step 3: Do the Granger Causality test
TABLE 4: GRANGER CAUSALITY TEST
|
Null Hypothesis:
|
Lags
|
Obs
|
Chi-sq Statistic
|
Prob.
|
Decision
|
|
|
|
|
|
|
|
|
|
|
|
|
|
|
|
GIIP does not Granger Cause GWPI
|
2
|
233
|
3.829155
|
0.1474
|
Do not reject null
|
|
|
GWPI does not Granger Cause GIIP
|
0.385502
|
0.8247
|
Do not reject null
|
|
|
|
|
|
|
|
|
|
|
|
|
|
|
|
GBSE does not Granger Cause GWPI
|
2
|
233
|
2.624637
|
0.2692
|
Do not reject null
|
|
|
GWPI does not Granger Cause GBSE
|
8.747376
|
0.0126
|
Reject null
|
|
|
|
|
|
|
|
|
|
|
|
|
|
|
|
GM3 does not Granger Cause GWPI
|
2
|
233
|
0.232222
|
0.8904
|
Do not reject null
|
|
|
GWPI does not Granger Cause GM3
|
8.929267
|
0.0115
|
Reject null
|
|
|
|
|
|
|
|
|
|
|
|
|
|
|
|
CMR does not Granger Cause GWPI
|
2
|
233
|
0.121598
|
0.9410
|
Do not reject null
|
|
|
GWPI does not Granger Cause CMR
|
0.075713
|
0.9629
|
Do not reject null
|
|
|
|
|
|
|
|
|
|
|
|
|
|
|
|
GBSE does not Granger Cause GIIP
|
2
|
233
|
0.773257
|
0.6793
|
Do not reject null
|
|
|
GIIP does not Granger Cause GBSE
|
1.114963
|
0.5726
|
Do not reject null
|
|
|
|
|
|
|
|
|
|
|
|
|
|
|
|
GM3 does not Granger Cause GIIP
|
2
|
233
|
3.575280
|
0.1674
|
Do not reject null
|
|
|
GIIP does not Granger Cause GM3
|
1.227042
|
0.5414
|
Do not reject null
|
|
|
|
|
|
|
|
|
|
|
|
|
|
|
|
CMR does not Granger Cause GIIP
|
2
|
233
|
5.893691
|
0.0525
|
Reject null at 10%
|
|
|
GIIP does not Granger Cause CMR
|
1.839202
|
0.3987
|
Do not reject null
|
|
|
|
|
|
|
|
|
|
|
|
|
|
|
|
GM3 does not Granger Cause GBSE
|
2
|
233
|
1.212650
|
0.5454
|
Do not reject null
|
|
|
GBSE does not Granger Cause GM3
|
1.810015
|
0.4045
|
Do not reject null
|
|
|
|
|
|
|
|
|
|
|
|
|
|
|
|
CMR does not Granger Cause GBSE
|
2
|
233
|
0.102564
|
0.9500
|
Do not reject null
|
|
|
GBSE does not Granger Cause CMR
|
1.524018
|
0.4667
|
Do not reject null
|
|
|
|
|
|
|
|
|
|
|
|
|
|
|
|
CMR does not Granger Cause GM3
|
2
|
233
|
2.12234
|
0.3460
|
Do not reject null
|
|
|
GM3 does not Granger Cause CMR
|
2.48575
|
0.2885
|
Do not reject null
|
|
|
|
|
|
|
|
|
|
|
|
|
|
|
|
|
|
|
|
|
|
|
|
The above results suggest that the null hypothesis of commodity price inflation not granger causing asset price inflation is getting rejected. Hence this supports our view that in the last two decades there is a linkage between commodity price inflation and asset price inflation, the former granger causing the latter. This can be further reinforced with impulse responses and factor error variance decomposition. Results also suggest that commodity price inflation granger causes the growth of money supply.
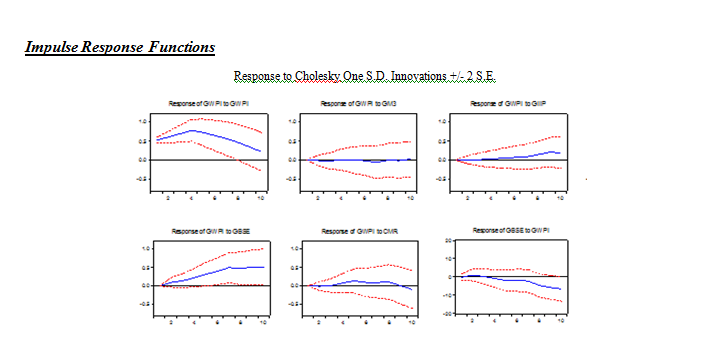
An IRF indicates the impact of an unanticipated one-unit change (one standard deviation) in the "impulse" variable on the "response" variable over the next several periods. Hence, looking at the impulse response of GBSE to GWPI, a shock of one S.D. to GWPI is expected to lead to a change in GBSE of -0.75 units after 10 periods.
Factor Error Variance Decomposition
|
Period
|
WI
|
GIIP
|
GBSE
|
GM3
|
CMR
|
|
|
|
|
|
|
|
|
|
|
|
|
|
|
|
1
|
100.0000
|
0.000000
|
0.000000
|
0.000000
|
0.000000
|
|
2
|
98.42093
|
0.194145
|
1.073380
|
0.130024
|
0.181524
|
|
3
|
96.09085
|
0.169638
|
2.900744
|
0.214314
|
0.624459
|
|
4
|
93.17576
|
0.114855
|
5.108352
|
0.301321
|
1.299711
|
|
5
|
89.98278
|
0.090733
|
7.353295
|
0.415219
|
2.157971
|
|
6
|
86.81552
|
0.101311
|
9.468281
|
0.532935
|
3.081957
|
|
7
|
83.83711
|
0.138903
|
11.38747
|
0.645567
|
3.990947
|
|
8
|
81.12600
|
0.190517
|
13.08200
|
0.751698
|
4.849785
|
|
9
|
78.71323
|
0.249472
|
14.55681
|
0.848035
|
5.632456
|
|
10
|
76.59320
|
0.309700
|
15.83230
|
0.933671
|
6.331131
|
|
|
|
|
|
|
|
CONCLUSION
In this paper we try to find out a link between asset price inflation and commodity price inflation. This exercise was conducted on monthly data for Indian economy for the period April 1997 to November 2016. We model inflation of manufactured products as a proxy for commodity price inflation as a function of output gap (proxy was index for industrial production), growth of money supply, changes in BSE sensitive index as a proxy for asset price inflation and call money rate. We find that all series are stationary at levels except growth of money supply. Hence we take a first difference of it in our model. Johansen’s test for cointegration suggests that there is one cointegrating relationship between the variables. Tests for granger causality suggest that commodity price inflation granger causes stock price inflation. This result is reinforced by impulse responses and factor error variance decomposition.
REFERENCES
Michael F. Bryan, Stephen G. Cecchetti and Róisín O.Sullivan (2002), “Asset Prices in the Measurement of Inflation”, NBER Working Paper Series, Working Paper 8700, January 2002.
M. Rene (1986), “Asset Pricing and Expected Inflation”, Journal of Finance, Vol. XLI, No. 1, March 1986.
Charles Goodhart and Boris Hofmann (2002), “Asset Prices and the Conduct of Monetary Policy”, University of Bonn.
Dua, P. and Pandit, B.L. (2001), “Interest Rate Determination in India: the Role of Domestic and External Factors”, CDE Working Paper No. 92, Delhi School of Economics
Jeffrey A. Frankel (2006), “The Effect Of Monetary Policy On Real Commodity Prices”, Working Paper 12713, National Bureau of Economic Research, December 2006.
Partha Ray and Somnath Chatterjee (2006), “The Role of Asset Prices in Indian Inflation in Recent Years: Some Conjectures”, BIS paper No.8.
Boudoukh, J and M Richardson (1993), “Stock Returns and Inflation: A Long-Horizon Perspective”, American Economic Review, 83(5), pp 1346-55.
Browne, L E, R Hellerstem and J S Little (1998), “Inflation, Asset Markets, and Economic Stabilisation: Lessons from Asia”, New England Economic Review, September/October.
Fama, E and G W Schwert (1977), “Asset Returns and Inflation”, Journal of Financial Economics, 4, pp 115-46.
Filardo, A W (2000), “Monetary Policy And Asset Prices”, Federal Reserve Bank of Kansas City, Economic Review, 85(3), pp 11-37.
Goodhart, C and B Hoffman (2000), “Do Asset Prices Help To Predict Consumer Price Inflation?” The Manchester School (Supplement), September, pp 122-40.
Kent, C and P Lowe (1997), “Asset-Price Bubbles and Monetary Policy”, Research Discussion Paper no 9709, Reserve Bank of Australia, December.
Costa, C.T., Silva W.V., Brito, L. and Veiga, C.P. (2017), “Empirical Evidence of the Existence of Speculative Bubbles in the Prices of Stocks Traded on the Sao Paulo Stock Exchange”, Contaduria y Administracion, University of Mexico, Forthcoming
Pethe, Abhay and Ajit Karnik (2000), “Do Indian Stock Markets Matter? Stock Market Indices and Macroeconomic Variables”, Economic and Political Weekly, 35, pp 349-56.
Smets, F (1997), “Financial Asset Prices and Monetary Policy: Theory and Evidence”, BIS Working Paper no 47, September.
Vickers, John (2000), “Monetary Policy and Asset Prices”, The Manchester School (Supplement), pp 1-22.
Srivyal Vuyyuri (2009), “Relationship between Real and Financial Variables in India: A Cointegration Analysis” University of Hyderabad.
Fama, E. F., (1990), “Stock Returns, Expected Returns and Real Activity”, The Journal of Finance, 45(4), pp. 1089-1108.
Fama, E. F. and Schwert, G. W., (1977), “Asset Return and Inflation,” Journal of Financial Economics, 5(1), pp. 115-146.
Ricardo J. Caballero Emmanuel Farhi Pierre-Olivier Gourinchas (2008), “Financial Crash, Commodity Prices and Global Imbalances”, Brookings paper on Economic Activity Conference, Sept 2008.
Gunther Capelle-Blancard and Dramane Coulibaly (2011), “Index Trading and Agricultural Commodity Prices: A Panel Granger Causality Analysis”, CEPII, WP No 2011 – 28.

