Investigating the relationship between characteristics of chief
executive officer and company ownership with investment cash flow sensitivity
|
Leila Shadman Panabandani
Department of Accounting
Rasht Branch
Islamic Azad University
Rasht, Iran
|
Mohamad Aghaei Bejarkenari
Department of Accounting
Rudbar Branch
Islamic Azad University
Rudbar, Iran
Email: Aghaei_m3@yahoo.com
|
Mehdi Meshki
Department of Accounting
Payame Noor University
Rasht, Iran
|
Abstract
The main purpose of the study is to investigate the relationship
between characteristics of chief executive officer and company ownership with investment
cash flow sensitivity. In order to assess the exact impact of each factor on
the dependent variables, each of these components were tested in the two main
hypotheses. The purpose of the study is applied and its method is descriptive-correlation.In
order to test the hypotheses, 74 companies of Tehran Stock Exchange from2010 to
2014 were selected from 370 companies. The results of the study showed a
significant negative relationship between the characteristics of chief
executive officer and company ownership with investment cash flow sensitivity.
According to the tests, there is a significant negative relationship between characteristics
of chief executive officer and company ownership with investment cash flow
sensitivity; that is, more optimistic chief executive officer and focus on
stock can result in the reduction of investment cash flow sensitivity.
Keywords: management optimism, investment cash flow sensitivity, company ownership
Introduction
An important purpose of financing is investing in companies to be
more profitable. To maximize the value of the company, company executives are
seeking to implement profitable investments; implementing these profitable
projects requires financing. The only source of funding is not shortage of bank
liquidity facilities and there are other solutions. Domestic financial
constraints are limitations in relation to resources (cash) within the business
unit and can be raised under the agency cost. The company reliance on domestic
resources can be determined through "investment cash flow
sensitivity" of that company. It is argued that companies that are
experiencing financial constraints possess more investment cash flow
sensitivity.To be able to finance their investment projects, companies that
suffer from more severe failure related to the capital market rely more on
domestic resources. Based on this idea, Fazzary et al. introduced an index
called "investment cash flow sensitivity" (Almedia, 2004). This index
is defined as measuring the rate of change in capital expenditure by companies
in exchange for a unit change in cash flow. Accordingly, the higher the sensitivity
of investment spending to corporate cash flows is, the more reliance the
company has on its domestic resources; therefore, it suffers from higher financial limitations. In addition, according to this
index, in the case of companies that suffer from serious capital market
imperfections, there is a higher sensitivity of investment cash flow
(Mohammadi, 2010).
To divide the company in terms of financing constraints, financial
constraints must be defined first. The most complete and most correct
definition in this case is thatwhen companies are faced with a gap between
internal and external costs of allocated funds, they are in the range of
financing.From among the main reasons for the differences between internal and
external financing costs, asymmetric information and agency problems can be
named. In the case of information asymmetry, investors have little information
about the status of companies' capital projects; therefore, in order to invest
in such companies, they demand a higher rate of return. Agency problems can
cause distrust between managers, and investors demand a higher rate of return
for financing the investment projects they charge.Based on the abovementioned
issues, it can be argued that companies suffering from serious failure related
to the capital market rely more on domestic sources in order to finance their
investment projects (Haqiqat, 2013).
Based on this idea, Fazzary et al. (1988) introduced an index
called "investment cash flow sensitivity." This index is defined as
measuring the rate of change in capital expenditure of company in exchange for
a unit change in cash flow. Accordingly, the higher the sensitivity of
investment spending to corporate cash flows is, the more reliance the company
has on its domestic resources; therefore, it suffers from higher financial limitations. In addition, according to this
index, in the case of companies that suffer from serious capital market
imperfections, there is a higher sensitivity of investment cash flow
(Mohammadi, 2013).
Managers have a critical role in organizational dynamics. They
provide the possibility of allowing flexibility and responsiveness to
environmental changes, pave the way for the coordination of different group
activities in the organization, satisfy individual needs, and facilitate
organizational membership. Philosophy of management is inextricably linked with
decision-making and,with a little thought, we find that managers donot do
anything except decision-making.In a sense, all actions of a manager are mixed
with decision. In addition to decision-making, managers have features and
characteristics that their crystallization in management distinguishes managers
from employees who are under their supervision. These characteristics and
features can be divided generally and specifically (Sadidi, 2014).
The first question that arises here thatwe are looking for an
answer to it in this study is whether there is a significant relationship
between the characteristics of chief executive officer and investment cash flow
sensitivity.
Organization for Economic Development (1998) defines corporate
governance as: "complex relationships between management (executive),
board of directors, shareholders and other relevant parties in a company."
In other words, corporate governance specifies a structure through which company
objectives are set, methods to achieve goals are determined, and, finally,
criteria and mechanisms of supervision and performance guidance are identified
(Asgari, 2014). Regardless of the legal framework, ownership structure of
companies can also affect the creation and development of the model of corporate
governance.Ownership structure has two dimensions: the ownership concentration
and identity of shareholders. Shareholders are the owners of the company who
assign business operations on behalf of themselves to managers that may result
in the conflict of interest. UK and America have a large number of Public Joint
Stock Companies which have widely dispersed ownership in most cases and
shareholders have little impact on the company's management, and they are
almost identical in terms of stock ownership structure;while in the countries
that are the origin and source of civil law, such as Japan and Germany, they
have concentrated ownership structure in most cases. Dispersed ownership structure
leads to faster agency problems. According to Solomon, separation of the role
of chief officer (chairman) and executive director is one of the ways to reduce
the agency problems. In addition, the study of Peel and Aodnel (1995) confirms
this issue and shows that, because of more independent managers' decisions,
companies that have such a breakdown, their financial performance has been
better. Thus, with the inclusion of recommendations on the roles of chief
officer and executive director by separate entities in the Combined Corporate
Governance Code, UK seeks to reduce agency problems. Similarly, Canada seeks to
strengthen shareholders'control on managers of the company by applying the same
procedures and breakdown of responsibilities at the head of the company. In
contrast, Daily and Dalton (1997) found no significant positive correlation
between company's performance and duty division of chief officers and executive
directors. Accordingly, the Sarbanes–Oxley Act considered the possibility of
running both roles as practical even though the ownership structure of
shareholders in America is highly fragmented.Because countries with civil law
have a weaker support of investors, ownership concentration is higher in these
countries; therefore, in a company with a relatively concentrated ownership
structure, conflict of interests is created between major shareholders and
minority shareholders. Conversely, in countries with common law, the rights of
investors are protected more effectively and, thus, ownership can be widely
distributed (Isfahan Portal). Now, the second question that can be raised here
is that "is there any significant relationship between company ownership
and investment cash flow sensitivity?"
Research methodology
The hardest step in any research process is to identify the problem
being studied. First, there should be an obstacle or an unclear doubt about one
thing, doubt that needs to be determined.In any study, the type, nature,
objectives, and its scope should be determined first so that it would be
possible to achieve reality by using proper rules and tools and finding valid methods.
Accordingly, this study is applied in terms of orientation and is descriptive in
terms of purpose. Applied research is a research the results of which can be
applied to meet needs and solve problems; therefore,the purpose of this type of
research is to apply it in solving specific problems in the community.
Descriptive research includes a set of methods aiming at describing the
conditions or phenomena under investigation. Conducting descriptive research
can help in the better understanding of current situation or the
decision-making process. Because this study used previous information in order
to explore the relationship between variables, it is classified as
causal-comparative research. In a causal-comparative research, data are
collected and analyzed from an environment that existed in a natural way or
from the past events that occurred without the interference of researcher's
system; thus, there is not the possibility of manipulating variables. In this
study, each of the data of the independent variables of the study was obtained
and then the dependent variable was obtained based on thequestionnaires from
thecollected samples.In the next stage, research hypotheses about the
relationship between each of the characteristics of the company's board of
directors and characteristics of the audit committee with the auditors' demands
for non-audit services was assessed using linear regression models.
Research Questions
This study raised the issue in a way that it can be explored
scientifically, and its measurement and testing will be possible, and it has
its scientific value. The points that are considered in this research are as
follows:
1.
Explaining the
main terms
2.
Expressing the
problem
3.
Expressing the
hypotheses
4.
The tools used
in the study
5.
The importance
of the research topic
Accordingly, the main research question is:
Is there any significant relationship between the characteristics
of chief executive officer and company ownership with investment cash flow
sensitivity?
Research hypotheses
Hypothesis is the researcher's solution to address the problem.
That's why developing a proper hypothesis depends on how the problem is
expressed and the roots of a suitable hypothesis are merged with expressing a
problem. Hypothesis is a hypothetical proposition which itsconfirmation or
rejection is tested based on concept consistency using empirical evidence and
knowledge of the past.
The importance of
a given hypothesis is judged in connection with its efficiency in the issue.
However, judgment about developed hypothesis requires the determination of the
criterion or criteria that evaluate features of a hypothesis.
According to the
abovementioned issued the following hypothesis can be raised:
1.
There is a
significant relationship between the characteristics of chief executive officer
and investment cash flow sensitivity.
2.
There is a significant
relationship between company ownership and investment cash flow sensitivity.
Research model
This study explores the sensitivity of changes in external
financing sources of the company in relation to changes in the cash flows under
financial constraints and the economic crisis in listed companies of Tehran
Stock Exchange. Accordingly, research hypotheses about the relationship between
each of the components of internal cash resources with sensitivity to financing
changes will be evaluated using linear regression. In order to test the first
and second hypothesis, the following formula was used (Ben Muhammad, et al.,
2014):
=investment
cash flow sensitivity
= constant value
=
regression coefficient
=company's growth opportunities
=net
cash flows from operating activities to total assets ratio
=management optimism
=ownership concentration
=company size
=company's financial leverage
=error term
Research
variables
The most
important and useful way to classify variables is dividing them into
independent and dependent variables. Because of the general applicability,
simplicity and importance in conceptualizing and planning as well as reporting
the results, this type of classificationis very useful.
Dependent
variable
Investment cash
flow sensitivity (I)
This index is
defined as measuring the rate of change in capital expenditures by companies in
exchange for a unit change in operating cash flow which is calculated as
follows:
Independent
variables
Independent variable is a variable
through which dependent variable can be predicted. This variable is measured,
manipulated or selected by the researcher so that its relationship with or its
effect on other variables can be measured.
Management
optimism
It is a dummy variable. If executive
directors have this condition, they receive number one; otherwise, they receive
zero number. To calculate it, the average net purchases of industrial materials
is calculated and, then, it is compared with the net purchases of the sample
manufacturing companies. If the net purchase of the company is higher than the
average, number 1 is attributed to it (manager is optimistic); if it is less
than the average, number zero is attributed to it (manager is not optimistic).
Ownership
concentration
It refers to share distribution among
shareholders of various companies. As the number of shareholders reduces, ownership
will be more concentrated. In this study, in order to calculate the ratio of
ownership concentration, the Herfindahl-Hirschman index (HHI) was used. This
index is obtained from the sum of squared percentage of shares owned by the
shareholders of the company. This index is increased in parallel with the
increased concentration of ownership, and in situations where the stock is
owned by one person, it allocates most of the value to itself and is calculated
equivalent to 10,000 units. If the ownership structure is dispersed and all
shareholders have equal ratios, HHI find the least valueand is calculated
equivalent to N/10,000. Herfindahl index can be calculated as follows
(Mohammadi, Qalibaf Asl, & Meshki, 2010).
Control variable
Company's growth opportunity (QTobin)
This
proportion is used as a measure of value. The mentioned ratio can be calculated
by dividing the market value of assets into their final replaced cost which can
be calculated as follows:
=the
market value of equity
=book
value of debts
=. book value of assets
Net cash flows from operating activities to total assets ratio (CF)
Company size
Company size is calculated through natural logarithm of total
assets as follows:
Company's
financial leverage
It is obtained
by dividing total debt (TL) into total asset (TA) of the company which formula
is as follows:
To determine
the specific sample in this study, companies that their data was available were
used. The statistical sample was selected from the companies listed in Tehran
Stock Exchange which had all the following conditions:
1.
Companies that
had activities in Tehran Stock Exchange and the data related to them were
available from2010 to 2014.
2.
Companies that
their stock had been traded in the exchange from 2010 to 2014 and their symbolwill
have not been removed from the exchange board by the end of the fiscal year of 2014.
3.
The fiscal year
ended on March of each year.
4.
Companies do
not lose money in these years.
5.
Companies that their
symbol had not a trading delay more than 6 month.
6.
The companies
should not be banks, financial institutions, insurance companies, holding,
investors, andthe like.
7.
The companies
should be manufacturing.
According to
the abovementioned terms, 74 companies listed on the Tehran Stock Exchange,
whose information was disclosed, were selected and their financial statements were
examined. Therefore, according to table (1), 74 companies were selected as
sample.
Table 1.
The number of companies being studied
|
Number
|
Explanation
|
|
317
|
The initial number
|
|
- 58
|
Investment
and holding companies
|
|
- 66
|
The
companies that are not leading up to 29/12
|
|
- 48
|
Companies
that lose money
|
|
- 13
|
Companies
that their data was not available
|
|
- 58
|
Companies
that did not purchase raw materials
|
|
74
|
Companies being studies
|
Data analysis
The first step
in any statistical and data analysis is the calculation of descriptive indices.
Therefore, in order to start data analysis, descriptive statistics of data
including central tendency, dispersion and deviations from symmetry and also Jarque
and Bera test checks for normally distributed residuals were calculated, and
the results are shown in the following table.
Table
2. Introduction and separation of the symbols used for the variables of the
model
|
Row
|
Variable symbol
|
Variable name
|
Variable type
|
|
1
|
I
|
Investment cash flow sensitivity
|
Dependent
|
|
2
|
OPTIMISM
|
Management optimism
|
Independent
|
|
3
|
OWNER
|
Ownership concentration
|
Independent
|
|
4
|
CF
|
The ratio
of net cash flows
|
Control
|
|
5
|
QTobin
|
Company's
growth opportunity
|
Control
|
|
6
|
SIZE
|
Company size
|
Control
|
|
7
|
LEV
|
Company's financial leverage
|
Control
|
Table 3.
Descriptive statistics of variables before normalization
|
LEV
|
SIZE
|
OWNER
|
OPTIMISM
|
CF
|
QTobin
|
I
|
|
|
0/59
|
6/025
|
4080/897
|
0/5
|
0/1354
|
1/841
|
7/2
|
Mean
|
|
0/603
|
5/964
|
3782
|
0/5
|
0/114
|
1/576
|
0/051
|
Median
|
|
1/009
|
7/817
|
9218
|
1
|
0/558
|
15/851
|
2470/07
|
Maximum
|
|
0/048
|
4/441
|
1246
|
0
|
-0/298
|
0/864
|
-
25/618
|
Minimum
|
|
0/16
|
0/533
|
1817/071
|
0/5
|
0/129
|
1/104
|
128/53
|
Standard deviation
|
|
-0/41
|
0/544
|
1/0646
|
0
|
0/496
|
6/484
|
19/094
|
Skewness
|
|
3/159
|
4/144
|
3/812
|
1
|
3/371
|
73/929
|
366/653
|
Elongation
|
|
10/741
|
38/409
|
80/066
|
61/667
|
23/397
|
80151/94
|
2057871
|
Jarque-Bera
|
|
0/005
|
0/000
|
0/000
|
0/000
|
0/000
|
0/000
|
0/000
|
The statistics probability
|
|
370
|
370
|
370
|
370
|
370
|
370
|
370
|
Total data
|
|
74
|
74
|
74
|
74
|
74
|
74
|
74
|
Section
|
Given that the probability of Jarque-Bera statistics for the
dependent variable is less than 5%, H0 hypothesis is rejected
based on the normality of the error term and the dependent variable. To
normalize, Johnson transformation in the MINITAB software was used; the dependent
variable transfer function is provided in the diagram (1).
Diagram 1. Johnson transformation
normality test for the dependent variable I
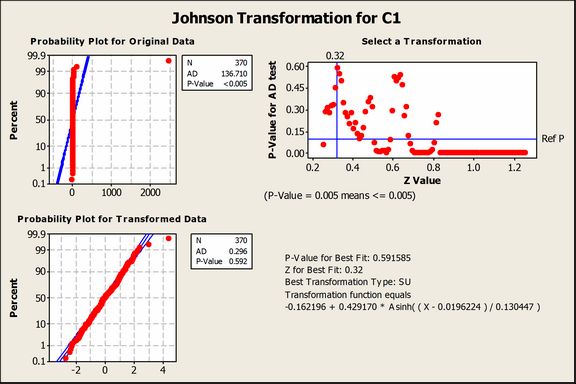
As can be seen in the diagram (1), the dependent variable of the
study was not normal at first. After doing Johnson transformation, the
dependent variable became normal. In an abnormal mode, the probability of Jarque-Bera statistics was not at the significant level of
95% (p-value<0.05 ( , but, after
doing Johnson transformation test, the probability
of this statistics was at the significant level of 95% (p-value<0.05 ( .
The results of carried out tests
In this section of the study, after entering data into the software
and initial estimates of parameters, the presence or absence of a separate y-intercept
for each of the companies should be examined. At first, F-Limer test should be
examined and chosen between fixed or random effects in which H0
hypothesis, the same y-intercept (Pool), is in contrast with H1
hypothesis, inconsistency of y-intercept (Panel).In the Eviews 8 software, after testing the effect of fixed effects, if the
probability of the output statistics of the software is less than 0/05, the
panel method is accepted at the level higher than 95 percent; but if it is
greater than 0/05, the pooled method is accepted.
Chow test or structural changes test related to the hypotheses
(F-Limer)
Table 4. Chow test output
|
Test Summary
|
Statistics
|
Degrees of freedom
|
The statistics probability
|
|
Section F
|
2/561 |
73,290 |
0/000
|
As can be seen, the statistics probability is less than 0/05.
Therefore, regression has a different y-intercept; that is, y-intercepts are
not alike. Thus, model is accepted with the panel data.
Hausman test
H0 = There is no
correlation between individual effects and explanatory variables Random effects model
H1 = There is a
correlation between individual effects and explanatory variables Fixed effects model
Table 5. Results of Hausman
test
|
Test Summary
|
Statistics
|
Degrees of freedom
|
The statistics probability
|
|
Hausman
|
9/617
|
6
|
0/0474
|
As it is evident in the above table,
regarding the significant level which is less than 0/05, H1
hypothesis is accepted and the fixed effects model is selected as the preferred
model for research hypotheses at this stage.
Hypothesis testing
1.
There is a significant relationship between the characteristics of
the chief executive officer and investment cash flow sensitivity.
2.
There is a significant relationship between company ownership and
investment cash flow sensitivity.
Table 6.
The results of estimating the model of the first main hypothesis
|
Statistics
probability
|
t
statistics
|
Standard
deviation
|
coefficient
|
Variable
name
|
|
0/9133
|
0/109
|
0/26
|
0/028
|
C
|
|
0/0029
|
3/0169
|
0/01
|
0/027
|
Q
|
|
0/000
|
7/044
|
0/131
|
0/921
|
CF
|
|
0/0042
|
2/895
|
0/099
|
- 0/288
|
OPTIMISM
|
|
0/0465
|
- 2/002
|
-5/68
|
- 0/001
|
Owner
|
|
0/0027
|
3/029
|
0/241
|
0/730
|
Lev
|
|
0/000
|
-9/029
|
0/04
|
- 0/358
|
AR (1)
|
|
5/308
|
F statistics
|
0/536
|
Adjusted
|
|
2/41
|
Durbin Watson
|
0/000
|
F significant level
|
As can be seen in the above table, considering F
statistics, it can be said that the above regression model is significant. And
the Durbin-Watson statistic is equal to 2,41 after the arrival of the
self-return at the first time and the value of this statistic becomes suitable
and showed no correlation between model components. The adjusted coefficient of
determination of the model indicates that the model variables have the
explanatory power (54 percent) in order to explain the dependent variable.
According to the probability statistics of management optimism (OPTIMISM) that
is less than 0.05, it can be said that there is a significant negative
relationship between the characteristics of the chief executive officer and
investment cash flow sensitivity with a 95% margin of error, and hypothesis H0
is accepted. Moreover, considering the probability statistics of ownership
concentration that is less than 0.05, it can be stated that there is a
significant negative relationship between company ownership and investment cash
flow sensitivity with a 95% margin of error, and hypothesis H0
is accepted.
Summary and conclusion
In this
section, the results of testing the research hypotheses are generally reflected
in the following table.
Table 7. Summary of the general results of the
study
|
Hypothesis
|
Research hypotheses
|
Results
|
|
1
|
There is a
significant relationship between the characteristics of the chief executive
officer and investment cash flow sensitivity
|
Accepted
|
|
2
|
There is a
significant relationship between company ownership and investment cash flow
sensitivity.
|
Accepted
|
Reviewing and
comparing the results with previous research
Testing the
first research hypothesis showed a significant negative relationship between
the characteristics of the chief executive officer and investment cash flow
sensitivity. In addition, testing the second hypothesis indicated a significant
negative relationship between company ownership and investment cash flow sensitivity;
that is, as management optimism and ownership concentration decrease,
investment cash flow sensitivity increase. The findings of the study are
consistent with the findings of Ben Muhammad et al. (2014) who believe that
management bias can explain investment policies in large companies and can
change the cash.
Research limitations
According to
the terms of variables, the possibility of doing research on all companies was
not possible and so this issue tends to reduce the number of the samples, and
generalizing the results to other enterprises should be done with cautious.
Suggestion based on research results
Since managers tend to indulge in the use of internal funds, they
act with greater sensitivity regarding investment decisions and capital expenditures.
For example, it is better to invest more in the purchase of raw and related
production materials. In addition, because ownership concentration or stock
distribution has a significant effect on the investment sensitivity, it is
better that stock be distributed among fewer individuals.
Table 8.
Descriptive statistics of the variables after normalizing
|
LEV
|
SIZE
|
OWNER
|
OPTIMISM
|
CF
|
QTobin
|
I
|
|
|
0/59
|
6/025
|
4080/897
|
0/5
|
0/1354
|
1/841
|
-0/013
|
Mean
|
|
0/603
|
5/964
|
3782
|
0/5
|
0/114
|
1/576
|
-0/061
|
Median
|
|
1/009
|
7/817
|
9218
|
1
|
0/558
|
15/851
|
4/362
|
Maximum
|
|
0/048
|
4/441
|
1246
|
0
|
-0/298
|
0/864
|
-2/726
|
Minimum
|
|
0/16
|
0/533
|
1817/071
|
0/5
|
0/129
|
1/104
|
1
|
Standard deviation
|
|
-0/41
|
0/544
|
1/0646
|
0
|
0/496
|
6/484
|
0/179
|
Skewness
|
|
3/159
|
4/144
|
3/812
|
1
|
3/371
|
73/929
|
3/484
|
Elongation
|
|
10/741
|
38/409
|
80/066
|
61/667
|
23/397
|
80151/94
|
5/598
|
Jarque-Bera
|
|
0/005
|
0/000
|
0/000
|
0/000
|
0/000
|
0/000
|
0/061
|
The statistics probability
|
|
370
|
370
|
370
|
370
|
370
|
370
|
370
|
Total data
|
|
74
|
74
|
74
|
74
|
74
|
74
|
74
|
Section
|
Suggestions for future
The nature of scientific research is continuous and diverse. Perhaps
this sentence that in order to reach results, there are thousands of untested
methods in scientific approach is not far from reality. Therefore, based on
this reality, the following suggestions are presented below:
ü It is suggested that this type of research be conducted in various
industries and then the results be compared in these industries.
ü Regarding the importance of investment sensitivity and its effect
on the operating cash flow, it seems that further studies could reveal new
dimensions of the matter and boost literature in this area. Research on
different aspects of this subject is suggested to future researchers.
ü Using other methods to calculate the variables of the study, such
as the independent variable of management optimism using the interest
prediction rate per share and the independent variable of ownership
concentration using Tower index, is suggested.
ü There are various methods to calculate the index of ownership
concentration, such as total stock of real and legal entities who hold more
than 10% of shares (Tower, 2006), but this study used the Herfindahl-Hirschman
index.
ü To calculate the size variable, the natural logarithm of market
capitalization can be used, but, in this study, with the assumption of
reevaluation in the companies being studied, the natural logarithm of the book
value of assets was used based on Base article.
References
Almeida, H., Campello, M., Weisbach M.S., 2004. The cash flow
sensitivity of cash. Journal of Financial . No 59,1777– 1804
Asgar, A. A. (2014). Exploring the relationship between
investment structure with ownership structure and corporate diversification.
Master's thesis, Azad University of Rasht.
Fazzary, s, hubbard, R,G,& Petersen, B.(1988).Financing
constraints and corporate investment.
Haqiqat, H. & Zargar Fayuji, Y.
(2013). The impact of financial constraints and held cash on the sensitivity
of investment to cash flow. Applied research on financial reporting, 2nd
year, No. 3. Autumn and winter 2014.
Mohammadi, Sh., Ghalibaf Asl, H.,
& Meshki, M. (2010). Exploring the effect of ownership structure
(concentration and composition) on the performance and value of companies
listed on the Tehran Stock Exchange. Financial research, Vol. 11, Issue 28,
pp. 69-88.
Sadidi, M. & Mohammadi, A.
(2014). On the relationship between investment cash flow sensitivity with
the level of investment spending. Experimental Studies Quarterly of
Financial Accounting, eleventh year, spring, No. 41.

