The Dynamics of Stock Market Returns and Mutual Interaction of Stock Indices with Macroeconomic Variables
|
Dr. Parimal Kr. Sen
Associate Professor (WBES)
Goenka College of Commerce and Business Administration
Kolkata – 700012
|
Debojyoti Das
UGC Junior Research Fellow
E-Mail: debojyoti4msxc@gmail.com
|
Atanu Pramanick
UGC-JRF, Department of Commerce,
University of Calcutta
|
Abstract
The present study endeavors to understand the characteristics of Indian stock market using a simple conceivable framework. The first section introduces the theme of the study and the bone of contention. The next section describes the market returns data characteristics of Indian stock market finding of which shows a contradiction of the normality assumption of stock returns under Geometric Brownian Motion. Next segment studies the relationship between stock market returns and some selected macroeconomic variables which are presumed to have significant bearing on stock market. Correlation results exhibited that Consumer’s Price Index is significantly negatively correlated and Exchange Rate is significantly positively correlated.
Keywords: Stock Market Returns, Macroeconomic Variables, Stock Indices, Geometric Brownian Motion, Exchange Rate, Consumer’s Price Index, Normality Assumption.
JEL Classification: E6, G3
Introduction
The prime objective of understanding the dynamics of stock market is to ensure the efficient flow of capital formation process by channelization of funds from household sector for strengthening economic growth. In the recent past scholars in the domain of finance, economics and allied disciplines have attempted to establish a causal relationship between development of stock markets and economic growth. One of the prominent and earlier contributions of Raymond W. Goldsmith (1969) titled ‘Financial Structure and Development’ endeavors to map out the transition of financial system as economies develop. The study presents evidence that non-banking financial intermediaries and stock markets certainly has significant role in economic growth as a country expands gradually. On the other hand, another school of thought presents substantiations on the impact of macroeconomic variables on stock market. Chen et al. (1986) in his empirical work ‘Economic Forces and Stock Market’ modeled stock market returns as a function of a set of macroeconomic variables and non-equity returns. Followed by another study by Mookerjee and Yu (1997) established the causal relationship between stock market returns and a set of four macroeconomic variables (narrow and broad money supply, foreign exchange reserves and exchange rate) in Singapore. The findings were except exchange rate all other macroeconomic variables were found to have significant influence on stock markets. Several other studies Poon and Taylor (1991), Martinez and Rubio (1989) and many other pioneer studies in the concerned field has attempted to explore the relationship by demonstrating on data of varied countries and using different pertinent methodologies. However, the results of various studies were found to be inconsistent to one another and also results are assumed to have influence of methodology applied.
The present article is a micro-level study which slightly differs in terms of approach as compared to the previous studies. The first section is introduction to the bone of contention, followed by section two, which describes the market returns data characteristics of Indian stock market. Section three attempts to gauge relationship between stock market returns and some selected macroeconomic variables which are presumed to have significant bearing on stock market based on previous literature. The last section discusses the findings and future scope of study. In brief, the article is dedicated to understand the stock market dynamics and mutual interactions with macro-level variables through a simple conceivable framework of analysis.
Analysis of the Stock Market History
This section studies the short-term historical performance of Indian stock market (indices of CNX-NIFTY is considered as the proxy) using daily data for a period of 5 years (July 23, 2010 to July 24, 2015), the data for the purpose has been extracted from the website of National Stock Exchange (NSE).
The fig. 1 (refer appendix) represents the intra-day daily data which exhibits an upwardly mobile trend with a positive slope (y=1.779x – 67207). The volume of trade has also been comparatively higher in the years from 2013 to 2015; highest volume traded in last 5 years was on December 19, 2013. Thus there has been considerable ascendant movement in the stock indices over the period of study.
Decrypting Market Returns
In the theory of finance, it is assumed that stock prices are unpredictable and follows a type of stochastic process known as Geometric Brownian Motion (GBM). This model assumes certain properties. However, this study tends to check upon only one of its prime properties in Indian context, that is:
-The proportional return for a stock over a very short period of time is normally distributed
 … [Eq. 1]
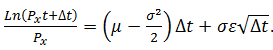
Theoretically, the proportional return can be expressed as:
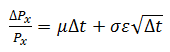 … [Eq. 2]
In eq. 2 ∆Px is the change in the stock’s initial price Px over a short period of time i.e. our period of study 5 years. The first factor (μ) is the drift rate per unit of time (∆t) , which is certain. The second component (ε) is a random draw from a standard normal distribution. The second part adds up the uncertainty factor. When the constituents are summed up, the proportional return of the stock over a short interval of time becomes a variable that is normally distributed with mean of (μ∆t) and standard deviation of (σ√∆t), the mathematical expression is as below:
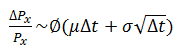 … [Eq. 3]
Where, (∅) is the measure of association between the two binary variables.
Thus based on the theoretical backdrop presented above, it is intended to test for normality of stock returns. For the purpose the study proposes the following hypothesis:
H0: Stock Returns are Normally Distributed. Against H1
For check of normality we use Kolmogorov-Smirnov and Shapiro-Wilk test. Table 1 (refer appendix) exhibits the descriptive statistics of daily returns. The value of test statistic of skewness is -0.034 and standard error is 0.069 and for skewness it is 0.889 and .139 respectively. The z-value of skewness and kurtosis under the assumption of normality should fall within the following range:
 … [Eq. 4]
The z-value of skewness is -0.48703 which falls within the range, it means even though it is slightly skewed but good enough under the normality assumption. However the z-value of kurtosis is 6.42 (approx.) which is way beyond the upper limit is. Fig. 2 (refer appendix) shows the distribution, on visual inspection it appears to be normally distributed, however it is slightly peaked distribution than a normal distribution and hence can be assumed to be leptokurtic.
Table 2 (refer appendix) shows the results of the normality check and it is found that [p-value<0.05] in both the cases of Kolmogorov-Smirnov and Shapiro-Wilk test. Hence, the null hypothesis (H0) is rejected (Shapiro and Wilk, 1965). Thus it can be concluded that the returns are not normally distributed in contradiction to the theoretical proposition.
Volatility Check of Returns
Volatility can be defined as the standard deviation of the distribution of its continuously compounded return over a specific time horizon. It is a measure of uncertainty of stock returns. In this study historical volatility of stock is calculated from its daily prices for a period of 5 years. The volatility is computed using the following formula:
 … [Eq. 5]
It is assumed that there are 250 trading days in a year. The average volatility for the period of study was found to be around 16.10% with a standard deviation of 4.64%. The period from September 5, 2013 to September 25, 2013 was detected to be most volatile over the period of study. Fig. 3 (refer appendix) depicts the movement of price and volatility.
Impact of Macroeconomic Variables on Stock Indices
This segment of the study is focuses on the relationship between stock market (CNX-NIFTY indices assumed as the proxy), inflation (Consumer’s Price Index [CPI] considered as the proxy), gold rates (INR per 10 grams, Mumbai) and exchange rates (taking INR-US$ rates as proxy). The previous literatures have considered many other variables for their study many of them subsequently were also found significant. This study has a limited scope and thus only three independent variables i.e. inflation, gold and exchange rates are taken care of.
The analysis has been done on monthly data for a period of 5 years i.e. from 2010-15. The data is gathered from the Handbook of Indian Statistics, published by Reserve Bank of India (RBI).
The econometric analysis is performed using two very basic statistical measures Pearson correlation and linear regression, the following is the model specification:
 … [Eq. 6]
Table 3 (refer appendix) shows the correlation coefficients which depicts that CPI (proxy for inflation) is significantly negatively correlated and exchange rate is significantly positively correlated, whereas gold rates do not witness a statistically significant correlation.
The table 4 (refer appendix) exhibits the model summary of linear regression and shows that the adjusted R2 is 0.716 which means that 71.6% of variability in the dependent variable is explained by the model and the remaining 28.4% remains unexplained.
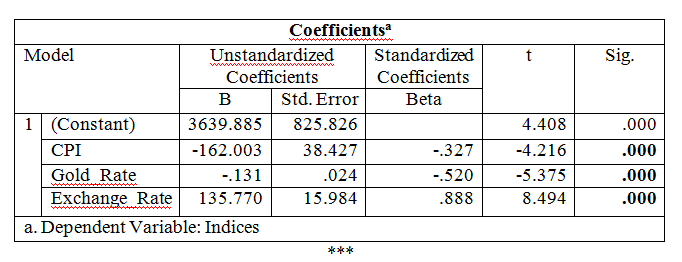
Table 5 (refer appendix) the ANOVA table shows the p-value<0.05, which shows the model has an explanatory power at 5% level of significance. In the table 6 (refer appendix) of coefficients the beta value of CPI and gold rate were found to be negative i.e. (-162.003) and (-.131) respectively. However, the beta value of exchange rate is positive (135.770). The all independent variables detected to be statistically significant (p-value<0.05). Hence it can be inferred that the selected macroeconomic variables has a significant impact on the dependent variable.
Summary of Findings and Future Implications
The purpose of the study was to understand the dynamics of stock market returns and mutual interactions with the selected macroeconomic variables. The finding of the study contradicts the normality assumption of GBM. The annualized volatility of returns over the period of study was approximately 16.10% with a standard deviation of 4.64%. For the check of impact of macroeconomic variables on stock indices correlation and linear regression analysis were performed. Correlation results exhibited that CPI is significantly negatively correlated and exchange rate is significantly positively correlated. The regression analysis shows that the model has an explanatory power with all independent variables statistically significant and an adjusted R2 of 71.6%.
The study has a limited scope of 5 years on account of which the results cannot be reliably generalized. For the purpose of future studies the other assumptions of GBM such as log-normality property of stock prices can also be tested. A more pertinent measure of volatility can be achieved by applying more sophisticated econometric techniques, which might result in more accurate volatility coefficients. Further the study considers only three independent variables which can be further increased over an extended time horizon. The article endeavors to understand and analyze the dynamics and mutual interactions with macroeconomic variables and it does justice to the pre-formed objectives.
References
Chen, N. F., Roll, R., & Ross, S. A. (1986). Economic forces and the stock market. Journal of business, 383-403.
Greenwood, J., & Smith, B. D. (1997).Financial markets in development, and the development of financial markets. Journal of Economic Dynamics and Control, 21(1), 145-181.
Martinez, M. A., & Rubio, G. (1989). Arbitrage pricing with macroeconomic variables: an empirical investigation using Spanish data. Working Chapter, Universidad del Pais Vasco.
Mookerjee, R., & Yu, Q. (1997).Macroeconomic variables and stock prices in a small open economy: The case of Singapore. Pacific-Basin Finance Journal, 5(3), 377-388.
Poon, S., & Taylor, S. J. (1991). Macroeconomic factors and the UK stock market.Journal of Business Finance & Accounting, 18(5) , 619-636.
Shapiro, S. S., & Wilk, M. B. (1965).An analysis of variance test for normality (complete samples). Biometrika, 591-611.
Appendix
Figure 1. CNX-NIFTY Daily Data
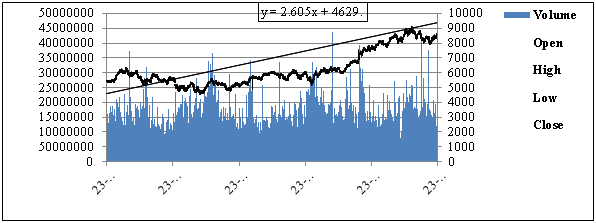
Figure 2. Daily Returns
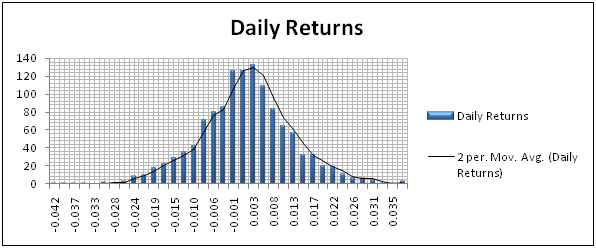
Figure 3. Price and Volatility
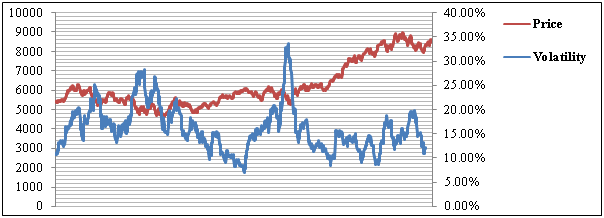
Table 1
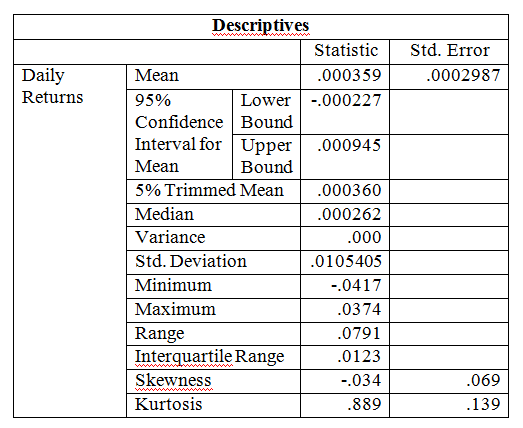
Table 2
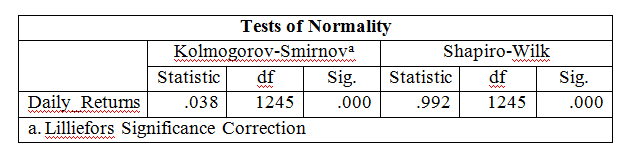
Table 3
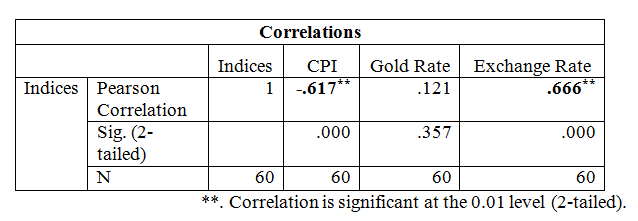
Table 4
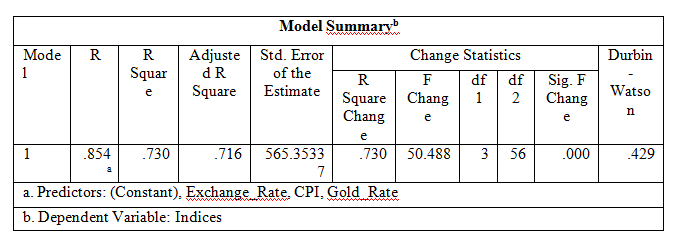
Table 5
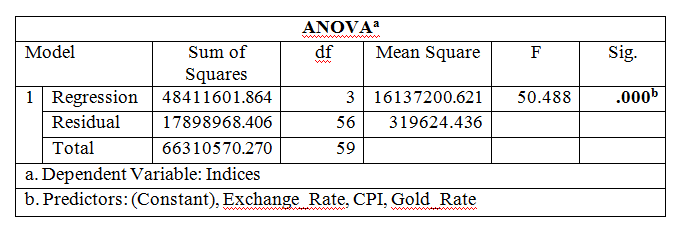
Table 6