A Refereed Monthly International Journal of Management
To
The Joint Editor,
Pacific Business Review International,
Pacific Hill, Airport Road,
Udaipur – 313001
Sub: Publication of Research article in journal “Pacific Business Review International”
Dear Sir/Madam,
I am enclosing herewith as an attachment of the article titled “Comparative Study on Dynamics Of CBOE VIX® And India VIX ” with request for its publication in the ensuing issue of Pacific Business Review International. I assure you that this article has
neither been published in any other journal and nor is its consideration for publication elsewhere.
A line of confirmation as above will highly be appreciated.
Thanking you and looking forward to here from your good office.
With regards,
Yours Sincerely,
Priyanka Sharma
Ex-Consultant, PWC
E-Mail: priyanka.academics@gmail.com
Contact: +91 8444833213/7654614984
Mailing Address:
H/o Kashinath Gupta,
C/o Gopal Prasad Sharma
Bakerganj Bajaja, Nataraj Gali, Bakipore,
Patna-800004, Bihar, India.
Comparative Study on Dynamics of CBOE VIX® and India VIX
Abstract
The present study endeavors to compare the dynamics of CBOE and India VIX using a simple plausible framework. The study by way of showing graphical
analysis for visual inspection, comparison of descriptive statistics and check of normality assumptions shows that the volatility indices of both CBOE
and NIFTY shows similar features. It is more sensitive towards the negative shock in stock prices as compared to positive jolts. The instances of
asymmetry between stock index and VIX as reflected by the previous studies also found to be present over the period of study.
Keywords:
Stock Markets, Volatility Index, Efficient Market Hypothesis (EMH)
Introduction
In the recent times, burgeoning scholarly work on analysis of stock market volatility in the domain of finance and economics literature is fairly evident.
It has been one of the extensively researched areas by both academicians and practitioners across the globe for its impending implications on the financial
system of an economy. To understand the probable volatility sentience in the stock markets an indicative measure/standard was ought to be set which is
known as the Volatility Index (VIX).
The Chicago Board of Exchange (CBOE) introduced CBOE VIX® in the year 1993, which was intended to act as an assessment measure of expectation of
the market of a short-term (30 days) volatility implied by at-the-money Standard & Poor’s (S&P) 100® Index (OEX® Index)
option prices. In 2003, CBOE in association with Goldman Sachs upgraded the VIX to come up with a new measure of expected volatility, that is broadly used
by financial theorists, risk managers and volatility traders in a similar way. The modified VIX is based on the S&P 500® Index (SPXSM), the
core index for U.S. equities, and the expected volatility is estimated by averaging the weighed price of SPX puts and calls over a wide range of strike
prices. This measure of volatility (VIX®) has been referred as the fear estimate of investors, because of the very fact that high level of VIX
corresponded to higher scale of market instability (Whaley, 2000).
In the context of India, India VIX (IVIX) is used which is computed by National Stock Exchange (NSE) based on the order book of NIFTY options. For the
purpose the best bid-ask quotes of near and next-month NIFTY option contracts which are traded on the Futures and Options (F&O) segment of NSE is used.
Traditionally one of the underlying reasons of volatility as put forth by noted academicians is arrival of a new piece of information in the market which
takes us back to the axioms of Efficient Market Hypothesis (EMH). Fama (1970) discernibly ratified EMH. Fama (1970) states that market in which the stock
prices always “fully reflect” available information is called “efficient”. In such a form of market, when a new piece of information enter, the asset
prices accurately respond to that information and integrate all information at any point of time and reach a new level of equilibrium. The theory of
rational expectation is grounded upon the rational expectation theory. This theory assumes that investors attain at a rational expectation estimate about
future security return. According to Fama (1970), expected returns represent the conditions of market equilibrium and such ‘expected returns equilibrium is
function of its risk’. Following Fama (1970) has represented return on asset as:
SRt = ψt-1 (ymt) + πt
(1.1)
Where, SRt is stock returns, ψt-1 (ymt) represents equilibrium return expected att-1 period, πt is the abnormal component. To attain at the equilibrium level market captures information. Assume It-1 to represent information set. Then the equation stands:
ψt-1 (ymt) = ψ(ymtǀI t-1)
(1.2)
The equation (1.2) implies that the stock market would stand efficient when it uses all relevant information accurately and timely in determining the
market price.
The prominent works of other researchers negate the fact that the prime cause of volatility is new information arrival (French and Roll, 1986). The
subsequent studies have introduced various other causal factors such as investor behavior, financial performance of organizations, dynamics of
macroeconomic variables and dissemination of other public information [refer Ross (1989), Andersen et al. (2006), Sen, Das and Goyal (2015)].
The previous literature also provides evidences on a significant negative correlation between stock returns and VIX with due cogency. Further the traces of
asymmetric relationship between stock returns and implied volatility (i.e. higher magnitude of implied volatility on negative return shocks as compared to
the positive return jolt) is also laid down (Shaikh and Padhi, 2014, Chandra and Thenmozhi, 2015). The present study endeavors to examine this phenomenon
of asymmetric relationship and compare descriptive statistics of IVIX with the CBOE VIX® as benchmark to appraise the performance of IVIX as a
measure of market volatility.
The next segment of the study briefly revisits the intellectual efforts of previous researchers, followed by the comparison of statistical properties of
CBOE and IVIX and finally the results are discussed in the end segment.
Brief Overview of Previous Literature
In the vast literature of financial economics and allied domains considerable empirical works are reported, a snapshot of which presented as below:
Whaley (2009) in his study says that volatility index is affected by increased demand to buy index, and hence, change in volatility index rises at a higher
absolute rate in a situation where stock market falls than when it tends to rise. The empirical findings of the study support the view that the volatility
index is to be assumed as investor’s fear index rather greed index. Followed by evidences on large negative contemporaneous correlation between volatility
index and market return index Dash and Moran (2005) in their study finds a negative correlation between volatility index (VXO) and hedge fund returns,
further this correlation was found asymmetric in nature. On the other hand Guo and whitelaw (2006) confirms that market returns are positively related to
volatility index. In the literature base there exists some contradiction to the literature as well. Dowling and Muthuswamy (2005) in their study on
Australian markets found no asymmetry between volatility and market index returns. Recent studies in Indian context, Kumar (2010) observed negative
relationship between market returns and volatility only during market declines, Shaikh and Padhi (2014) concludes asymmetry prevails among IVIX and the
NIFTY index; at the same time the magnitude of asymmetry is not identical. The result show that the change in IVIX occurs bigger for the negative return
shocks than that of positive return shocks. Chandra and Thenmozhi (2015) examines the asymmetric relationship between IVIX and stock market returns and
demonstrates that NIFTY returns are negatively related to changes in IVIX levels, but in the case of high upward movements in the market, the returns on
the two indices tend to move independently.
Examining the Statistical Properties
Graphical Analysis
This section of the study deals with the statistical property check for both IVIX and CBOE VIX for the purpose of inter-comparison. The study is conducted
for a period of 6 years i.e. from 28/08/2009 to 25/08/2015 for India and for U.S. the study period is 31/07/2009 to 31/07/2015. The Indian data is obtained
from the NSE website and the U.S. data is extracted from the CBOE website. It is intended to study the behavior of VIX and market index returns for both
NIFTY and SPXSM.
Figure 1. Inter-temporal Relationship between India VIX and NIFTY Index
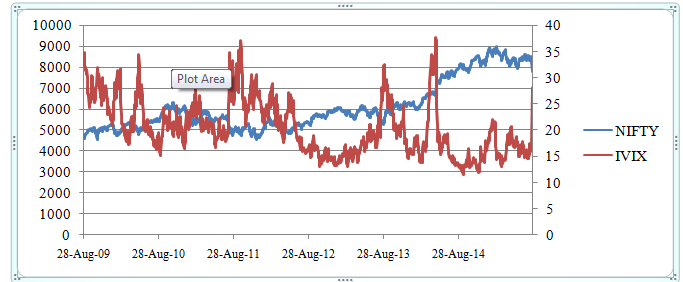
The figure 1 above is the time-series plot of IVIX and NIFTY index for the period of study. The figure by a simple visual inspection reveals that IVIX is
more sensitive to decline in index as compared to the rise. Hence, the connotation of fear index as proposed by Whaley found to be evident in this case.
Figure 2. Inter-temporal Relationship between CBOE VIX® and SPXSM Index
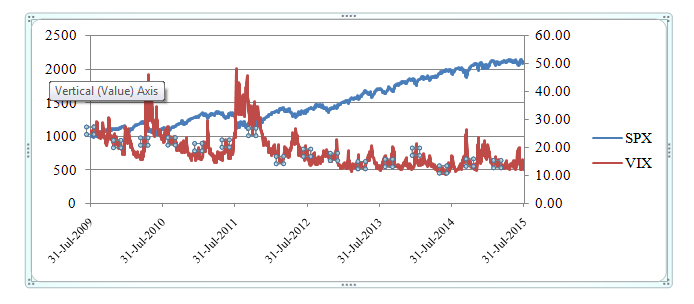
The figure 2 reflects the similar phenomena as reflected by figure 1. Thus it can be seen that asymmetry prevails in both the cases. A simple graphical
analysis confirms that volatility index is hyper-sensitive to negative return shocks to positive return trends, which is consistent to the previous
literature.
Descriptive Statistics and Test of Normality
Table 1. Descriptive Statistics of NIFTY, IVIX and Market Index Return
|
NIFTY
|
|
IVIX
|
|
Market Index Return
|
|
|
|
|
|
|
|
|
|
Mean
|
6110.674262
|
Mean
|
20.3631057
|
Mean
|
0.000343
|
|
Standard Error
|
30.66501872
|
Standard Error
|
0.133727701
|
Standard Error
|
0.000278
|
|
Median
|
5724.225
|
Median
|
19.38875
|
Median
|
0.00046
|
|
Mode
|
5274.85
|
Mode
|
16.82
|
Mode
|
#N/A
|
|
Standard Deviation
|
1183.685611
|
Standard Deviation
|
5.161958539
|
Standard Deviation
|
0.010734
|
|
Sample Variance
|
1401111.626
|
Sample Variance
|
26.64581596
|
Sample Variance
|
0.000115
|
|
Kurtosis
|
-0.213121967
|
Kurtosis
|
-0.167031402
|
Kurtosis
|
1.407901
|
|
Skewness
|
1.052187874
|
Skewness
|
0.70100997
|
Skewness
|
-0.15996
|
|
Range
|
4452.05
|
Range
|
26.14
|
Range
|
0.098352
|
|
Minimum
|
4544.2
|
Minimum
|
11.565
|
Minimum
|
-0.06097
|
|
Maximum
|
8996.25
|
Maximum
|
37.705
|
Maximum
|
0.03738
|
|
Sum
|
9104904.65
|
Sum
|
30341.0275
|
Sum
|
0.509995
|
|
Count
|
1490
|
Count
|
1490
|
Count
|
1489
|
|
Confidence Level(95.0%)
|
60.15122528
|
Confidence Level(95.0%)
|
0.262314696
|
Confidence Level(95.0%)
|
0.000546
|
The above output in table 1 show the average volatility is approximately 20% with a standard deviation of 5.16% (approx.). The modal value i.e. most
occurring volatility rate is 16.82%. The minimum and maximum volatility stood to be 11.565% and 37.705% respectively.
The table 2 below shows the descriptive statistics for the U.S. data which shows the mean volatility is around 18.68% with a standard deviation of 6.09%.
The value of mode is approximately 12.66%. However the minimum and the maximum values varies significantly, it is 10.32 and 48 respectively.
Table 2. Descriptive Statistics of SPX, VIX and Market Index Return
|
SPX
|
|
VIX
|
|
Market Index Return
|
|
|
|
|
|
|
|
|
|
Mean
|
1494.41751
|
Mean
|
18.6847651
|
Mean
|
-0.00032
|
|
Standard Error
|
8.792871372
|
Standard Error
|
0.15785699
|
Standard Error
|
0.001847
|
|
Median
|
1391.01
|
Median
|
17.07
|
Median
|
-0.006
|
|
Mode
|
1178.1
|
Mode
|
12.66
|
Mode
|
0
|
|
Standard Deviation
|
339.4093908
|
Standard Deviation
|
6.0933616
|
Standard Deviation
|
0.071268
|
|
Sample Variance
|
115198.7346
|
Sample Variance
|
37.12905559
|
Sample Variance
|
0.005079
|
|
Kurtosis
|
-1.156798979
|
Kurtosis
|
2.494984524
|
Kurtosis
|
3.275791
|
|
Skewness
|
0.442926915
|
Skewness
|
1.506471998
|
Skewness
|
0.711877
|
|
Range
|
1151.09
|
Range
|
37.68
|
Range
|
0.756054
|
|
Minimum
|
979.73
|
Minimum
|
10.32
|
Minimum
|
-0.35059
|
|
Maximum
|
2130.82
|
Maximum
|
48
|
Maximum
|
0.405465
|
|
Sum
|
2226682.09
|
Sum
|
27840.3
|
Sum
|
-0.47682
|
|
Count
|
1490
|
Count
|
1490
|
Count
|
1489
|
|
Confidence Level(95.0%)
|
17.24773077
|
Confidence Level(95.0%)
|
0.309645706
|
Confidence Level(95.0%)
|
0.003623
0.003623
|
Table 3. Tests of Normality for NIFTY, IVIX and Market Index Returnpacing.
|
|
|
|
|
Shapiro-Wilk
|
|
Statistic
|
df
|
Sig.
|
|
NIFTY
|
.838
|
1489
|
.000
|
|
IVIX
|
.951
|
1489
|
.000
|
|
Market_Index_Return
|
.988
|
1489
|
.000
|
|
a. Lilliefors Significance Correction
|
|
|
|
|
|
|
|
The Shapiro-Wilk test shows the p-values<0.05 and hence all the three variables are found to be failing the normality tests.
The histogram in figure 3 for NIFTY appears symmetric with two modes, the IVIX as depicted above shows a right-skewed distribution. The histogram for
market index return appears normal but since it failed the normality check can be assumed to be a leptokurtic distribution.
Table 4. Tests of Normality for NIFTY, IVIX and Market Index Return
|
|
|
|
|
Shapiro-Wilk
|
|
Statistic
|
df
|
Sig.
|
|
SPX
|
.913
|
1510
|
.000
|
|
VIX
|
.867
|
1510
|
.000
|
|
Market_Index_Return
|
.954
|
1510
|
.000
|
|
a. Lilliefors Significance Correction
|
|
|
|
|
|
|
|
The test for the U.S. data also fails the normality assumption. Further the histograms below show the similar depictions as above for the Indian data.
Figure 4. Histogram of SPX, VIX and Market Index Return
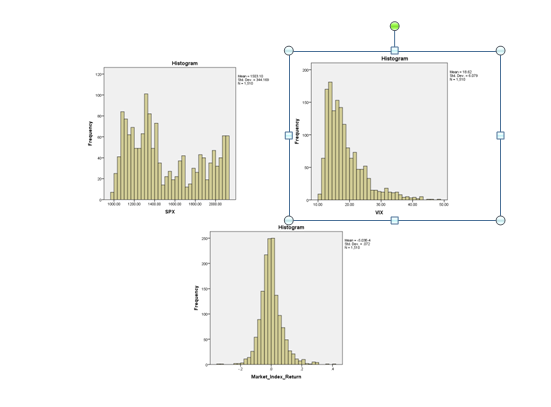
Figure 4 the histogram for SPX, VIX and Market index returns depicts almost similar result as for the Indian data.
Findings and Conclusion
The study intended to compare the dynamics of IVIX and VIX. The study adopted a very simple plausible framework of comparison i.e. visual interpretation of
financial time-series plotting and comparison of descriptive statistics and normality check. The outcome of the study provides the evidence that the
dynamics of volatility indices and other variables considered for the purpose of this micro-level study found to be quite similar. The time-series plot for
both set data confirmed the findings of the previous studies that volatility indices are more sensitive for negative shocks. However the magnitude of
upward or downward movement is a matter of further research using econometric tools. The normality tests were found to be somewhat replica to each other.
Due to time constraints only 6 years could be taken as a sample which is a very small period of study indeed to generalize the findings. Hence, with
increased time-horizon and using more sophisticated econometric techniques the results can be made far convincing.
References
-
Bagchi, D. (2012).
Cross-sectional analysis of emerging market volatility index (India VIX) with portfolio returns. International Journal of Emerging Markets, 7(4), 383-396.
-
Chandra, A., & Thenmozhi, M. (2014).
On asymmetric relationship of India volatility index (India VIX) with stock market return and risk management. Decision, 42(1), 33-55.
-
Dowling, S., & Muthuswamy, J. (2005).
The implied volatility of Australian index options. Available at SSRN 500165.
-
Dumas, B., Fleming, J., & Whaley, R. E. (1998).
Implied volatility functions: Empirical tests. The Journal of Finance, 53(6), 2059-2106.
-
Fleming, J., Ostdiek, B., & Whaley, R. E. (1995).
Predicting stock market volatility: a new measure. Journal of Futures Markets, 15(3), 265-302.
-
French, K. R., & Roll, R. (1986).
Stock return variances: The arrival of information and the reaction of traders. Journal of financial economics, 17(1), 5-26.
-
Kumar, S. S. S. (2010).
The Behaviour of India's Volatility Index. ii Editorial Viewpoint 1 Building Institutions: Lessons of Experience Samuel Paul 6 Institution Building, 2(2), 27.
-
Sarwar, G. (2012).
Intertemporal relations between the market volatility index and stock index returns. Applied Financial Economics, 22(11), 899-909.
-
Shaikh, I., & Padhi, P. (2014).
Inter-temporal relationship between India VIX and Nifty equity index. Decision, 41(4), 439-448.
-
Skiadopoulos, G. (2004).
The Greek implied volatility index: construction and properties. Applied Financial Economics, 14(16), 1187-1196.
- Whaley, R. E. (2000). The investor fear gauge. The Journal of Portfolio
Management, 26(3), 12-17.
- Whaley, R. E. (2008). Understanding VIX. Available at SSRN 1296743.

