A Refereed Monthly International Journal of Management
IMPACT OF MULTI FIBRE AGREEMENT (MFA) PHASE OUT ON INDIAN TEXTILE EXPORTS
|
Greeshma Manoj
Assistant Professor
Dept of Economics
Christ University, Bangalore, Karnataka, India- 560029
Contact No.- +91 7259529756
Email: greeshma.manoj@christuniversity.in
|
S.Muraleedharan
Associate Professor (Retd)
Dept of Economics
Maharajas College, Cochin, Kerala, India.
|
Abstract
The Multi Fibre Agreement (MFA) and the system of bilateral quotas that had governed
the global trade in textiles and apparel for the past forty years came to an end
and were replaced by the Agreement on Textiles and Clothing (ATC) on Jan 1, 2005.
The dismantling of quota restrictions had brought about a significant change in
the structure of worldwide trade in textiles as there are no quota barriers for
the export of textiles and apparels and the hitherto protected textile industry
would be exposed to international competition. The withdrawal of the MFA had brought
back the comparative advantages of developing economies to large labour surplus
economies such as China and India. Since India has a natural comparative advantage
in cotton and cotton-based fibres, abolition of the MFA had an implicit potential
to benefit India's cotton industry as well as cotton based textiles and clothing
sectors. Compared to the competitors India enjoys certain advantage in the production
of textiles and clothing. At the same time, Indian textile industry is also facing
many challenges in the domestic and export front in the changed scenario. In the
given context, the present study attempts to analyse the export performance of Indian
textiles in the post quota era. Export performance has been analysed in terms of
change in the composition and destination of Indian textile exports in the post
MFA period. The period of study is from 1990-2012. In order to examine the impact
of quota removal (MFA), the study period have been sub-divided into Pre-MFA (1990-2004)
and post MFA (2005-2012) The study is based on secondary data drawn from Ministry
of Textiles, RBI and WTO. The study found that Compound Annual Growth Rate (CAGR)
of Indian textile exports were low during the post MFA period compared to pre MFA.
If we compare the average export value during the study period, it can be seen that
the mean value of textile exports are higher during the post MFA compared to pre
MFA period. Among the different sub sectors highest mean value was recorded in readymade
garments followed by cotton textiles and manmade textiles during the post MFA period.
Analysis of percentage share of different subsectors during the study period show
that readymade garments still constitute the largest share in terms of overall textile
exports followed by cotton textiles and manmade textiles. As far as the destination
of exports are concerned, USA could maintain its position as the largest destination
for Indian textile exports in the segment of textiles, readymade garments, coir
and carpets even during the post MFA period. Emergence of UAE as the single largest
destination for cotton textile exports in the post MFA period is noteworthy. It
can also be seen the emergence of new trading partners like Turkey (jute textiles
and manmade textiles), Egypt (cotton textiles) and UAE (cotton textiles and readymade
garments) in the post MFA period.
Key Words: MFA, textiles, quota restrictions, exports and compound annual
growth rate.
INTRODUCTION
India’s textiles sector holds a significant role in Indian economy as it is one
among the earliest established industries and the growth and development of this
sector has a direct bearing on the economic development of India. It is one of the
prominent sectors of Indian economy in terms of its contribution to output, employment
and foreign exchange earnings. It is the second largest employment provider, after
agricultural sector. Currently, it contributes about 14 percent to industrial production,
4 percent to the GDP, and 17 percent to the country’s export earnings. The structure
of Indian textile industry is unique and complex. Indian textile industry is characterised
by the predominance of organised sector which contributes to around 97 percent of
total cloth production and the share of unorganised sector is only 3 percent (Annual
Report 2014-15, Ministry of Textiles).
Textiles and clothing is a very important sector of international trade that has
served as the engine of growth, particularly for developing and least developed
countries. India is the second largest producer of textiles and garments in the
world next to China. The Indian textile industry has significant presence in the
world textile economy by virtue of its contribution to world textile capacity and
production of textile fibres/yarns. The Indian textile industry accounts for about
24 percent of world’s spindle capacity and eight percent of global rotor capacity.
At the global level, India’s textile exports account for just 4.72 percent of global
textile and clothing exports. The export basket includes a wide range of items including
cotton yarn and fabrics, man-made yarn and fabrics, wool and silk fabrics, made-ups
and a variety of garments. The Indian textile industry is currently estimated around
US $ 108 billion (CCI Report, 2015).
The international trade in textiles and clothing were governed by various trade
restrictions. Multi Fibre Agreement (MFA) was an important quantitative trade restriction
imposed by the developed countries to restrict the textile exports from developing
countries. The Multi Fibre Arrangement grew out of a series of s voluntary export
restraints imposed by the United States and Europe on large Asian textile and clothing
exporters (Spinanger, 1999). The first of such agreement was in the form of a Short
Term Arrangement Regarding International Trade in Cotton Textiles (STA) in 1961under
the General Agreement on Tariffs and Trade (GATT) followed by Long Term Agreement
Regarding International Trade in Cotton Textiles (LTA) in February 1962 which was
negotiated among 22 major trading nations to allow importing nations to use quotas
to avoid market disruption [1]. The multi fibre arrangement was later negotiated
in 1974 to broaden the scope of regulation as well as to provide a framework of
rules and procedures under which countries can impose import restrictions. The MFA
was a general, multilateral framework for managing textile and clothing trade for
cotton, wool and manmade fibres. MFA quotas were applied on a discriminatory basis
to some exporting countries but not to others, thus differing from country to country
in both product coverage and the degree of restrictiveness. It is designed to restrict
low-cost exports of clothing and textiles to developed-country markets. At the same
time, MFA was not applicable to trade between the rich developed countries and to
exports from the Least Developed Countries. The MFA resulted in restricting the
size of the textile industry in the exporting countries with natural competitive
advantage in the area, as no country could export more than the quota allocated
to it. In 1995, MFA was integrated into GATT via the Agreement on Textiles and Clothing
(ATC).
ATC was a transitory regime between the MFA and the integration of trading in textiles
and clothing in the multilateral trading system. The ATC envisaged the dismantling
of the Multi Fibre Agreement over 10 year period (1995-2004). The ATC provided for
(a) progressive elimination of quotas in selected products in four stages during
the transitional period ending in 2005 (b) increase in quota growth rates on remaining
products at subsequent stages.
Table 1: Schedule of Quota Integration under ATC
|
Stage
|
Date
|
Percentage of product to be brought under removal of quotas
|
|
I
|
1 Jan, 1995
|
16
|
|
II
|
1 Jan, 1998
|
17
|
|
III
|
1 Jan, 2002
|
18
|
|
IV
|
1 Jan, 2005
|
49
|
Source: WTO
With the termination of the Agreement on Textiles and Clothing (ATC) at the end
of December 2004, all textiles and clothing products were fully subject to multilateral
disciplines under the rules of the World Trade Organization (WTO). The elimination
of MFA quotas under ATC was expected to create a new environment for world trade
in textiles and apparel by vastly increasing the scope for developing countries
to expand their exports and thereby creating employment in this sector. Although
ATC has removed the quota restrictions on textile trade there was no consensus among
the policy makers with regard to the impact of quota removal on developing countries.
Within the developing countries there are quite large differences in competitiveness.
One of the major perceptions about the removal of quotas was that after the removal
India would become a major beneficiary because of the advantage of large manufacturing
base and a large supply of relatively low cost skilled workers. The scrapping of
MFA has raised many discussions about the new international trade climate. The elimination
of quotas was regarded as an opportunity as well as a threat for the competing countries.
Opportunity in the sense that the market is no longer restricted by quotas and threat
because competition became severe after the quota removal. India had great hopes
of achieving a rapid growth in textiles and clothing exports as quotas disappeared.
The general perception was that countries that take the opportunity to streamline
their policies, and improve their competitiveness would gain from the quota abolition.
REVIEW OF LITERATURE
There are a plethora of studies which have tried to analyse the impact of removal
of quota restrictions on the trading partners. However, they disagree on the impact
of quota elimination on developing countries. Most of the review studies done by
international organizations such as the WTO, the World Bank, the Asian Development
Bank and the United Nations, concluded that there would be enormous gains for both
developed and developing countries such as India after the removal of quota restrictions.
But there are some studies such as Spinanger (1998) and Martin and Winters (1996)
which hold much more cautious views, particularly with regard to developing countries,
on this scenario after 2005. Their assertion is that developing countries would
experience negative results after the elimination of textile quota restrictions.
Here the cited reviews are the ones which have analyzed the implications with reference
to Indian context.
Mehta. R (1997) found that the removal of MFA has provided opportunities and challenges
to India's exports of textile and clothing sector. The results show that the removal
of MFA has been advantageous to India's exports. India's export of textile and apparel
has significantly improved in the post-MFA regime. This increase has been due to
(i) increased import demand, and (ii) trade diversion of 'other countries' in destination
(developed) countries. Further, the increase has not been restricted to a few commodities,
but almost all commodities.
(Chadha and Pohit, 1999) analysed the potential gains from abolition of MFA for
developing countries, particularly India by using a 23 sector multi country Computable
General Equilibrium (CGE) NCAER-UM model of World Trade, Production and Employment.
Maximum welfare increase is observed in South Asia other than India. The analysis
also showed ASN region as the major gainer, in percentage terms, in the output of
textiles (14.5 percent) followed by NIE (8.5 percent), RSA (7.5 percent) and IND
(5 percent). India turns out to be a major proportional gainer in exports of both
textiles as well as clothing sectors (26 percent and 42 percent) followed by ASN
(19.5 percent), RSA (17 percent) and NIE (8 percent).
Nanda and Raikhy (2000) observes that in order to improve the market share in the
post MFA regime there is an urgent need to diversify into a high range and classic
garments, technology up gradation through imports importation, if necessary; up
gradation of labour skill, extension of off-shore production facilities to selected
clothing, in special areas like Andaman Nicobar etc.
Vijaya Ramachandran (2001) in her study identified the weak links in the production
chain, key obstacles to productivity and to exports, and policy changes that must
be made for the growth of production and exports in the textiles and garments sector
in the post MFA regime. The study identified three key weaknesses in the production
chain -the inability of Indian producers to supply an adequate amount of cloth,
particularly manmade; the lack of availability of textile machinery; and the lack
of downstream capacity in weaving and processing.
Kathuria, Martin and Bharadwaj (2001) evaluate the possible implications of MFA
removal on exports of garments and textiles focusing on India and the study showed
the discriminatory character of MFA. While the abolition of quotas on international
trade in textiles in 2005 will create opportunities in 2005 will create opportunities
for developing countries, it will also expose them to additional competition from
other formerly restrained exporters. The outcome for any country will depend on
its policy response. Countries that take the opportunity to streamline their policies
and improve their competitiveness are likely to gain from quota abolition.
Verma (2002) analyzed the competitive performance of Indian exports in US and EU
markets. It was found that except made ups, Indian textile export to the US had
no future. The market share of other products was declining. In case of EU, India’s
performance was good in synthetic products (yarn and made-ups) in textiles. Among
garments; suits, coats, jackets and skirts were leaders. The products whose exports
to EU had been constrained by quotas and hence were likely to gain from quota dismantling
in 2005 were cotton bleached fabric and woven bed linen.
Exim Bank (2005) estimated that in the short term, both China and India would gain
additional market share proportionate to their current market share. Exim Bank estimated
that India would have a market share of 13.5 percent in textiles and 8 per cent
in garments in USA market. With regard to EU, it was estimated that the benefits
were mainly in the garments sector. The potential gain in textile sector was limited
in the EU market considering the proposed further enlargement of EU. It was estimated
that India would have a market share of 8 percent in EU textiles market as against
China‘s market share of 12 percent.
Landes et al. (2005) opined that demand for cotton and manmade fibers in India would
likely to strengthen in response to rising consumer demand in India and increased
exports of textiles and apparel following the removing of the MFA quotas. The pace
of growth in cotton demand would hinge on execution of reforms to policies, including
taxes that discriminate against the use of manmade fibers and regulations affecting
the scale, technology use and export competitiveness of the textile and apparel
industries.
Ananthakrishnan and Chandra (2005) analyse the impact of the quota elimination on
India using Global Trade Analysis Project (GTAP -6) in two scenarios. Scenario I
assume a full elimination of quotas, while scenario II assumes a partial elimination
of quotas for China and a full elimination for other countries. The results of the
simulations do not present an optimistic scenario for India in terms of export growth
of Textiles and Clothing in quota free world (Scenario I). They also show that Indian
exports of textiles and clothing will continue to expand in the presence of the
safeguards on China, but will be adversely affected once these are lifted (Scenario
II).
Singh and Kundu (2005) analyzed competitiveness of Indian cotton textile industry
in the wake of liberalization. The study was conducted through an empirical investigation
of 81 senior and middle level executives from cotton textiles manufacturing and
exporting firms in India. The study found that even though globalization had opened
vast market opportunities for Indian cotton textile industry, the industry was exposed
to the threats of fierce competition. The study found that China, Vietnam, Bangladesh
and Malaysia were emerging as major competitors in international textile market.
It was also found that the industry was competitive in terms of input factors –
labour, transportation and raw material but not in terms of finance, power and technology.
From the above reviews, it has been clear that there is no consensus among the researchers
regarding the effect of quota phase out on Indian textile exports. Some of the studies
have portrayed a beneficial result to India in the post quota scenario while there
are studies which depict a gloomy picture for Indian textile exports in the post
MFA period. In the given context, the focus of the present study is to understand
the impact of quota removal on the exports of Indian textile exports in the post
MFA period after 2005.
DATA AND MEASURES
The analysis of export performance has been done with the help of secondary data
collected from published sources. Export data has been collected mainly from Handbook
of Statistics on Indian Economy from RBI as well as CMIE data base. The period of
study covers 22 years (1990-2012). In order to examine the impact of quota removal
(MFA), the study period have been sub-divided into Pre-MFA (1990-2004) and Post
MFA (2005-2013). In the Pre MFA period, there are 4 Phases: I phase (1995-96 to
1997-98), II Phase (1998-89 to 2001-02) and III Phase (2002-03 to -2004-05) and
IV phase (2005-2012). The export data in current prices has been converted into
constant prices by using the WPI deflator to remove impact of price fluctuation.
Export data for different subsectors have been deflated with the corresponding price
deflators. With respect to readymade garments, silk, carpets and coir textiles corresponding
price deflators were not available. These data have been deflated by using the deflator
of textiles. The analysis of export performance has been done with regard to the
change in the composition of exports and destination of exports. In order to understand
the change in the composition of exports during pre and post MFA period, annual
growth rate and Compound Annual Growth Rate has been calculated for the period from
1990 to 2012.
RESULT AND ANLAYSIS
This section describes the changes in Indian textile exports in terms of share of
textiles exports, composition and direction of textile exports.
Table 2: Growth rate and Descriptive statistics for Indian Textile Exports
|
Year
|
Phase
|
Value at Constant price (Rs in Millions)
|
Annual Growth Rate
|
Share to Total Exports (in %)
|
CAGR
|
|
PRE MFA PERIOD
|
|
|
1990-91
|
PHASE - I
|
131.01
|
-
|
17.65
|
16.49
|
|
1991-92
|
187.53
|
43.15
|
20.78
|
|
1992-93
|
234.38
|
24.98
|
23.63
|
|
1993-94
|
222.27
|
-5.16
|
18.59
|
|
1994-95
|
250.15
|
12.54
|
19.82
|
|
|
|
|
|
|
1995-96
|
271.77
|
8.64
|
18.17
|
|
1996-97
|
358.48
|
31.91
|
21.90
|
|
1997-98
|
429.55
|
19.82
|
24.66
|
|
|
|
|
1998-99
|
PHASE - II
|
422.25
|
-1.71
|
23.55
|
6.05
|
|
1999-00
|
479.28
|
13.51
|
24.04
|
|
2000-01
|
568.86
|
18.69
|
23.10
|
|
2001-02
|
534.10
|
-6.11
|
21.51
|
|
|
|
|
2002-03
|
PHASE - III
|
638.58
|
19.56
|
21.63
|
-3.09
|
|
2003-04
|
658.80
|
3.17
|
20.50
|
|
2004-05
|
581.23
|
-11.77
|
15.02
|
|
PRE MFA PERIOD
|
MEAN (Rs in Millions)
|
397.88
|
|
|
Standard Deviation (S.D) (Rs in Millions)
|
174.84
|
|
|
Coefficient of variation (C.V)
|
43.94
|
|
|
Compound Annual Growth Rate (CAGR) (in %)
|
10.44
|
|
|
POST MFA PERIOD
|
|
|
2005-06
|
PHASE – IV
|
726.18
|
24.93
|
15.91
|
5.72
|
|
2006-07
|
779.89
|
7.40
|
14.76
|
|
2007-08
|
770.23
|
-1.24
|
13.32
|
|
2008-09
|
892.16
|
15.83
|
12.77
|
|
2009-10
|
882.50
|
-1.08
|
12.84
|
|
2010-11
|
922.72
|
4.56
|
10.50
|
|
2011-12
|
1044.90
|
13.24
|
9.94
|
|
2012-13
|
1133.48
|
8.48
|
10.20
|
|
POST MFA PERIOD
|
MEAN (Rs in Millions)
|
894.01
|
|
|
Standard Deviation (S.D) (Rs in Millions)
|
140.20
|
|
|
Coefficient of variation (C.V)
|
15.68
|
|
|
Compound Annual Growth Rate (CAGR) (in %)
|
5.72
|
|
Source: Researcher’s calculation based on data from RBI
Table 2 depicts the CAGR and change in the share of textile exports to total exports
from 1990-91 to 2012-13. It is also evident from the table that the CAGR of textile
exports were higher during the pre MFA period (10.44) compared to post MFA (5.72).
Textile exports recorded a negative growth rate in the years of 1993-94, 1998-99,
2001-02 and 2004-05 in the pre MFA period. During 2001-02, the share of textile
exports to total exports recorded a negative growth rate compared to the previous
year. This could be attributed to the slowdown in the economies of some of the major
importing countries such as US, one of the largest trading partners for Indian textile
products and increasing competition from our neighboring countries like China and
Bangladesh. Apart from this India faced the problem of inadequate supply of domestic
cotton and high prices of imported cotton during this period. Along with this, the
unilateral changes introduced by certain trading partners in their rules of origin
also could have adversely affected textile exports during this period. High price
of raw material, high transaction cost and the unfavourable exchange rate also could
have been the factors, which have influenced India’s textile exports in that year
(Annual reports, Ministry of Textiles, 2003)
If we look into the annual growth rate it can be seen that the annual growth of
textile exports recorded a sharp increase from (-11.77) in 2004-05 to 24.93 during
2005-06, the period immediately after the quota removal. After that, India could
not maintain the same momentum in the growth rate. This can be partly attributed
to the effect of economic turbulence in the major exporting market of EU, US and
Canada (Ministry of Textiles, 2009). Apart from this, in the post MFA period, India
is facing stiff competition from Vietnam and Bangladesh in US Market and Turkey
and Bangladesh in the EU market. Bangladesh enjoys duty free access to European
markets, while Indian firms have to pay 9.6 per cent duty on their exports. Labour
cost in Bangladesh is 25 per cent cheaper than in India and products made in Bangladesh
is 15 per cent cheaper than Indian products. Earlier, Bangladesh was known for its
cheap labour, now it is competing in terms of quality, variety and design (Yunus
and Yamagata, 2012).
In 2007-08, the share of textiles exports to total exports recorded a negative growth
of -1.24. During this time textile exports suffered badly due to a perceptible slowdown
of the US economy and the sharp appreciation of rupee by 15per cent against the
dollar. Although the rupee has depreciated sharply vis-à-vis the US dollar since
April 2008, the export prospects of the Indian textiles sector continues to be adversely
affected. Some of the reasons attributed to this decline are the financial sector
melt down and economic slowdown in international markets, liquidity crunch, increased
cost of production because of increasing raw material costs, power and other input
costs which have affected the profitability of textiles and garments units in India
and their exports (Annual Report, Ministry of Textiles, 2009). USA, the single largest
importer of textiles and clothing items, observed a negative growth of 13.22 per
cent and 10.3 per cent in its imports of T&C from the world and India, respectively
in 2009 (Ministry of Textiles, 2010). This could have adversely affected Indian
textile exports in the US market.
It can also be seen from table 2 that the average export of textiles during the
post MFA period (Rs.894.01 million) is higher compared to the pre MFA period (Rs.397.88
million). If we compare the fluctuations in the level of textile exports, it can
be inferred that exports during the post-MFA period was more consistent as coefficient
of variation (CV) was less during then (15.68) compared to pre MFA period (43.94).
Figure 1: Share of Subsectors to Total Textile Exports
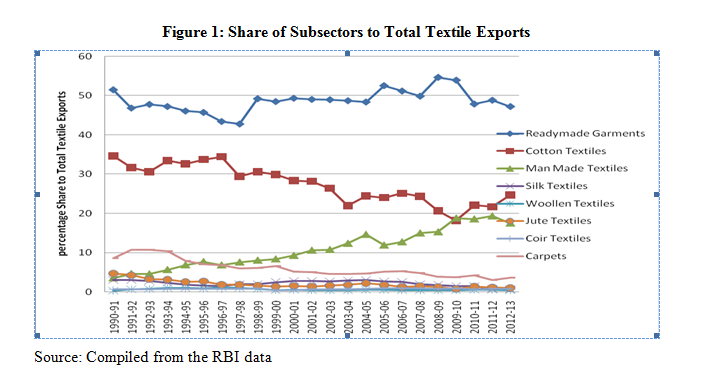
Source: Compiled from the RBI data
Figure 1 depicts the share of subsectors to total textile exports from 1990-91 to
2012-13. It can be seen that readymade garments constitute the largest share in
the overall textile exports accounting for more than 40 percent during the entire
analysis period. The share of cotton textile exports shows a slow declining trend
from 1997-98 to 2003-04. From 2005-06 onwards the share of this sector remains more
or less constant. The share of cotton textile exports to total exports was lowest
during 2009-10. This can be attributed to the decline in the production of cotton
fabrics, which constitute around 48 percent of the total fabric produced. Cotton
fabrics registered a yearly decline of over 17 percent during this time period (Ministry
of Textiles, 2009-10). The share of manmade textiles to total textile exports shows
an upward trend during the study period. This indicates the fact that there is a
marginal improvement in the share of manmade textiles to total textile exports during
the post MFA period. The above analysis points to the fact that readymade garments
still constitute the largest share of total textile exports from India. It is also
to be noted that the share of cotton textiles shows a marginal decline whereas the
share of manmade textiles shows a marginal increase during the post MFA period.
From this it can be concluded that the composition of textile exports have undergone
only a minor change in the post MFA period.
Table 3: Phase wise CAGR of subsectors of Indian Textile Exports under MFA
|
Year Sector
|
I Phase (1995-97)
|
II phase (1998-2001)
|
III Phase (2002-2004)
|
IV phase (2005-10)
|
|
Textiles (Excluding Readymade Garments)
|
16.49
|
6.05
|
-3.09
|
5.72
|
|
Readymade garments
|
13.94
|
5.96
|
-3.47
|
4.33
|
|
Cotton Textiles
|
11.27
|
3.88
|
-5.52
|
6.08
|
|
Manmade Textiles
|
15.8
|
13.54
|
7.32
|
10.94
|
|
Woollen Textiles
|
19.38
|
-7.03
|
6.67
|
3.6
|
|
Jute Textiles
|
2.46
|
2
|
7.76
|
-1.16
|
|
Silk Textiles
|
22.95
|
15.23
|
0.19
|
-11.95
|
|
Carpets
|
15.23
|
-2.55
|
3.93
|
4.1
|
|
Coir Textiles
|
10.75
|
0.78
|
-2.32
|
1.01
|
Source: Researcher’s calculation based on data from RBI
Table 3 shows the CAGR of subsectors of Indian textiles under different phases of
MFA. If we compare the CAGR of overall textile exports under different phases, it
can be seen that textiles as a whole recorded the highest CAGR in I phase (16.49
percent). If we compare this with the IVth phase (post MFA), the growth
has come down to 5.72 percent. A comparison of the CAGR of the different subsectors
in I phase shows that the highest CAGR was recorded in the silk textiles (22.95
percent) followed by woollen textiles (19.38 percent) and manmade textiles (15.8
percent). In the II phase, also silk textiles (15.23 percent) recorded the highest
CAGR followed by manmade textiles (13.54 percent) and readymade garments (5.96 cent).
In the III phase, most of the subsectors recorded a negative CAGR except manmade
textiles, woollen, jute, silk and carpets. This may due to the impact of recession
in US economy, which is one of the major export destinations for Indian textiles.
In the IV phase (post MFA), highest CAGR was recorded in manmade textiles (10.94
percent) followed by cotton textiles (6.08 percent) and readymade garments (4.3
percent). Likewise, if we compare the CAGR across the different phases it can be
seen that all the sectors recorded highest CAGR in the I phase compared to other
phases. This indicates the fact that in the liberalized trading regime India is
losing its position to its competitors. One of the areas where India could have
lost out to competitors is in terms of the integrated production facility. Countries
that have emerged globally competitive have a significantly consolidated supply
chain (Bharath textiles.com, 2013).
The elimination of quotas has opened new vistas for the international market for
textile and clothing export especially for the developing economies. Most of the
reviews cite US and EU as the two major trading partners for Indian textile products.
In the given background table 2 portrays the change in the destinations of Indian
textile exports during the pre and post MFA period.
Table 4: Destination for Indian Textile Exports- Pre and Post MFA Analysis
|
Sectors
|
Pre MFA (%)
|
Post MFA (%)
|
|
Textiles (Excluding Readymade Garments)
|
USA (21.4) UK (9.2) Germany (8.8)
|
USA (20.6) UAE (8) Bangladesh (6.82)
|
|
Readymade Garments
|
USA (33.94) Germany (9.99) UK (9.71)
|
USA (28.72) UK (12.35) UAE (9.23)
|
|
Cotton Textiles
|
USA (24.33) Bangladesh (11.9) UK (11.47)
|
UAE (14.3) Japan (10.17) Egypt (6.6)
|
|
Manmade Textiles
|
UAE (27.23) UK (10.09) Italy (6.48)
|
UAE (16.84) Turkey (8.64) Italy (3.3)
|
|
Woolen Textiles
|
UK (34.59) USA (18.22) Japan (16.28)
|
Italy (30.4) UK (27.09) USA (11.03)
|
|
Jute Texiles
|
Belgium (27.08) USA (24.3) UK (11.99)
|
USA (17.9) UK (10.61) Turkey (9.23)
|
|
Coir Textiles
|
USA (32.6) UK (10.91) Netherlands (10.1)
|
USA (32.2) China (10.3) Netherlands (8.2)
|
|
Carpets
|
USA (42.64) Germany (26.86) UK (4.89)
|
USA (42.41) Germany (16.81) UK (6.47)
|
Source: Compiled from Economic Outlook, CMIE.
Table 4 depicts the change in the destinations of Indian textile exports with respect
to different subsectors. India’s major textile destinations for textiles (excluding
readymade garments) during the pre MFA period were USA (21.4 per cent), UK (9.2
percent), Germany (8.8 percent), UAE (8 per cent) and Bangladesh (5.9 percent).
During the post MFA period, USA remained as the major textile exports destinations
with a share of 20.62 per cent. However, the share of USA has decreased from 21.4
per cent in the pre MFA period to 20.62 per cent in the post MFA period. A decrease
in the share of US can be attributed to lower domestic demand and increased imports
from preferential trading partners. An interesting trend in the post MFA period
is that UK which was holding the second position in terms of destination with a
share of 9.2 in the pre MFA period has come down to the 7th position
with a share of 4.7 per cent in the post MFA period. UAE that had a share of 8 per
cent in the Pre MFA period could improve its position as the second most important
destination with a share of 7.67 per cent followed by Bangladesh (6.82) and Germany
(5.73).
In the case of readymade garments, the major export destinations during the pre
MFA period were USA (33.94 per cent), Germany (9.99 per cent), UK (9.71 per cent)
followed by UAE (7.82 percent) and France (7.65 percent). Post MFA analysis shows
that the share of US in Indian garment imports has come down from 33.94 per cent
to 28.72 per cent. However, US still could maintain its rank as the largest importer
of Indian readymade garment products. In 2008-09, US, single largest importer of
Indian textile products observed a negative growth rate of 0.55 per cent in its
imports of textiles from India. This has reduced the Post MFA share of US in Indian
textile imports. One of the most remarkable shifts in the trend of Indian apparel
trade is that UK, which was in the third position with a share of 9.71 per cent
during Pre MFA period, has improved its position as the second largest importer
of Indian textiles in the Post MFA period with a share of 12.35 per cent. This shows
the compensatory gain of India in EU market at the expense of US during the post
MFA period. The share of UAE in the Indian garment imports has increased from 7.82
per cent during the pre MFA to 9.23 per cent. This is a clear indication that India
has taken the step to diversify its export market to other countries rather than
depending on US and EU alone.
India’s major trading destinations of cotton yarn, fabrics and made ups were USA
(24.33 per cent), Bangladesh (11.9 per cent), UK (11.47 per cent) followed by Germany
(8.13 per cent) and Hong Kong (7.82 per cent) during the pre MFA period. UAE, a
non quota country which had a share of 5.28 per cent in the pre MFA period became
the largest destination for cotton textiles in the post MFA period with a share
of 14.3per cent followed by Japan (10.17 per cent), Egypt (6.6 per cent), Turkey
(6.27 per cent) and Bangladesh (5.83 per cent). USA, which was the single largest
destination in the pre MFA period, has come down to ninth position in terms of import
destination with a share of 3.55per cent. This clearly shows that India has diversified
its export market in the post MFA period by exporting to different countries, including
the non-quota member countries.
Major destinations of manmade textiles during the pre MFA period were UAE (27.23per
cent), UK (10.09 per cent), Italy (6.48 per cent), Saudi (6.47 per cent) followed
by Turkey (5.95 percent) and USA. Share of UAE has decreased to 16.84 per cent in
the post MFA period. But it still remains as the largest destination for Indian
manmade imports. Turkey, which had a share of 5.95per cent during pre MFA period,
has increased its share to 8.64 percent to become the second largest destination
for manmade imports. UK, which was the second largest importer of manmade textiles
during the pre MFA period, has relegated to the 8th position in terms of its imports
from India. Likewise, Italy, which had a share of 6.48 per cent before 2005, has
experienced a decrease in its share to 3.3per cent during post MFA period.
India’s major woolen textiles export destinations were UK (34.59 per cent), USA
(18.22 per cent), Japan (16.28 per cent) followed by Italy (14.57 per cent) and
UAE (6.67per cent). An interesting observation during the post MFA period is that
Italy, which had a share of 14.57 per cent, has increased its share to 30.40 per
cent to become the single largest destination for Indian woolen exports. UK, which
was the largest destination for woolen exports with a share of 34.59 per cent during
pre MFA period, has moved to the second position with a share of 27.09 per cent
during the post MFA period.
In the case of jute textiles, during the pre MFA period, Belgium was the highest
destination for exports with a share of 27.08 per cent, followed by USA (24.3 per
cent), UK (11.99 per cent), Turkey (9.55 per cent) and Egypt (6.89 per cent). Belgium,
which was the largest single destination for Indian jute exports during the pre
MFA period, experienced a decline in their imports share after the removal of quota.
Share of Belgium imports has come down to 8.4 per cent thereby occupying the sixth
important position as the destination for Indian jute imports during the post MFA
period. Other major export destinations also experienced decline in their import
share. In the post MFA period, USA became the largest destination for jute exports
with a share of 24.3 per cent. Even though USA has become the largest importer of
jute products USA’s share has decreased to 17.9 per cent and UK experienced a marginal
decline in their import share 10.61 per cent. At the same time, India was able to
improve its market share in countries like Egypt and Saudi to the extent of 8.52
per cent and 9.23 per cent respectively. A decline in the share of major destinations
like Belgium, USA and UK may be due to the predominance of Bangladesh in these markets.
(Ministry of Textiles, 2010).
A comparison of the coir exports destinations during the pre and post MFA period
shows the USA has been remaining as the single largest destination for Indian coir
exports with a share of 32.6 per cent (Pre MFA) and 32.2 per cent (post MFA) respectively.
At the same time UK, which had a share of 10.9 per cent during the pre MFA period,
has experienced a decline in their share to the extent of 7.9 per cent in the post
MFA period. China, which had an import share of 0.03 per cent during the pre MFA
period, has experienced a huge increase in their share to the extent of 10.3 and
became the second largest destination for Indian coir exports during the post MFA
period. This may be due to the Export Market Development Assistance scheme initiated
by the government to improve the performance of coir textile exports in the international
markets China mainly uses this yarn to manufacture value added products and export
to other countries, including India. This has improved the Chinese demand for coir
textiles from India (Coir board, 2014).
With regard to the carpet export destinations, USA maintained as the largest trading
partner during the entire study period followed by Germany and UK. In the case of
Germany and UK, the share has come down in the post MFA period.
CONCLUSION
The above analysis throws light upon the fact that India could marginally improve
her performance in the post MFA period. A comparison of the CAGR during the study
period shows that textile exports as well as the sub sector exports showed a low
CAGR in the post MFA period compared to pre MFA. In terms of the CAGR, highest growth
was recorded in the manmade textiles followed by cotton textiles in the post MFA
period. Total textile exports also show a low CAGR in the post MFA period.
An important observation that emerges from the study is that USA could maintain
its position as the largest destination for Indian textile exports in the segment
of textiles, readymade garments, coir and carpets even during the post MFA period.
Even though USA remains as the largest export destination in the post MFA period,
the share of India exports to USA has come down in the post MFA period. This contradicts
the results of the previous studies which has projected India to increase its market
share in the US in the post MFA period (Exim Bank, 2005). Emergence of UAE as the
single largest destination for cotton textile exports is another important noteworthy
observation in the post MFA period.
Even though India could improve the performance after the quota removal, the present
analysis shows that the gain of Indian textiles and clothing exports in the post
MFA era have not been commensurate with its expectation. In the international markets
India is facing stiff competition from a host of countries especially Bangladesh,
Vietnam and China. Indian textile exports are suffering because raw materials are
phenomenally high priced. This makes the end product expensive by 15-30 per cent
than other competing markets. Also, the presence of more low end and low value added
items in India’s export basket also would have affected the competitiveness of Indian
textiles in the international market. The absence of contemporary designing facilities
and the failure to provide quality value added fabrics and garments act as a hindrance
for India to move up in the value chain. In order to improve the export performance,
India needs to continue pushing its exports to non-traditional emerging markets
of Africa, Asia CIS and Latin America. Indian textile industries inherent strength
such as availability of raw materials, especially cotton, integrated operations
and design skills would favour the shift of world export of textile industry to
India.
REFERENCES
Ananthakrishnan, P., & Jain-Chandra, S. (2005). The impact on India of trade
liberalization in the textiles and clothing sector. International monetary fund
(IMF).
Bharath Textiles. (2013). Indian Textile Exports: Post-MFA Scenario Opportunities
and Challenges. http://www.bharattextile.com/
Chadha, R., Pohit, S., Stern, R. M., & Deardorff, A. V. (1999). Phasing out
the Multi-Fibre Arrangement: Implications for India. Global Trade Analysis Project
(GTAP) at Purdue University.
Cline, W. R. (1990). Chapter 12: Textile and Apparel Negotiations in the Uruguay
Round: an Evaluation of the Proposals. Institute for International Economics.
Corporate Catalyst India Pvt Limited, (CCI) . (2015). A Brief Report on Textile
Industry in India. July 2015.
dhallenge
CMIE. Economic Outlook. Various issues. Center for Monitoring Indian Economy Pvt.
Ltd, Mumbai.
Coir Board. (2014). Evaluation Study of Domestic Market Development Assistance Scheme
implemented by Coir Board. Coir Board.
Exim Bank: Research Brief. (2005). Textile Exports: Post MFA Scenario Opportunities
and Challenges, No.11, Feb., online available at www. Eximbankindia.com. pp. 1-4.
Kathuria, S., Martin, W. and Bhardwaj, A. (2001). Implications for South Asian countries
of abolishing the multifibre arrangement, World Bank Working Paper 2721, Washington,
D.C. www.worldbank.org
Landes, Maurice ,Stephen Macdonald,Santosh K.Singh and Thomas Vollrath .(2005).
Growth Prospects for India’s Cotton and Textile Industry, CWS-05d-01, Economic Research
Service, US Dept. of Agriculture.
Martin, W. and Winters, L.A. (1996).The Uruguay Round and Developing Countries,
Cambridge University Press, Cambridge, pp.216-250.
Mehta, R. (1997). Trade Policy Reforms, 1991-92 to 1995-96: Their Impact on External
Trade. Economic and Political Weekly, 779-784.
Nanda, P., & Raikhy, P. S. (2001). WTO, Environmental and Labour Standards and
India's Textile Exports—Some Implications. WTO and the Indian economy, 298-311.
Ministry of Textiles Annual report. (2003-04). available at:
http://apparel.indiamart.com/annual-report/highlights.html.
Ministry of Textiles Annual report. (2008-09). available at: http://apparel.indiamart.com/annual-report/highlights.html.
Ministry of Textiles. (2009-10).Annual Report, Available at
http://texmin.nic.in/texpolicy
Ramachandran, V. (2001). Export Competitiveness and the Market for Textiles: A Summary
of Research. Harvard Studies – 7, Harvard University, January.
RBI .( Various Years). Data base on Indian Economy. Available at
http://dbie.rbi.org.in/
Singh, Narendra and Surinder S. Kundu. (2005). An analysis of the Competitive Dimensions
of Indian Cotton Textile Industry. Foreign Trade Review. Vol. XL No.1 (April-June)
pp 70-86.
Spinanger, D. (1999). Textiles Beyond the MFA Phase‐Out. The World Economy,
22(4), 455-476.
Verma, Samar. (2002). Export Competitiveness of Indian Textile and Garment Industry.
ICRIER, November. Working Paper No.94 pp 1-43.
World Trade Organization (WTO). International Trade Statistics, Various Issues.
Geneva.
Yunus, M., & Yamagata, T. (2012). The garment industry in Bangladesh, Chapter
6, Experience of Asia and Africa (Interim Report). Chousakenkyu Houkokusho, IDE-JETRO.
[1] Market disruption’’ was defined as instances of
sharp import increases associated with low import prices not attributable to dumping
or subsidies (Cline, 1990).

