A Refereed Monthly International Journal of Management
The Economic Modeling of International Trade between Ukraine and Free Trade Areas
|
Violetta O.Petukhova
International Economic Relations Department
V.N. Karazin Kharkiv National University
|
Gacim Salah
International Economic Relations Department
V.N. Karazin Kharkiv National University
|
Petr I. Ospishchev
Belgorod State Technological University
(named after V.G. Shukhov)
|
Svetlana L. Lesovaya
Belgorod State Technological University
(named after V.G. Shukhov)
|
Marina N. Nesmeyanova
Belgorod State Technological University
(named after V.G. Shukhov)
|
Abstract
The research subject examined the dynamics of Ukraine international trade with countries
which it has created and intends to create the free trade areas. The import, export
and trade balance data were taken as the basis in the period from 2004 till 2014.
The exports, imports and trade balance are the most important figures in the studying
of the international trade. The export is a transportation of goods, works and services,
results of intellectual activity, including exclusive rights to them from the customs
territory of the abroad countries without the obligation of re-importation. The
transportation
capacity of goods and services and results of intellectual activity characterizes
the indicator "export" that is calculated in terms of cost for a certain period,
usually for a year. The import is a transportation of goods, works and services,
results of intellectual activity, includes exclusive rights to them, the customs
territory of the countries from abroad without the obligation to the re-export.
This process describes the indicator "import" that is calculated in terms of cost
for a certain period, usually for a year. The trade balance is the difference between
cash receipts and costs over time. The forecast was made on the dynamics of international
trade basis within the free trade areas framework in the future. If exports (revenues)
are bigger than imports (payments), the balance is positive and the trade balance
is active. If exports (revenues) are less than imports (payments), the balance is
negative and trade balance is passive. The research methodology is economic modeling
techniques and such methods like observation and comparison. The research goal is
to study the dynamics of international trade within Ukraine free trade areas, the
forecast forward for several years, comparing different indicators for years. The
ultimate goal is to solve the pertinence one or another free trade area for Ukraine
for economic point of view and answering the question can it be
profitable for Ukraine. The conclusion of the research is that Ukraine needs
to create free trade areas with other countries, as well as other countries, it
must integrate into the global economy through globalization worldwide. From our
point of, all of the free trade areas are equally important for Ukraine, because
they bring revenue to the country through the international trade. The priority
for Ukraine is free trade area with the EU. The largest trading partners of Ukraine
among the countries the EU members are traditionally Germany, Italy, the Great Britain
and Poland, Hungary and Slovakia. By all indicators, despite the recession of trade
due to the global financial crisis, such alliances are profitable for Ukraine, because
in the future they can become more powerful unions.
Keywords: integration, international trade, free
trade area, polynomial trend, forecast, turnover.
Introduction
The analysis of international trade among countries is an important component in
the studying international economic relations features among the states. Ukraine
has created the free trade areas with other countries. They also contribute to the
international economic relations development among these countries and the international
trade development in Ukraine and other countries. The free trade areas can become
deeper integration groupings over time, what will promote economic development in
the regions. Bringing to the notice that now Ukraine has intentions to create a
free trade area with the EU, Turkey, Canada, and Israel except already created free
trade areas with such countries like the EFTA countries and Montenegro, Macedonia.
Now the collaboration the CIS free trade area and Ukraine is suspended. The theme
of this article is updated and new because Ukraine intends to deepen international
economic and trade relations with these countries in the future by creating new
free trade areas. It will also help it expand into new international markets, especially
the markets of Asia and North America via trade links with countries with which
it intends to create the free trade areas. Ukraine also wants to strengthen international
trade relations with countries with whom it already has the free trade areas. The
goal of the research in this article is to study the international trade dynamics
and further trade forecast Ukraine with the countries which have already established
international economic relations within the free trade areas and with countries
with whom Ukraine negotiates according to the establishment of such areas.
Materials and Methods
The research methodology is economic modeling. The import, export and trade balance
data of Ukraine were taken abovementioned countries from 2004 till 2014 in the analysis
of free trade among Ukraine and other countries regression. The Ukraine international
trade analysis was made on the basis of these data and polynomial trend in Microsoft
Excel program. The regression analysis is a method that makes it possible to determine
the form of relations between random variables and values have established distribution
law of one variable on changes in another (for example, supply and demand) (Golikov,2009).
The action modeling of foreign economic activities by regression analysis means
allows to visually demonstrating causal relationships that affect the world economic
processes (Golikov, 2009). The polynomial trend is used to describe time series,
alternately increasing and decreasing. Polynomial is very good for analysis of a
large dataset unstable (e.g. sales of seasonal goods). Polynomial is a stepped function
y = +bx+d (second degree polynomial) and y = + +cx+d
(third degree polynomial) etc. The degree of the polynomial determines the extremes
(peaks) number, i.e. maximum and minimum values for the analyzed period of time
(Program for forecasts, 2016). In this research we used polynomial of the second
degree. There are other trends that can predict these or other developments in international
economic relations, but the most accurate is polynomial trend. There were used methods
such as the method of comparison, the method of observation.
1.The economic modeling of international trade forecast among Ukraine and now
working free trade areas.
The economic modeling of international trade forecast between Ukraine and the EFTA
countries. According to the table during the period from 2004 to 2014, the highest
export rate between Ukraine and the EFTA was 607028.2 thousand US dollars in 2009,
the smallest was208921.4 thousand US dollars in 2014. The highest rate of imports
between Ukraine and the EFTA was 1498633.2 thousand US dollars in 2008; the smallest
was 317349.3 thousand US dollars in 2011. The highest rate of trade balance was
48948.28 thousand US dollars in 2005, the smallest was (-1098051.6) thousand US
dollars in 2013. As shown by our study, the intensity turnover between Ukraine and
the EFTA significantly decreased from 2008 due to the global financial crisis.
Table 1. The indicators of international trade capacity between Ukraine and the
EFTA in 2004-2014.
|
Year
|
Export ( thousand US dol.)
|
Import ( thousand US dol. )
|
Balance
|
|
2004
|
498362.9
|
389787.9
|
-237188.46
|
|
2005
|
444644.4
|
395696.1
|
48948.28
|
|
2006
|
199553.9
|
493432.1
|
-293878.2
|
|
2007
|
215014.8
|
708792.5
|
-493777.7
|
|
2008
|
971064.1
|
1498633.2
|
-527569
|
|
2009
|
607028.2
|
741339.3
|
-134311.1
|
|
2010
|
556631.9
|
772386.7
|
-266220.9
|
|
2011
|
68407.8
|
317349.3
|
-248941.6
|
|
2012
|
238526.9
|
1226589.6
|
-988062.7
|
|
2013
|
284185.9
|
1382237.5
|
-1098051.6
|
|
2014
|
208921.4
|
1152539.7
|
-943618.9
|
Table compiled by the author according to the source (The State Statistics Committee
of Ukraine).
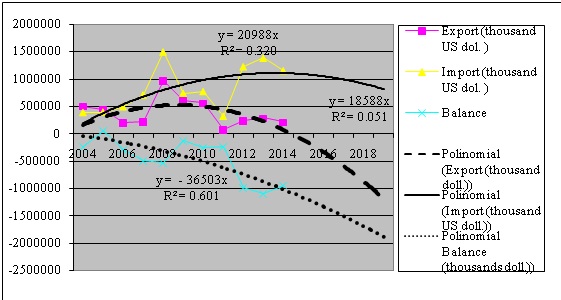
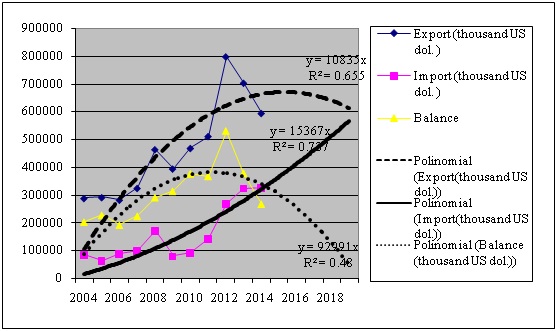
The diagram 1 was built on data basis from table 1, where exports, imports and trade
balance between Ukraine and the EFTA for five years were forecasted based on regression
analysis (polynomial trend) (Golikov,2009). So, according to our calculations, the
ratio of exports approximation is R^2=0.0518, import isR^2=0.3204, trade balance
isR^2=0.6012. This indicator approximation coefficient confirms that the probability
of the forecast in polynomial trend terms is average, i.e. more or less accurate,
because in the original datum on basis the forecast was made are relatively sustainable.
This suggests that international trade relations between Ukraine and the EFTA have
superimpose character. According to the diagram 1, the trade turnover between Ukraine
and the EFTA is relatively high. The import substantially is goes before the export,
this is a negative tendency for Ukraine. The regression analysis according to the
forecast indicates that exports, imports and trade balance of Ukraine and the EFTA
has tendency to decrease. According to this forecast in 2019 export may reach about
(-1200000) thousand US dollars, import - 90000 thousand US dollars, trade balance
–1800000 thousand US dollars.
Diagram 1. The indicators foreign trade capacity between Ukraine and the EFTA in
the period from 2004-2014.
The diagram was made by the author according to the source (The State Statistics
Committee of Ukraine).
The economic modeling of international trade forecast between Ukraine and Montenegro.
According to the table 2 during the period from 2008 to 2014, the highest export
rate between Ukraine and Montenegro was in 3866 thousand US dollars in 2010; the
smallest export rate was 480.3thousand US dollars in 2009. The highest rate of import
between Ukraine and and Montenegro was 2982.2thousand US dollarsin 2012, the smallest
was 317349.3 thousand US dollars in 2011. The highest rate of trade balance was
(-11035474) thousandin2011, the smallest was (-1098051.6) thousand US dollars in
2013. Our research shows that the intensity turnover between Ukraine Montenegro
declined significantly since 2008 due to the global financial crisis, but from 2010the
turnover has been increased.
Table 2. The indicators of international trade capacity between Ukraine and Montenegro
in 2004-2014.
|
Year
|
Export ( thousand US dol. )
|
Import ( thousand US dol. )
|
Balance
|
|
2008
|
2703.5
|
997
|
1706.5
|
|
2009
|
480.3
|
927.3
|
-447
|
|
2010
|
3866
|
2310.7
|
1555.3
|
|
2011
|
2639
|
1086.3
|
1552.7
|
|
2012
|
2639
|
2982.2
|
2734.3
|
|
2013
|
1395.5
|
1131.3
|
264.2
|
|
2014
|
1796.4
|
1082.6
|
713.8
|
|
|
|
|
|
|
Table compiled by the author according to the source (The State Statistics Committee
of Ukraine).
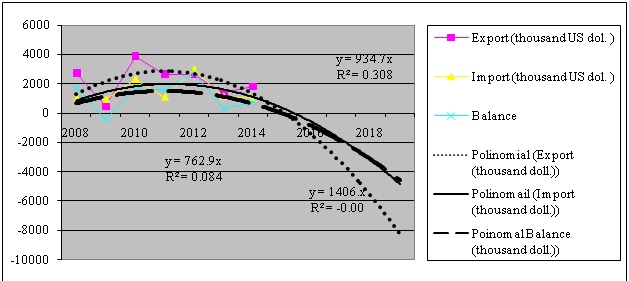
The diagram 2 was built on data basis from table 2, where exports, imports and trade
balance between Ukraine and Montenegro for five years were forecasted based on regression
analysis (polynomial trend) (Golikov,2009). So, according to our calculations, the
ratio of exports approximation is R2= 0.3089, import is R2=
-0.0012 (R2=0), trade balance is R2 = 0.0849. This indicator
approximation coefficient confirms that the probability of the forecast in polynomial
trend terms is low. It has such tendency due to a full free trade area between Ukraine
and Montenegro was formed recently and analyzed basic data were very low in relative
terms of trade between Ukraine and other free trade areas. According to the diagram
2, the trade turnover between Ukraine and Montenegro is low. Export and import are
in almost the same dynamics. The regression analysis according to the schedule indicates
that exports, imports and trade balance of Ukraine and Montenegro tend to decrease.
According to this forecast in 2019 export may reach about (-1200000) thousand US
dollars, import – 90000 thousand US dollars, trade balance – 1800000
thousand US dollars.
Diagram 2. The indicators foreign trade capacity between Ukraine and Montenegro
in the period from 2004-2014.
The diagram was made by the author according to the source source (The State Statistics
Committee of Ukraine).
The economic modeling of international trade forecast between Ukraine and Macedonia.
According to the table 3 during the period from 2004 to 2014, the highest export
rate between Ukraine and Macedonia was 84134.5 thousand US dollars in 2008, the
smallest was 8095.1 thousand US dollars in 2013. The highest rate import between
Ukraine and Macedonia was 147545.3 thousand US dollars in 2011. The smallest was
2371.32 thousand US dollars in 2008. The highest rate of trade balance was 176822.8
in 2008 thousand US dollars, the smallest was (-65733.7) thousand US dollars in
2011. Our research shows that the turnover intensity between Ukraine and Macedonia
substantially decreased y from 2008 due to the global financial crisis.
Table 3. The indicators of international trade capacity between Ukraine and Macedonia
in 2004-2014.
|
Year
|
Export ( thousand US dol. )
|
Import ( thousand US dol. )
|
Balance
|
|
2004
|
50240.89
|
2371.32
|
47869.57
|
|
2005
|
35925.26
|
2566.11
|
33359.15
|
|
2006
|
69501.4
|
4876.3
|
64625.1
|
|
2007
|
97102.4
|
8328.9
|
88773.5
|
|
2008
|
184134.5
|
7311.7
|
176822.8
|
|
2009
|
42278.6
|
31324.1
|
10954.5
|
|
2010
|
95952.9
|
26269.7
|
69683.1
|
|
2011
|
81811.6
|
147545.3
|
-65733.7
|
|
2012
|
13033.2
|
26201.4
|
-13168.3
|
|
2013
|
8095.1
|
32666.4
|
-24571.4
|
|
2014
|
40538.8
|
21331.4
|
19207.3
|
Table compiled by the author according to the source (The State Statistics Committee
of Ukraine).
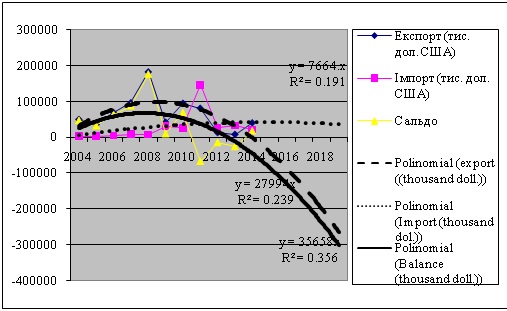
The diagram 3 was built on data basis from table 3, where exports, imports and trade
balance between Ukraine and Macedonia for five years based on regression analysis
(polynomial trend) (Golikov,2009). Consequently, according to our calculations,
the ratio of exports approximation is R2= 0.2391, import is R2=
0.1919, trade balance is = 0.2391. This indicator approximation coefficient confirms
that the probability of the forecast in polynomial trend terms is average. It has
such tendency due to the original data on which the forecast was made is relatively
sustainable. The situation is formed due to international trade relations between
Ukraine and Macedonia has relatively well-established character. According to the
diagram 3, the trade turnover between Ukraine and Macedonia is low. The import is
substantially bigger than export; this is a negative tendency in Ukraine. The regression
analysis according to the forecast indicates that exports and trade balance of Ukraine
and Macedonia have a tendency to decrease. And an import tends to growth. According
to this forecast exports may reach for about (-270000) thousand US dollars in 2019,
imports can be (-300000) thousand US dollars, trade balance can be (-9,900) thousand
US dollars.
Diagram 3. The indicators foreign trade capacity between Ukraine and Macedonia in
from 2004-2014.
2.2.The economic modeling of international trade forecast among Ukraine and
now working free trade areas
Currently the negotiations are carrying on according to bilateral free trade agreements
between Canada and Ukraine, Turkey, Israel (Ministry of foreign affairs of Ukraine:
according to the free trade agreements). Ukraine also intends to create a free trade
area with the EU. The work is continuing to determine the economic feasibility of
concluding free trade agreements with other important trading partners of Ukraine
(Ministry of foreign affairs of Ukraine: according to the free trade agreements).
The economic modeling of international trade forecast between Ukraine and Turkey.
According to the table 3 during the period from 2004 to 2014, the highest export
rate between Ukraine and Turkey was 3805477.8thousand US dollars in 2013, the smallest
was 1869198.98 thousand US dollars in 2013. The highest rate import between Ukraine
and Turkey was 1951858.2 thousand US dollars in 2012. The smallest was 368358.01
thousand US dollars in 2004. The highest rate of trade balance was 2683158.2in 2008
thousand US dollars, the smallest was1174282.9 thousand US dollars in 2009. As it
was shown in our study, the intensity of trade turnover between Ukraine and Turkey
significantly decreased since 2008 due to the global financial crisis, but in 2011
the turnover has increased.
Table 4. The indicators of international trade capacity between Ukraine and Turkey
in 2004-2014.
|
Year
|
Export ( thousand US dol. )
|
Import ( thousand US dol. )
|
Balance
|
|
2004
|
1869198.98
|
368358.01
|
1500841
|
|
2005
|
2034974.78
|
607697.21
|
1427277.6
|
|
2006
|
2390039.2
|
769080.8
|
1620958.4
|
|
2007
|
3650005
|
972079.2
|
2677925.8
|
|
2008
|
4633291.4
|
1950133.2
|
2683158.2
|
|
2009
|
2126526.4
|
952243.6
|
1174282.9
|
|
2010
|
3026668.7
|
1298282.2
|
1728386.4
|
|
2011
|
3748582
|
1481242.1
|
2267339.9
|
|
2012
|
3685112.6
|
1951858.2
|
1733254.4
|
|
2013
|
3805477.8
|
1852685
|
1952792.8
|
|
2014
|
3561436.2
|
1298157.3
|
2263278.9
|
Table compiled by the author according to the source (The State Statistics Committee
of Ukraine).
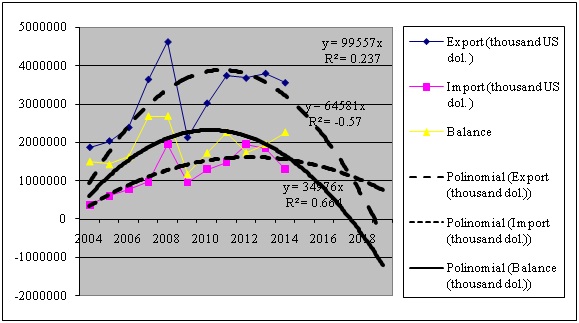
The diagram 4 was built on data basis from table 4, where exports, imports and trade
balance between Ukraine and Turkey for five years based on regression analysis (polynomial
trend) (Golikov,2009). Consequently, according to our calculations, the ratio of
exports approximation is R2= 0.375, import is R2= - 0.574
(R2=0), trade balance is R2=0.664. This indicator approximation
coefficient confirms that the probability of the forecast in polynomial trend terms
is very low because in the original data on which the forecast was made tend to
sharp fluctuations. This suggests that international trade relations between Turkey
and Ukraine have established character. According to the figure 4, the trade turnover
between Ukraine and Turkey today is low. The export is substantially ahead of imports,
this trend is positive for Ukraine. Regression analysis according to the diagram
4 indicates that the export and import trade balance of Ukraine and Turkey tend
to decrease. The balance has a tendency to growth. If the free trade area between
Turkey and Ukraine work in full and the norms of international economic relations,
trade turnover negative trends will eventually level off. According to this forecast
exports may reach for about (-5000000) thousand US dollars in 2019, imports can
be 900000 thousand US dollars, trade balance (-15000000) thousand US dollars.
Diagram 4. The indicators foreign trade capacity between Ukraine and Turkey in from
2004-2014.
The diagram was made by the author according to the source (The State Statistics
Committee of Ukraine).
The economic modeling of international trade forecast between Ukraine and Israel.
According to the table 5 during the period from 2004 to 2014, the highest export
rate between Ukraine and Israel was 796370.2 thousand US dollars in 2012, the smallest
was 281678.1 thousand US dollars in 2004. The highest rate import between Ukraine
and Israel was 325633.3thousand US dollars in 2012. The smallest was 62994.27thousand
US dollars in 2005. The highest rate of trade balance was in 529579.8thousand US
dollars in 2012, the smallest was 192027.8 thousand US dollars in 2006. As it was
shown in our study, the intensity of trade turnover between Ukraine and Israel significantly
decreased since 2008 due to the global financial crisis, but since 2012 the turnover
has increased.
Table 5. The indicators of international trade capacity between Ukraine and Israel
in 2004-2014.
|
Year
|
Export ( thousand US dol. )
|
Import ( thousand US dol. )
|
Balance
|
|
2004
|
287586.18
|
84348.24
|
203237.94
|
|
2005
|
290738.61
|
62994.27
|
227744.34
|
|
2006
|
281678.1
|
89650.2
|
192027.8
|
|
2007
|
323922.1
|
99907.3
|
224014.8
|
|
2008
|
463026.5
|
172267.1
|
290759.5
|
|
2009
|
393597.2
|
79881.2
|
313716
|
|
2010
|
467583.9
|
91476
|
376107.9
|
|
2011
|
510217
|
142958
|
367259
|
|
2012
|
796370.2
|
266790.4
|
529579.8
|
|
2013
|
701825.5
|
323165.9
|
378659,6
|
|
2014
|
593062.3
|
325633.3
|
267429
|
The diagram was made by the author according to the source (The State Statistics
Committee of Ukraine).
The diagram 5 was built on data basis from table 5, where exports, imports and trade
balance between Ukraine and Israel for five years based on regression analysis (polynomial
trend)(Golikov,2009). Consequently, according to our calculations, the ratio of
exports approximation is R2= 0.6559, import is R2= 0.48, trade
balance is R2=0.7373. This indicator approximation coefficient confirms
that the probability of the forecast in polynomial trend terms is relatively average.
This trend is the fact that the original data on which the forecast was made, without
large fluctuations. This indicates that trade between Ukraine and Israel has established
character. According to the diagram 5, the trade turnover between Ukraine and Israel
today is not low. The export is substantially ahead of imports, this trend is positive
for Ukraine. Regression analysis according to the diagram 5 indicates that the export,
the import and the trade balance of Israel and Ukraine is tending to decrease. Regression
analysis according to the diagram 5 indicates that to the exports, imports and trade
balance of Ukraine and Israel have a tendency to growth. If the free trade area
between Israel and Ukraine work in full and the norms of international economic
relations, trade turnover negative trends will eventually level off with time. According
to this forecast exports may reach for about 610000 thousand US dollars in 2019,
imports can be 590000 thousand US dollars, trade balance (-15000000) thousand US
dollars.
The diagram was made by the author according to the source (The State Statistics
Committee of Ukraine).
The economic modeling of international trade forecast between Ukraine and Canada.
According to the table 6 during the period from 2004 to 2014, the highest export
rate between Ukraine and Canada was 144090.4 thousand US dollars in 2008, the smallest
was 57441 thousand US dollars in 2013. The highest rate import between Ukraine and
Canada was 243072.4 thousand US dollars in 2013. The smallest was 46169.66thousand
US dollars in 2004. The highest rate of trade balance was in 36421.15 thousand US
dollars in 2004, the smallest was 116146.4thousand US dollars in 2008. As it was
shown in our study, the intensity of trade turnover between Ukraine and Canada significantly
decreased since 2008 due to the global financial crisis, but since 2011 the turnover
has increased.
Table 6. The indicators of international trade capacity between Ukraine and Canada
in 2004-2014.
|
Year
|
Export ( thousand US dol. )
|
Import ( thousand US dol. )
|
Balance
|
|
2004
|
82590.81
|
46169.66
|
36421.15
|
|
2005
|
90119.3
|
87015.56
|
3103.74
|
|
2006
|
122452.1
|
98720.1
|
23732
|
|
2007
|
95430.8
|
132134.2
|
-36703.4
|
|
2008
|
144090.4
|
260236.8
|
-116146.4
|
|
2009
|
61634.4
|
136186.5
|
-74552.1
|
|
2010
|
73268.6
|
160204.9
|
-86936.2
|
|
2011
|
122596.9
|
207830
|
-85233.1
|
|
2012
|
107243.9
|
193046.7
|
-85802.8
|
|
2013
|
57441
|
243072.4
|
-185631.3
|
|
2014
|
72565.6
|
191188.4
|
-118622.8
|
The diagram was made by the author according to the source (The State Statistics
Committee of Ukraine).
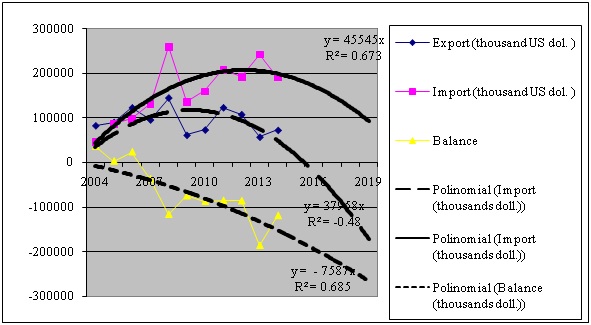
The diagram 6was built on data basis from table 6, where exports, imports and trade
balance between Ukraine and Canada for five years based on regression analysis (polynomial
trend) (Golikov,2009).. Consequently, according to our calculations, the ratio of
exports approximation is R2= -0.489 (R2=0), import is R2=0.673,
trade balance is R2=0.6855. This indicator approximation coefficient
confirms that the probability of the forecast in polynomial trend terms is relatively
average. This trend is the fact that the original data on which the forecast was
made, without large fluctuations. This indicates that trade between Ukraine and
Canada has established character. According to the figure 6, the trade turnover
between Ukraine and Canada today is average. The export is substantially ahead of
imports, this trend is positive for Ukraine. Regression analysis according to the
diagram 6 indicates that the export and import trade balance of Canada and Ukraine
tend to increase. Regression analysis according to the diagram 6 indicates that
to the exports, imports and trade balance of Ukraine and Canada have a tendency
to reduction. If the free trade area between Canada and Ukraine work in full and
the norms of international economic relations, some negative tendencies in trade
turnover will eventually level off with time. According to this forecast exports
may reach for about 1150000 thousand US dollars in 2019, imports can be 590000 thousand
US dollars, trade balance 500000 thousand US dollars.
Diagram 6. The indicators foreign trade capacity between Ukraine and Canada from
2004-2014.
The diagram was made by the author according to the source (The State Statistics
Committee of Ukraine).
The economic modeling of international trade forecast between Ukraine and the EU.
According to the table 7 during the period from 2004 to 2014, the highest export
rate between Ukraine and the EU was 17802443 thousand US dollars in 2011, the smallest
was 9422196.36thousand US dollars in 2005. The highest rate import between Ukraine
and the EU was 28802207.7 thousand US dollars in 2014. The smallest was 9457134.17thousand
US dollars in 2004. The highest rate of trade balance was in 2259872.22014 thousand
US dollars, the smallest was (-11043729.9) thousand US dollars in 2008. As it was
shown in our study, the intensity of trade turnover between Ukraine and the EU significantly
decreased since 2008 due to the global financial crisis, but since 2010 the turnover
has increased.
Table 7. The indicators of international trade capacity between Ukraine and the
EU in 2004-2014.
|
Year
|
Export ( thousand US dol. )
|
Import ( thousand US dol. )
|
Balance
|
|
2004
|
9615554.21
|
9457134.17
|
158420.04
|
|
2005
|
9422196.36
|
12074604.29
|
-2889255.06
|
|
2006
|
10617858
|
16495621.8
|
-2913743.3
|
|
2007
|
12895976.8
|
21706574.1
|
-7438749.8
|
|
2008
|
17758477.7
|
28802207.7
|
-11043729.9
|
|
2009
|
9507286.7
|
15393160,2
|
-5947564.2
|
|
2010
|
12886257.1
|
19010623
|
-6158097.6
|
|
2011
|
17802443
|
25609771.3
|
-7810087.4
|
|
2012
|
16967449.8
|
26078239.3
|
-9169029.7
|
|
2013
|
14482680.3
|
24784780.3
|
-10302099.7
|
|
2014
|
14636426.7
|
14640040.9
|
2259872.2
|
Table compiled by the author according to the source (The State Statistics Committee
of Ukraine).
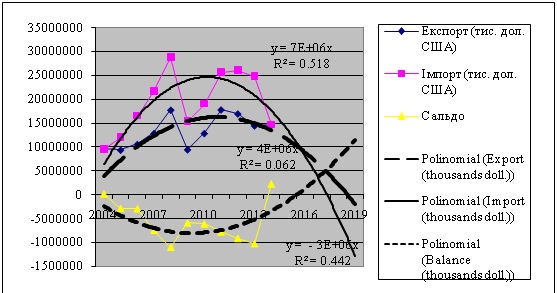
The diagram 7 was built on data basis from table 7, where exports, imports and trade
balance between Ukraine and the EU for five years based on regression analysis (polynomial
trend)(Golikov,2009). Consequently, according to our calculations, the ratio of
exports approximation is R2 = 0.5188, import is R2 = 0.062,
trade balance is R2 = 0.4429. This indicator approximation coefficient
confirms that the probability of the forecast in polynomial trend terms is relatively
average. This trend is the fact that the original data on which the forecast was
made, with fluctuations in 2014. This indicates that trade between Ukraine and the
EU has established character, but there was large decrease of rates in 2014. According
to the figure 7, the trade turnover between Ukraine and the EU today is more prone
to high. The import is substantially ahead of export, this trend is negative for
Ukraine. Regression analysis according to the diagram 7 indicates that the export
and import of the EU and Ukraine tend to decrease. Regression analysis according
to the diagram 7 indicates that to the export, the import of Ukraine and the EU
has a tendency to reduction. A trade balance tends to growth. If the free trade
area between the EU and Ukraine work in full and the norms of international economic
relations, some negative tendencies in trade turnover will eventually level off
with time. According to this forecast exports may reach for about 2000000 thousand
US dollars in 2019, imports can be (-1100000) thousand US dollars, trade balance
1100000 thousand US dollars.
Diagram 7. The indicators foreign trade capacity between Ukraine and the EU from
2004-2014.
Conclusion
Today these integration associations of the EFTA countries, Montenegro, Macedonia
and Ukraine are successful on the one hand, because discrimination on the elimination
of barriers between countries in trade shows the effectiveness of the integration
processes between countries. But we will note, that according to forecasts, which
were compiled using regression analysis (polynomial trend) from 2015 till 2019,
we can conclude that in general, this projected trade turnover within these free
trade areas has negative trends. According to initial data, on basis which was analyzed
international trade in the period from 2004 till2014 among Ukraine and free trade
areas, we can conclude that the biggest trade turnover with Ukraine has the EFTA,
in second place is the free trade area with Macedonia and third place is a free
trade area with Montenegro. We would like to add that according to the polynomial
trend the probability of forecasts is average and generally trade is declining.
It is difficult to predict exact values of exports, imports and trade balance, because
it is not known who will be the future trends in international economic relations
between Ukraine and free trade area, the overall economy countries, fluctuations
in world demand and more. According to the forecasts presented above we can see
that the approximation ratio is the lowest in import. Therefore, the rate of import
Ukraine is very difficult to predict. This is a negative tendency for the Ukraine.
As shown by our study, the most successful areas of free trade with Ukraine in the
future become a free trade area with Israel and the EU by dynamic turnover with
Ukraine in the present time. All the above free trade is important and profitable
for Ukraine, because such unions contribute to the development and deepening of
international economic relations in the future. In our opinion this research is
perspective, because the international economic relations between states are not
staying at the same platform and in need of a better future and the development
of new transformations with new realities of economic relations. International trade
also requires special attention from the side of the state, especially to better
understand the redistribution of resources and effective public policy in the international
economic relations and profit from trade transactions with other countries.
References
Anton Filipenko International Economic Relations – K.: Lybid, 2008. –
401 p.
Arthur Golikov Economic-mathematical modulation world business processes: manual.
guidances. –3rd ed. be refurbished and fulfill. – Kharkiv: Knowledge,
2009. – 222 p.
Arthur Golikov, Olena Dovgal and oth. International Economic Relations: Textbook
/ Ed. A. Golikov, O. Doghal. – Kharkiv: Kharkiv National University Karazin,
2015. – 464 p.
Arthur Golikov, Olena Dovgal and oth. World economy: a textbook / ed. A. Golikov,
O. Dovgal, Kharkiv: V.N. Karazin Kharkiv National University, 2015. – 268
p.
A Basic Guide to Exporting: Government Printing Office, 2009. –
254 p.
Francis FukuyamaPolitical Order and Political Decay From the Industrial Revolution
to the Globalization of Democracy: Straus and Giroux, 2014. – 672 p.
Jacob L. Mosak
General-Equilibrium Theory in International Trade: Principia
Press, 1944. – 193 p.
Marco Mongiello International Financial Reporting: BookBoon, 2009.
– 53 p.
Mukul Sanwal The World's Search for Sustainable Development A Perspective
from the Global South: Cambridge University Press, 2015. – 314 p.
Paul Krugman, Antony J. Venablres Globalization and the inequality of nations: Nber
Working paper series, 1995. – 45 p.
Robert A. Mundell
International Economics:New York Macmillan, 1968. –
325 p.
Steven M. Suranovic International Trade Theory and Policy: internationalecon.com,
2007.
Vladimir Modrak, Peter Knuth, Jozef Novak-Marcinein Advantages and Risks of
RFID in Business Applications.–Volume 4 Issue 1. – International
Business Management, 2010. – 28-34 pp.
The State Statistics Committee of Ukraine [electronic resource]: – access:
http://www.ukrstat.gov.ua/
Ministry of foreign affairs of Ukraine: according to the free trade agreements[electronic
resource]:– access: http://mfa.gov.ua/ua/about-ukraine/economic-cooperation/trade-agreements
Program for forecasts [electronic resource]:– access: http://exponenta.ru/educat/systemat/kapustin/011.asp

