A Refereed Monthly International Journal of Management
THE IMPACT OF WORKING CAPITAL MANAGEMENT ON PROFITABILITY OF PHARMACEUTICAL INDUSTRY
IN INDIA
|
Dr. N.S. PANDEY
Assistant Professor
Email:drnspandey@gmail.com.
|
SUGUMARI
Research Scholar
Email: rgsuguna85@gmail.com
|
Dr. R. AZHAGAIAH
Assistant Professor
PG & Research Department of Commerce
Kanchi Mamunivar Centre for Postgraduate Studies
Puducherry, India
Email: drrazhagaia@yahoo.co.in
|
Abstract
The objective of this paper is to examine the impact of working capital management
(WCM) on profitability (P) of pharmaceutical industry in India. The investigation
is conducted on a panel of 33 firms of the period from 2002-03 to 2011-12 which
listed their shares in Bombay Stock Exchange. The impact of (WCM) on (P) is studied
using measures viz Quick Ratio (QR), Working Capital Turnover Ratio (WCTR), Debtors
Turnover Ratio (DTR), Fixed Assets Turnover Ratio (FATR), Proprietary Ratio (PR),
Current Assets to Proprietor’s Fund (CA_PF), Solvency Ratio (SR), and Return
on Investment (ROI). The study used Multiple Regression Technique besides using
descriptive statistics such as Mean and Standard Deviation. The results of the study
show that there is a significant effect of WCM in respect of selected predictor
variables viz QR, WCTR, DTR, FATR, PR, CA_PF, and SR on P of Pharmaceutical Industry
in India for the study period.
Key words: Pharmaceutical industry, profitability, proprietor’s
fund, returns on investment, working capital management.
JEL Classification: G30, G32
Introduction
WC management (WCM) is very important aspect for every business concern. Management
of WC (WC) is more important and challenging task to the efforts of the finance
manager. This study points out broad WC policy followed by the Pharmaceutical Industry
in India. The study of WCM is major importance both for internal and external analysts
to judge the current position of the Pharmaceutical Industry in India in terms of
profitability (P). The significance of the study is to
analyze the impact of WCM on P of pharmaceutical industry in India.
Efficient management of WC is a fundamental requirement of the overall corporate
strategy in creating the shareholders’ value. Today, management of WC is one
of the most important and challenging aspects of the overall financial management.
Therefore, it is one the foremost duty of every finance manager to minimize the
WC and realize maximum possible revenues resulting in to optimum WC thus, the present
study is a maiden attempt to analyze the impact of WCM on profitability of pharmaceutical
industry in India.
Review of Literature
Merville (1973) stated that WC is divided into permanent and temporary
components. Permanent components are associated with trends in basic demand and
demand as incremented by credit policies are treated as deterministic and cumulative
while temporary components are included periodically and stochastically, hence the
distinction allows for mere explicit consideration of different sources of financing
as the permanent components can be financed by continuing long term or intermediate
term funds. Finally, the corporate management can relate the complex set of credit
and inventory policies in carrying out its short-term planning function.
Vijaya (1977) conducted a study on WCM in six co-operatives and
seven private sector firms in the sugar industry of Tamil Nadu and found that the
growth in current assets (CAs) had registered more sales indicating poor WCM. There
was a negative correlation between return on investment (ROI) and WC; majority of
the investment was in inventory (63.16%) followed by receivables (25.53%). On the
whole the WCM in private sector firms was found to be better than that of the public
sector firms.
Ghosh (1983) studied the existing practices of WC in crane manufacture
industry in India showed that the management of individual components of WC was
erratic. The collection mechanism followed by the sample firms was much unplanned
and the firms took more time than allowed in collecting the cash from the customers;
payments to the suppliers were equally delayed keeping highest portion of payables
pending for more than the allowed period. The study warranted that there was an
immediate need for streamlining the WCM practices. Fazzari (1993)
indicated that investment in WC is excessively sensitive to cash flow fluctuations.
When WC investment is included in fixed investment as a use or source of funds,
it has negative coefficient.
Swamy (1997), who considered 19 primary agricultural societies
in the area of Dakshina Kannada district in Karnataka, revealed that the balancing
of liquidity and profitability was the major problem of WCM in the sample units.
Having been safe in terms of liquidity the sample firms were found to be suffering
from low profitability due to heavy interest burden. The units were found to be
financing their WC requirement through borrowings in the form of deposits. The study
stressed the importance and utmost priority to be given to the effective WCM in
the societies so that they would do well in future.
Dutta (2000) stated on “Working Capital Management of Horticulture
Industry in Himachal Pradesh – A case study of Himachal Pradesh Horticulture
Produce Marketing and Processing Corporation (HPMC)” used data for the period
from 1990-1991 to 1997-1998, analyzed and evaluated WCM by throwing light on financing
pattern of WC. The study revealed that the WC position was worst drastically during
the study period; despite suffering huge losses, the firms were holding huge idle
inventories and hence miserably failed to tradeoff between liquidity and profitability.
The results of the study revealed that there was no significant correlation between
gross WC and sales.
Prasad (2001), who conducted a study on the WCM in paper industry
with a sample of 21 paper mills from large, medium and small scale for the study
period reported that the chief executives recognized properly the role of efficient
use of WC in liquidity and profitability, but in practice they could not achieve
it; 50% of the executives followed budgetary method in planning WC and WCM was inefficient
due to sub-optimum utilization of WC.
Keating and Gates (2002), in their study in Defense
Finance and Accounting Service (DFAS) of Washington analyzed how service-providing
government agencies should set the prices they charge to other governmental customers.
While setting the price, Defense WC Fund (DWCF) was used as the expected average
cost transfer pricing. The study presented an analysis of the costs and performance
of the defense financing and accounting service. The study strongly recommended
simple non-linear pricing structure in pricing the products of one service departments
to another service department; hence study is indicative of sub-optimization.
Mukhopadhyya (2003) analyzed the WC of firms for a period of ten
years i.e. from 1993-1994 to 2002-2003 and observed that the firms have under their
possession huge real estate including land in the most posh locality in Kolkata
and industrial belts across the country. The firms should make trade of between
“Make and Buy”. The core produce / spare-parts etc. can be manufactured
with the assistance of in-house infrastructure and stop going for outright buying
subcontracting so that the work force on the pay roll can be effectively utilized
and at the same time, a full-fledged management accounting system should be installed
for efficient and effective information generation for management, planning and
control purpose. A multi-product engineering firm has been functioning year after
year without having a sound management accounting system under the control and supervision
of a qualified management.
Azhagaiah and Gejalakshmi (2007), who conducted
a study on WCM in textile industry of India during 1995-2006 attempted to measure
the efficiency of WCM in terms of WC ratios i.e. current ratio, liquidity ratio,
inventory ratio and three index values i.e. performance, utilization, and efficiency
indices. They used industry norm as target level of efficiency by an individual
firm and indicated that the Indian textile industry, as a whole, performed remarkably
well during the period and concluded that the liquidity is strong and utilization
of CAs are satisfactory and adoption of sound WCM policy has been successful.
Azhagaiah and Muralidharan (2009) found a positive relationship
between EBIT and the cash conversion cycle (CCC) which was used as a parameter,
therefore it seems that operational EBIT dictates how to manage the WC. The study
concluded that less profitable firms wait longer to pay their bills, taking advantage
of credit period allowed by their suppliers.
Rao et al. (2010), in their study titled “Financial
management focus on working capital utilization in the Indian Cotton Textile Industry:
Methodological analysis” analyzed the trends and patterns of efficiency of
WC utilization in respect of size of firms of cotton textile sector in India on
the application of three indices viz., performance index (PI), utilization index
(UI) and efficiency index (EI). The study revealed that linear growth rate (LGR)
of PI, UI, and EI in respect of WC efficiency for small size firms is significant
while that of the medium size firms, the trend of UI is significant. The trend of
PI, the WCM efficiency of overall firms is found to be not encouraging because the
constant factors are declining, which shows that the fixed components of WC are
more than the varying components of the WC.
Haq et al. (2011) carried out a study using data of 14
firms from cement sector of Pakistan. The study was based on six years’ data
i.e. 2004-2009. They used current ratio (CR), current assets to total assets ratio
(CA_TAR), liquid ratio (LR), inventory turnover ratio (ITR), age of debtors (AOD),
current assets to total sales ratio (CA_TSR) and age of creditors (AOC) as predictors
and return on investment (ROI) as response variable. To produce the results they
used statistical techniques viz. correlation and regression. The study found that
a moderate relationship has been existed between financial performance and WCM.
Singh (2012), in his study on relationship between WCM and profitability
of IT and Telecom Industry in India, selected 11 firms randomly which are listed
on the National Stock Exchange (NSE). It is evident that the WC turnover was poor
during the study period and the industry was not managing its WC efficiently; the
IT and Telecom firms are not very profitable because sales to total assets ratio
was poor in case of IT and Telecom Industry. The IT industry was operating below
average so far as WCM is concerned. The profitability was 40% when compared with
the all India (all) manufacturing average. In the IT and Telecom industry, WC turnover,
current ratio, and sales to total assets ratio were positively related to profitability.
However, days inventory were negatively related to profitability; current ratio
relationship with profitability was a departure from the past studies.
Rakshit and Chatterjee (2012)
examined the WCM practices of the four selected Indian pharmaceutical firms during
the period from 2001 to 2010 and inferred satisfactory performance of the sample
firms with regard to the average performance of their CAs components.
Singh et al. (2013) found that majority of the sample
firms do not seem to have ‘excessive’ investment in WC. In brief, the
investment in WC (as a component of WC management) is commendable.
Scope of the Study
The present paper is an attempt to provide an empirical support to the hypothesized
impact of WCM on profitability of pharmaceutical industry in India.
Pharmaceutical Industry in India
The Indian Pharmaceutical Industry, today, is in the front rank of India’s
science-based industries with wide ranging capabilities in the complex field of
drug manufacture and technology. A highly organized industry, the Indian Pharmaceutical
Industry is estimated to be worth $ 4.5 billion, growing at about eight to nine
per cent annually. It ranks very high in the third world, in terms of technology,
quality and range of medicines manufactured. From simple headache pills to sophisticated
antibiotics and complex cardiac compounds, almost every type of medicine is now
being made indigenously. Playing a key role in promoting and sustaining development
in the vital field of medicines, Indian Pharmaceutical Industry boasts of quality
producers and many units are approved by regulatory authorities in the USA and in
the UK. International firms associated with this industry have stimulated, assisted
and spearheaded the dynamic development in the past five decades and helped to put
India on the pharmaceutical map of the world.
The pharmaceutical industry in India meets around 70 per cent of the country’s
demand for bulk drugs, drug intermediates, pharmaceutical formulations, chemicals,
tablets, capsules, orals and injectable. The Indian pharmaceutical industry ranks
among the top five countries by volume (production) and accounts for about 10 per
cent of global production. Low cost of skilled manpower and innovation are some
of the main factors supporting the growth. The products manufactured by the Indian
pharmaceutical industry can be broadly classified into bulk drugs (active pharmaceutical
ingredients - API) and formulations. Of the total number of pharmaceutical manufacturers,
about 77 per cent produce formulations, while the remaining 23 per cent manufacture
the bulk drugs. Bulk drug is an active constituent with medicinal properties, which
acts as basic raw material for formulations. In India, pharmaceutical manufacturing
firms are largely concentrated in Maharashtra and Gujarat, which account for about
45 per cent of the total number of pharmaceutical manufacturing firms in India.
The study covers only the firms of Pharmaceutical Industry, which are listed in
Bombay Stock Exchange in India. Though many research studies have been undertaken
in the field of WCM, only very few studies are undertaken to study the impact of
WCM on profitability. Therefore, to fill this gap in the literature the present
study has been undertaken considering appropriate finance variables influencing
the WC using appropriate ratios.
Hence, the study proposes to seek answers to the following stated questions.
- Whether the firms utilize promptly the WC for better profitability?
- Whether there is a significant impact of WC management on profitability?
Objectives of the Study
The study is aimed at to analyze and evaluate the WC management of the pharmaceutical
industry in India with a special focus on the following objectives.
- To measure the determinants of profitability and to examine the sensitivity of return
on
investment (ROI) levels of working capital;
- To examine the growth and trend of various measures namely liquidity ratios, turnover
ratios of pharmaceutical industries in India over the period under study; and
- To analyze the impact of working capital management on profitability.
Hypotheses Developed for the Study
- H01: There is no significant impact of quick ratio on profitability.
- H02: There is no significant impact of working capital turnover ratio
on profitability.
- H03: There is no significant impact of debtors’ turnover ratio
on profitability
- H04: There is no significant impact of fixed assets’ turnover ratio
on profitability.
- H05: There is no significant impact of proprietary ratio on profitability.
- H06: There is no significant impact of ratio of current assets to proprietor’s
funds on profitability.
- H07: There is no significant impact of solvency ratio on profitability.
Research Methodology
For the purpose of the study secondary data were collected from Center for Monitoring
Indian Economy Private Limited (CMIE) Prowess Package. The financial statements
like Trading Account, Profit and Loss Account, and Balance Sheet of selected pharmaceutical
firms are used as data base. The sample units for the study have been chosen from
the list of selected Pharmaceutical firms listed on BSE. Average assets of industry
for 129 firms for 10 years have been considered for industry average, which has
been compared with the total assets of each firm. Firms whose average is equal to
or above the industry average have been considered for analysis. Hence, the final
sample constitutes 33 firms.
Data Collection and Period of the Study
The period of the study is 10 years i.e. from 2002-03 to 2011-12. Since the study
is based on financial data, the main source of data was financial statements, such
as balance sheet, trading account, and profit and loss account of listed firms.
Besides, data have also been collected from secondary sources i.e., Annual Reports
of the firms, CMIE prowess database and websites viz. www.moneycontrol.com etc.
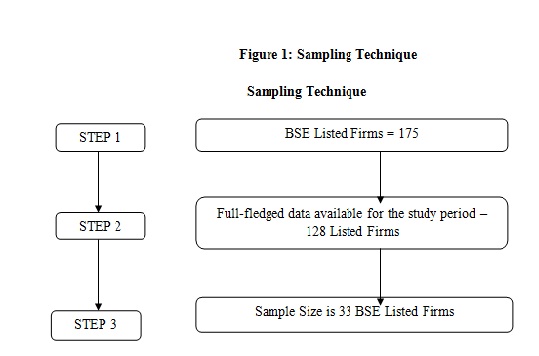
There are 175 Pharmaceutical Firms in India, which have listing flag on Bombay Stock
Exchange (BSE). However, 128 firms only had full-fledged data. Out of 128 firms,
33 firms only are selected for the study on the basis of criteria of > or = to
industry average of total assets over the study period.
The details of the average total assets of the firms of the sector and the industry
average of total assets over the study period is given in table 1.
Table 1
Average total assets of the firms of the sector and the industry average of
total assets of the sector over the study period during 2002-03 - 2011-12
|
S. No.
|
Firm Name
|
Average of Total Assets over 10 years
|
Ind. Avg. of Total Assets over 10 years
|
Sample firm selected based on the criteria > or = the Ind. Avg. of Total Assets
over 10 years period (study period)
|
> or < the Ind. Avg. of Total Assets
|
|
1.
|
ABLBiotechnologiesLtd
|
2.9563
|
66.779
|
|
<
|
|
2.
|
AartiDrugsLtd
|
37.2038
|
66.779
|
|
<
|
|
3.
|
AbbottIndiaLtd
|
52.7015
|
66.779
|
|
<
|
|
4.
|
AdvikLaboratoriesLtd
|
1.9539
|
66.779
|
|
<
|
|
5.
|
AhlconParenteralsIndiaLtd
|
6.0032
|
66.779
|
|
<
|
|
6.
|
AjantaPharmaLtd
|
35.8679
|
66.779
|
|
<
|
|
7.
|
AlbertDavidLtd
|
14.8446
|
66.779
|
|
<
|
|
8.
|
AlembicLtd
|
74.0866
|
66.779
|
1
|
>
|
|
9.
|
AmbalalSarabhaiEnterprisesLtd
|
27.8337
|
66.779
|
|
<
|
|
10.
|
AmrutanjanHealthCareLtd
|
8.2071
|
66.779
|
|
<
|
|
11.
|
AnkurDrugsandPharmaLtd
|
80.4063
|
66.779
|
2
|
>
|
|
12.
|
AnuhPharmaLtd
|
7.7134
|
66.779
|
|
<
|
|
13.
|
ArvindRemediesLtd
|
21.7736
|
66.779
|
|
<
|
|
14.
|
AstrazenecaPharmaIndiaLtd
|
24.7068
|
66.779
|
|
<
|
|
15.
|
AuroLaboratoriesLtd
|
1.3062
|
66.779
|
|
<
|
|
16.
|
AurobindoPharmaLtd
|
352.2941
|
66.779
|
3
|
>
|
|
17.
|
BDHIndustriesLtd
|
3.8172
|
66.779
|
|
<
|
|
18.
|
BalPharmaLtd
|
9.8918
|
66.779
|
|
<
|
|
19.
|
BharatImmunologicals andBiologicalsCorpnLtd
|
4.578
|
66.779
|
|
<
|
|
20.
|
BioconLtd
|
158.9372
|
66.779
|
4
|
>
|
|
21.
|
BlissGVSPharmaLtd
|
9.4341
|
66.779
|
|
<
|
|
22.
|
CadilaHealthcareLtd
|
238.182
|
66.779
|
5
|
>
|
|
23.
|
CaplinPointLaboratoriesLtd
|
4.6519
|
66.779
|
|
<
|
|
24.
|
CiplaLtd
|
550.3953
|
66.779
|
6
|
>
|
|
25.
|
ClarisLifesciencesLtd
|
73.8124
|
66.779
|
7
|
>
|
|
26.
|
ColinzLaboratoriesLtd
|
0.9629
|
66.779
|
|
<
|
|
27.
|
CombatDrugsLtd
|
0.4
|
66.779
|
|
<
|
|
28.
|
CoralLaboratoriesLtd
|
3.2464
|
66.779
|
|
<
|
|
29.
|
DeshRakshakAushdhalayaLtd
|
0.827
|
66.779
|
|
<
|
|
30.
|
DiaminesandChemicalsLtd
|
4.7142
|
66.779
|
|
<
|
|
31.
|
DivisLaboratoriesLtd
|
124.1384
|
66.779
|
8
|
>
|
|
32.
|
DrReddysLaboratoriesLtd
|
631.0003
|
66.779
|
9
|
>
|
|
33.
|
ElderHealthCareLtd
|
5.2578
|
66.779
|
|
<
|
|
34.
|
ElderPharmaceuticalsLtd
|
84.427
|
66.779
|
10
|
>
|
|
35.
|
ElderProjectsLtd
|
2.8969
|
66.779
|
|
<
|
|
36.
|
EmamiLtd
|
66.9922
|
66.779
|
11
|
>
|
|
37.
|
EmmessarBiotechandNutritionLtd
|
0.3925
|
66.779
|
|
<
|
|
38.
|
EverestOrganicsLtd
|
2.7415
|
66.779
|
|
<
|
|
39.
|
FDCLtd
|
49.4188
|
66.779
|
|
<
|
|
40.
|
GennexLaboratoriesLtd
|
2.6072
|
66.779
|
|
<
|
|
41.
|
GlaxosmithklinePharmaceuticalsLtd
|
312.3242
|
66.779
|
12
|
>
|
|
42.
|
GlenmarkPharmaceuticalsLtd
|
186.934
|
66.779
|
13
|
>
|
|
43.
|
GodavariDrugLtd
|
1.7556
|
66.779
|
|
<
|
|
44.
|
GranulesIndiaLtd
|
28.244
|
66.779
|
|
<
|
|
45.
|
GuficBiosciencesLtd
|
5.2926
|
66.779
|
|
<
|
|
46.
|
GujaratThemisBiosynLtd
|
2.7678
|
66.779
|
|
<
|
|
47.
|
HesterBiosciencesLtd
|
5.2646
|
66.779
|
|
<
|
|
48.
|
HiranOrgochemLtd
|
13.915
|
66.779
|
|
<
|
|
49.
|
IndSwiftLaboratoriesLtd
|
89.7949
|
66.779
|
14
|
>
|
|
50.
|
IndocoRemediesLtd
|
37.1726
|
66.779
|
|
<
|
|
51.
|
IpcaLaboratoriesLtd
|
120.5545
|
66.779
|
15
|
>
|
|
52.
|
IshitaDrugsandIndsLtd
|
0.4385
|
66.779
|
|
<
|
|
53.
|
JBChemicalsandPharmaceuticalsLtd
|
68.9148
|
66.779
|
16
|
>
|
|
54.
|
JagsonpalPharmaceuticalsLtd
|
13.295
|
66.779
|
|
<
|
|
55.
|
JenburktPharmaceuticalsLtd
|
2.6201
|
66.779
|
|
<
|
|
56.
|
JubilantLifeScienceLtd
|
347.2878
|
66.779
|
17
|
>
|
|
57.
|
KDLBiotechLtd
|
14.6905
|
66.779
|
|
<
|
|
58.
|
KamronLaboratoriesLtd
|
1.0795
|
66.779
|
|
<
|
|
59.
|
KappacPharmaLtd
|
1.0073
|
66.779
|
|
<
|
|
60.
|
KeralaAyurvedaLtd
|
4.5577
|
66.779
|
|
<
|
|
61.
|
KilitchDrugsIndiaLtd
|
9.062
|
66.779
|
|
<
|
|
62.
|
KopranLtd
|
34.407
|
66.779
|
|
<
|
|
63.
|
KrebsBiochemicalsandIndsLtd
|
19.0788
|
66.779
|
|
<
|
|
64.
|
LincolnPharmaceuticalsLtd
|
8.2702
|
66.779
|
|
<
|
|
65.
|
LupinLtd
|
311.8851
|
66.779
|
18
|
>
|
|
66.
|
LykaLabsLtd
|
19.1863
|
66.779
|
|
<
|
|
67.
|
MakersLaboratoriesLtd
|
2.5465
|
66.779
|
|
<
|
|
68.
|
MangalamDrugsandOrganicsLtd
|
8.0131
|
66.779
|
|
<
|
|
69.
|
MarksansPharmaLtd
|
36.2117
|
66.779
|
|
<
|
|
70.
|
MediCapsLtd
|
4.7307
|
66.779
|
|
<
|
|
71.
|
MedicamenBiotechLtd
|
4.577
|
66.779
|
|
<
|
|
72.
|
MerckLtd
|
46.4374
|
66.779
|
|
<
|
|
73.
|
MorepenLaboratoriesLtd
|
100.48
|
66.779
|
19
|
>
|
|
74.
|
NGLFineChemLtd
|
1.7886
|
66.779
|
|
<
|
|
75.
|
NatcoPharmaLtd
|
44.3082
|
66.779
|
|
<
|
|
76.
|
NaturalCapsulesLtd
|
2.7878
|
66.779
|
|
<
|
|
77.
|
NectarLifesciencesLtd
|
94.1809
|
66.779
|
20
|
>
|
|
78.
|
NeulandLaboratoriesLtd
|
26.7844
|
66.779
|
|
<
|
|
79.
|
NovartisIndiaLtd
|
76.2872
|
66.779
|
21
|
>
|
|
80.
|
NutraplusIndiaLtd
|
1.7869
|
66.779
|
|
<
|
|
81.
|
OrchidChemicalsandPharmaceuticalsLtd
|
292.2358
|
66.779
|
22
|
>
|
|
82.
|
PanaceaBiotecLtd
|
122.8188
|
66.779
|
23
|
>
|
|
83.
|
ParenteralDrugsIndiaLtd
|
32.0856
|
66.779
|
|
<
|
|
84.
|
ParnaxLabLtd
|
137.1685
|
66.779
|
24
|
>
|
|
85.
|
PfizerLtd
|
0.4093
|
66.779
|
|
<
|
|
86.
|
PharmaidsPharmaceuticalsLtd
|
499.1109
|
66.779
|
|
<
|
|
87.
|
PiramalEnterprisesLtd
|
90.7239
|
66.779
|
25
|
>
|
|
88.
|
PlethicoPharmaceuticalsLtd
|
846.5388
|
66.779
|
26
|
>
|
|
89.
|
RanbaxyLaboratoriesLtd
|
2.9234
|
66.779
|
|
<
|
|
90.
|
ResonanceSpecialtiesLtd
|
1.4557
|
66.779
|
|
<
|
|
91.
|
RoopaIndustriesLtd
|
29.9382
|
66.779
|
|
<
|
|
92.
|
SMSPharmaceuticalsLtd
|
1.4214
|
66.779
|
|
<
|
|
93.
|
SamratPharmachemLtd
|
92.9292
|
66.779
|
27
|
>
|
|
94.
|
SanofiIndiaLtd
|
1.8154
|
66.779
|
|
<
|
|
95.
|
SenboIndustriesLtd
|
16.5654
|
66.779
|
|
<
|
|
96.
|
SequentScientificLtd
|
28.4596
|
66.779
|
|
<
|
|
97.
|
SharonBioMedicineLtd
|
44.2696
|
66.779
|
|
<
|
|
98.
|
ShasunPharmaceuticalsLtd
|
15.3027
|
66.779
|
|
<
|
|
99.
|
ShilpaMedicareLtd
|
6.7149
|
66.779
|
|
<
|
|
100.
|
SmruthiOrganicsLtd
|
0.4904
|
66.779
|
|
<
|
|
101.
|
SourceNaturalFoods andHerbalSupplementsLtd
|
5.0534
|
66.779
|
|
<
|
|
102.
|
SpanDiagnosticsLtd
|
155.4879
|
66.779
|
28
|
>
|
|
103.
|
StridesArcolabLtd
|
486.8259
|
66.779
|
29
|
>
|
|
104.
|
SunPharmaceuticalIndsLtd
|
83.9301
|
66.779
|
30
|
>
|
|
105.
|
SuryaPharmaceuticalLtd
|
19.1862
|
66.779
|
|
<
|
|
106.
|
SuvenLifeSciencesLtd
|
6.6556
|
66.779
|
|
<
|
|
107.
|
SyncomFormulationsIndiaLtd
|
18.2474
|
66.779
|
|
<
|
|
108.
|
ThemisMedicareLtd
|
135.3414
|
66.779
|
31
|
>
|
|
109.
|
TorrentPharmaceuticalsLtd
|
0.2283
|
66.779
|
|
<
|
|
110.
|
TriochemProductsLtd
|
23.0326
|
66.779
|
|
<
|
|
111.
|
TwilightLitakaPharmaLtd
|
2.8958
|
66.779
|
|
<
|
|
112.
|
TycheIndustriesLtd
|
59.6181
|
66.779
|
|
<
|
|
113.
|
UnichemLaboratoriesLtd
|
0.5526
|
66.779
|
|
<
|
|
114.
|
UnjhaFormulationsLtd
|
0.3412
|
66.779
|
|
<
|
|
115.
|
VardhamanLaboratoriesLtd
|
0.6047
|
66.779
|
|
<
|
|
116.
|
VenmaxDrugsandPharmaceuticalsLtd
|
22.1713
|
66.779
|
|
<
|
|
117.
|
VenusRemediesLtd
|
1.4814
|
66.779
|
|
<
|
|
118.
|
VikramThermoIndiaLtd
|
12.9639
|
66.779
|
|
<
|
|
119.
|
VimtaLabsLtd
|
1.0954
|
66.779
|
|
<
|
|
120.
|
VistaPharmaceuticalsLtd
|
38.1004
|
66.779
|
|
<
|
|
121.
|
WanburyLtd
|
4.0483
|
66.779
|
|
<
|
|
122.
|
WintacLtd
|
233.6143
|
66.779
|
32
|
>
|
|
123.
|
WockhardtLtd
|
41.3477
|
66.779
|
|
<
|
|
124.
|
WyethLtd
|
0.6542
|
66.779
|
|
<
|
|
125.
|
ZenithHealthCareLtd
|
8.0043
|
66.779
|
|
<
|
|
126.
|
ZenotechLaboratoriesLtd
|
1.2106
|
66.779
|
|
<
|
|
127.
|
ZydenGentecLtd
|
14.8132
|
66.779
|
|
<
|
|
128.
|
Dishman Pharmaceuticals & Chemicals Ltd.
|
78.7132
|
66.779
|
33
|
>
|
|
Total value of Fixed Assets
|
8614.55
|
|
Industry Average of Fixed Assets
|
66.77945
|
The details of the average total assets of the selected firms of the sector compared
with the industry average of total assets over the study period are given in table
2.
Table 2
Average total assets of the selected firms of the sector and the industry average
of total assets of the sector over the study period during 2002-03 - 2011-12
|
S.No.
|
Company Name
|
Average
|
Ind. Avg.
|
STATUS
|
|
1.
|
AlembicLtd
|
74.0866
|
66.779
|
>
|
|
2.
|
AnkurDrugsandPharmaLtd
|
80.4063
|
66.779
|
>
|
|
3.
|
AurobindoPharmaLtd
|
352.2941
|
66.779
|
>
|
|
4.
|
BioconLtd
|
158.9372
|
66.779
|
>
|
|
5.
|
CadilaHealthcareLtd
|
238.182
|
66.779
|
>
|
|
6.
|
CiplaLtd
|
550.3953
|
66.779
|
>
|
|
7.
|
ClarisLifesciencesLtd
|
73.8124
|
66.779
|
>
|
|
8.
|
DivisLaboratoriesLtd
|
124.1384
|
66.779
|
>
|
|
9.
|
DrReddysLaboratoriesLtd
|
631.0003
|
66.779
|
>
|
|
10.
|
ElderPharmaceuticalsLtd
|
84.427
|
66.779
|
>
|
|
11.
|
EmamiLtd
|
66.9922
|
66.779
|
>
|
|
12.
|
GlaxosmithklinePharmaceuticalsLtd
|
312.3242
|
66.779
|
>
|
|
13.
|
GlenmarkPharmaceuticalsLtd
|
186.934
|
66.779
|
>
|
|
14.
|
IndSwiftLaboratoriesLtd
|
89.7949
|
66.779
|
>
|
|
15.
|
IpcaLaboratoriesLtd
|
120.5545
|
66.779
|
>
|
|
16.
|
JBChemicalsandPharmaceuticalsLtd
|
68.9148
|
66.779
|
>
|
|
17.
|
JubilantLifeScienceLtd
|
347.2878
|
66.779
|
>
|
|
18.
|
LupinLtd
|
311.8851
|
66.779
|
>
|
|
19.
|
MorepenLaboratoriesLtd
|
100.48
|
66.779
|
>
|
|
20.
|
NectarLifesciencesLtd
|
94.1809
|
66.779
|
>
|
|
21.
|
NovartisIndiaLtd
|
76.2872
|
66.779
|
>
|
|
22.
|
OrchidChemicalsandPharmaceuticalsLtd
|
292.2358
|
66.779
|
>
|
|
23.
|
PanaceaBiotecLtd
|
122.8188
|
66.779
|
>
|
|
24.
|
ParnaxLabLtd
|
137.1685
|
66.779
|
>
|
|
25.
|
PiramalEnterprisesLtd
|
90.7239
|
66.779
|
>
|
|
26.
|
PlethicoPharmaceuticalsLtd
|
846.5388
|
66.779
|
>
|
|
27.
|
SamratPharmachemLtd
|
92.9292
|
66.779
|
>
|
|
28.
|
SpanDiagnosticsLtd
|
155.4879
|
66.779
|
>
|
|
29.
|
StridesArcolabLtd
|
486.8259
|
66.779
|
>
|
|
30.
|
SunPharmaceuticalIndsLtd
|
83.9301
|
66.779
|
>
|
|
31.
|
ThemisMedicareLtd
|
135.3414
|
66.779
|
>
|
|
32.
|
WintacLtd
|
233.6143
|
66.779
|
>
|
|
33.
|
Dishman Pharmaceuticals & Chemicals Ltd.
|
78.7132
|
66.779
|
>
|
|
|
|
0.6498
|
|
|
|
|
|
8614.55
|
|
|
|
|
|
66.77945
|
|
|
Research Methods
The following tools are used for analyzing the data. Descriptive statistics, such
as mean, standard deviation are used to study the central tendency and consistency
in the time series data. Further, financial ratios and the following statistical
tools are also used for analysis. For assessing the performance and determinants
of WC multiple regression analysis has been used. Besides, to study the behaviour
of data descriptive statistics techniques such as mean and standard deviation are
also used. Further, compound annual growth rate (CAGR) is also used to study the
trend and progress of the financial ratios used for analysis.
Ratio Analysis
The following selected financial ratios relating to WCM are used:
|
a) Quick Ratio (QR)
|
Quick Assets / Quick Liabilities
|
|
b) WC Turnover Ratio (WCTR)
|
Net Sales / Net WC
|
|
c) Debtors’ Turnover Ratio (DTR)
|
Net Sales / Average Debtors
|
|
d) Fixed Assets Turnover Ratio (FATR)
|
Net Sales / Average Fixed Assets
|
|
e) Proprietary Ratio (PR)
|
Shareholders’ Funds / Total Assets
|
|
f) Ratio of CAs to Proprietor’s Funds
|
Current Assets / Shareholders’ Funds
|
|
g) Solvency Ratio
|
Total Liability to Outsiders / Total Assets
|
|
h) Return on Investment (ROI)
|
PAT / Total Assets
|
x̅ = ----------
N
- Standard Deviation (σ) √Σxᵢ²
σ = ------------ - (×̅) ²
N
- Compound Annual Growth Rate (CAGR)
CAGR = (Ending value / Starting value) (1 / No. of Years) -1
ROI is considered as profitability, hence
ROI = b0 + b1QR + b2WCTR + b3DTR + b4FATR
+ b5PR + b6CA_PF + b7SR
Where b0 = constant
Where ROI is return on investment (profitability), QR is quick ratio, WCTR is WC
turnover ratio, DTR is debtors’ turnover ratio, FATR is fixed assets turnover
ratio, PR is proprietary ratio, CA_PF is current assets to proprietor’s fund,
SR is solvency ratio, and b0 is regression constant, b1……b7
are regression coefficients.
Variables
Most of the variables used in the study are based on the existing literature on
WCM. These dependent and independent variables are used to investigate and to test
hypotheses.
|
Response Variable
|
Return on Investment (ROI) = ROA=Profitability
|
|
Predictor Variables
|
Quick Ratio (QR) WC Turnover Ratio (WCTR) Debtors’ Turnover Ratio (DTR) Fixed
Assets Turnover Ratio (FATR) Proprietary Ratio (PR) Current Assets to Proprietor’s
Fund (CA_PF) Solvency Ratio (SR)
|
Industry Analysis and Findings
The descriptive statistics shows that DTR has the highest mean value which indicates
that the firm’s debt collection period varies highly within the industry.
The next highest mean is recorded for WCTR, which shows that the firm has to maintain
sufficient amount of WC. The WCTRs have higher standard deviation, indicating that
the firms have been leveraging their WC at a higher level. FATR also has high standard
deviation but the QR shows a low standard deviation from the mean value, indicating
that there is no much variation in the level of CA _ CL.
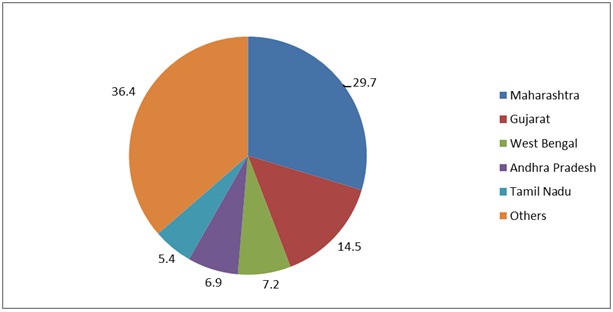
Figure 1 indicates that Maharashtra state has 29.7 per
cent pharmaceutical manufacturing firms in India followed by 14.5 per cent firms
in Gujarat state, West Bengal, Andhra Pradesh, Tamil Nadu and rest of the other
states have 7.2 per cent, 6.9 per cent, 5.4 per cent and 36.4 respectively.
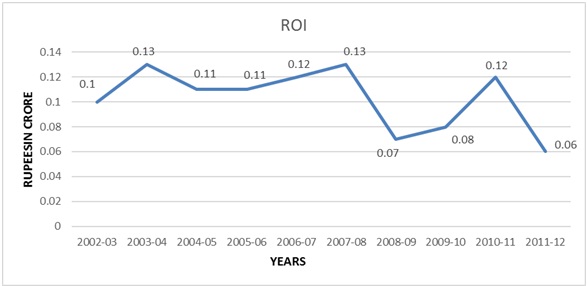
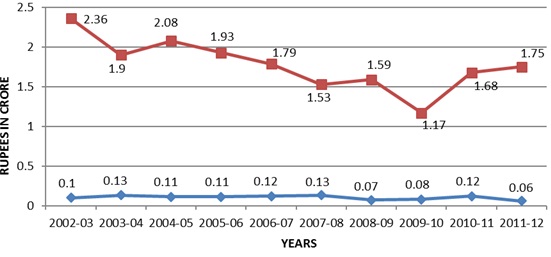
Figure 2 shows that there is a steep fall in profitability
during the year 2008-09; there is a rise in the profitability during the year 2010-11
and afterwards a fall in profitability during the year 2011-12. Although all sample
firms have positive value in the study period there is a deep fall in profitability
during the year 2002-03; however there is a rise in the profitability during the
year 2003-04.
Figure 1
State-wise Pharmaceutical Manufacturing Firms in India (%)
Source: CMIE Prowess Pvt. Ltd.
Figure 2
Trend of Average Profitability of Pharmaceutical Industry over the period under
Study
Source: Computed results based on complied data collected from CMIE prowess Pvt.
Ltd.
Figure 3
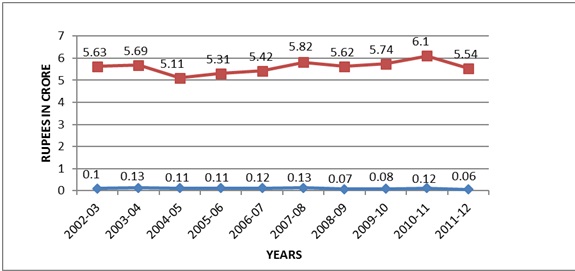
Trend of Average Profitability (ROI) and Quick Ratio of Pharmaceutical Industry
over the Period under Study
Source: Computed results based on complied data collected from CMIE prowess Pvt.
Ltd.
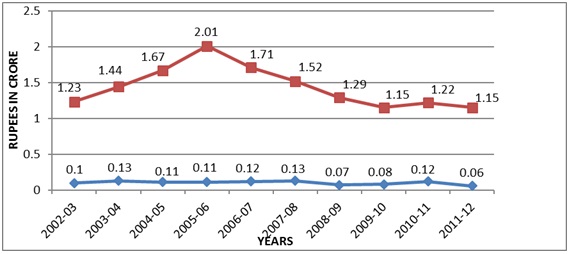
Figure 4
Trend of Average Profitability (ROI) and WC Turnover Ratio of Pharmaceutical
Industry over the Period under Study
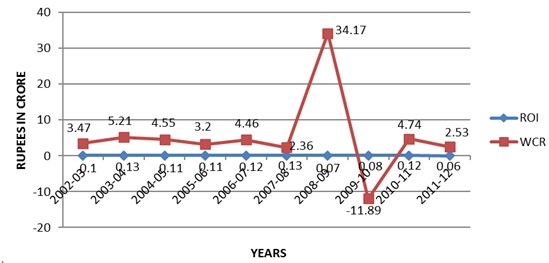
Source: Computed results based on complied data collected from CMIE prowess Pvt.
Ltd.
Figure 3 depicts that the average profitability and quick
ratio has positive relationship. There is a huge rise in quick ratio in the year
2005-06; however there is a slight fall in the year 2009-10. And the profitability
remains more or less constant over the study period. When quick assets increase,
profitability decreases and vice versa. Quick ratio for the year 2005-06 is increased
when the profitability is decreased; however in the subsequent years, the quick
ratio shows a slight decrease and thereafter remains more or less constant while
the average profitability gradually increases in the subsequent years.
Figure 4 shows the WCTR, which reveals that in 2002-03
it increases when there is a slight increase in the profitability; however in the
subsequent years, there is more volatility in WCTR when compared to that of in the
profitability. In the year 2009-10, there is a steep fall in WCTR while the profitability
remains more or less constant in the subsequent years and there is no volatility
in the profitability.
Figure 5
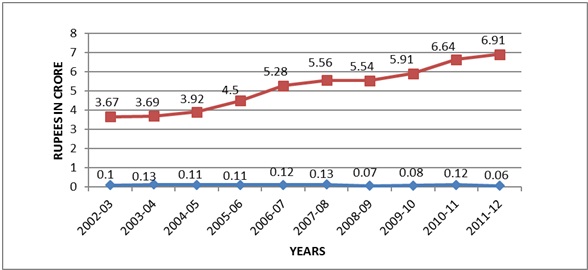
Trend of Average Profitability (ROI) and Debtors Turnover Ratio of Pharmaceutical
Industry over the Period under Study
Source: Computed results based on complied data collected from CMIE prowess Pvt.
Ltd.
Figure 5 indicates that the average profitability and
DTR have positive relationship i.e., when debtors turnover increases, profitability
decreases and vice versa. The DTR shows a gradual fall in the year 2004-05 and shows
an increase in the subsequent years. In 2011-12 the DTR fell while the profitability
decreased in 2002-03 and there is a slight increase in the year 2003-04. However,
the profitability remains more or less constant in the subsequent years and decreased
in the year 2011-12.
Figure 6
Trend of Average Profitability (ROI) and Fixed Asset Turnover Ratio of Pharmaceutical
Industry over the Period under Study
Source: Computed results based on complied data collected from CMIE prowess Pvt.
Ltd.
Figure 7
Trend of Average Profitability (ROI) and Proprietary Ratio of Pharmaceutical
Industry over the Period under Study
Source: Computed results based on complied data collected from CMIE prowess Pvt.
Ltd.
Figure 6 depicts that the average profitability and fixed
assets turnover ratio have positive relationship i.e., when fixed assets turnover
increases, profitability decreases and vice versa. The EATR shows a steep rise in
the year 2007-08 and increases in the subsequent years. In 2008-09 the FATR fell
while the profitability is decreased in the year 2002-03 and there is a slight increase
in the year 2003-04. However, profitability remains more or less constant in the
subsequent years and decreased in the year 2011-12.
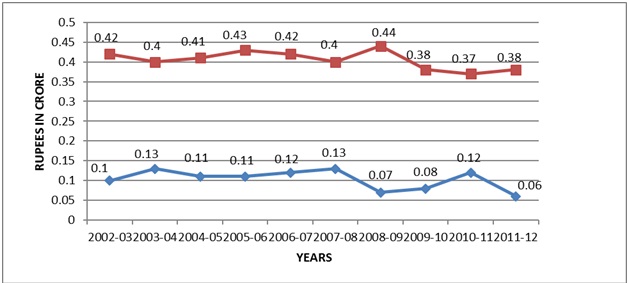
Figure 7 shows that the average profitability and proprietary
ratio have positive relationship. The proprietary ratio shows a steep rise in the
year 2007-08 and decreased in the following years. In 2009-10, the PR shows a rise
and fall in the year 2004-05 while the profitability is decreased in the year 2002-03
and there is a slight increase in the year 2003-04. However, profitability remains
more or less constant in the subsequent years and it is decreased in the year 2011-12.
Figure 8
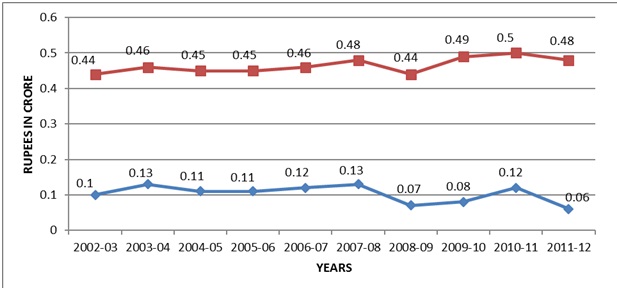
Trend of Average Profitability (ROI) and Ratio of Current Assets to Proprietors’
Funds of Pharmaceutical Industry over the Period under Study
Source: Computed results based on complied data collected from CMIE prowess Pvt.
Ltd.
Figure 8 shows that the average profitability and current
assets to proprietors’ fund ratio have positive relationship. The current
assets to proprietors’ fund ratio shows downfall in the year 2003-04 and it
is decreased in the years 2005-06, 2006-07, and 2007-08 respectively. In 2010-11
and 2011-12 the CA_PF shows a rise. The profitability remains more or less constant
in the subsequent years and it is decreased in the year 2011-12, however, recording
a steep decrease in the year 2008-09.
Figure 9
Trend of Average Profitability (ROI) and Solvency Ratio of Pharmaceutical Industry
over the Period under study
Source: Computed results based on complied data collected from CMIE prowess Pvt.
Ltd.
.
The descriptive statistics of the selected WC ratios of pharmaceutical industry
during 2002-03 - 2011-12 are given in table 3. The table reveals that DTR has the
highest mean value, which indicates that the firm’s debt collection period
varies highly with in the industry. The next most mean is WTCR, which shows that
the firm has to maintain sufficient amount of WC. The WTCRs has the highest standard
deviation, indicating that the firms effectively increasing their WC. FATR has also
higher standard deviation but the QR has low standard deviation from the mean value,
indicating that there is no much variation in the CA _CL.
Table 3
Descriptive Statistics of selected WC Ratios of pharmaceutical industry in India
|
Variables
|
N
|
Minimum
|
Maximum
|
Mean
|
SD
|
|
ROI
|
33
|
0.19
|
7.51
|
3.3912
|
2.20252
|
|
QR
|
33
|
14.21
|
90.59
|
47.458
|
25.0292
|
|
WCTR
|
33
|
-571.12
|
1401.54
|
174.252
|
547.961
|
|
DTR
|
33
|
117.54
|
267.88
|
184.688
|
50.5169
|
|
FATR
|
33
|
78.4
|
282.52
|
170.64
|
70.70
|
|
PR
|
33
|
10.39
|
19.94
|
15.395
|
3.260
|
|
CA_PF
|
33
|
26.26
|
113.72
|
58.705
|
30.119
|
|
SR
|
33
|
8.93
|
18.18
|
13.327
|
3.121
|
Source: Computed results based on complied data collected from CMIE prowess Pvt.
Ltd
Regression Analysis
Table 4 shows the result of regression of the selected WC variables on ROI. It shows
that the QR has a significant coefficient 0.004 on ROI; WTR on ROI (0.004); DTR
on ROI (0.003), FATR on ROI (0.002); PR on ROI (0.003); CA_PF on ROI (0.003) and
SR on ROI (0.005). The overall F statistics (424.92) is significant at 1% level,
which is supported with adjusted R2 0.997. If QR is
increasing then the profitability will also be increasing. If it is decreased then
it is vice versa; there is significant positive coefficient of QR on profitability,
hence H01“there is no significant impact of QR
on profitability” is rejected (0.004) at 1 % level.
WCTR has significant positive coefficient (0.004) on ROI at 1% level, which means
that the firms maintain a larger proportion of net WC when compared to the proportion
of sales. Here, WCTR is below the average sales, hence it is better for the firms
to improve sales. So, the WCTR has significant positive impact on ROI, hence
H02”there is no significant impact of WC turnover
ratio on profitability” is rejected (0.004) at 1% level.
DTR has significant positive coefficient (0.003) on ROI, indicating that there is
a longer period between credit sales and cash collection. Normally higher the DTR
shorter will be the average collection period. Hence, it indicates that the DTR
has lower ratio, which affects the collection period. Therefore, H03:
“there is no significant impact of debtor’s turnover ratio on profitability”
is rejected (0.003) at 1% level.
Table 4
Results of Regression of the selected WC variables on ROI (Profitability) of
Pharmaceutical Industry in India during 2002-03 - 2011-12
|
Variables
|
B
|
‘t’
|
Sig.
|
|
(Constant)
|
-107.292
|
-19.181
|
0.003
|
|
QR
|
0.041
|
15.135
|
0.004
|
|
WCTR
|
0.001
|
15.930
|
0.004
|
|
DTR
|
0.049
|
18.986
|
0.003
|
|
FATR
|
-0.031
|
-24.828
|
0.002
|
|
PR
|
4.571
|
18.467
|
0.003
|
|
CA_PF
|
0.076
|
18.290
|
0.003
|
|
SR
|
2.250
|
14.836
|
0.005
|
|
R2
|
0.999
|
|
Adjusted R2
|
0.997
|
|
F statistics
|
424.925 **(0.001)
|
Source: Computed results based on complied data collected from CMIE prowess Pvt.
Ltd
** Significant at the 0.01 level (2-tailed)
FATR has significant co-efficient (0.002) on ROI, which shows that the fixed assets
are significantly related to profitability. Higher the FATR greater will be the
efficiency in utilization of FAs. The FATR shows the long-term funds are used for
financing fixed assets. If it is less than 1 it shows that part of WC has been financed
by long-term funds hence, H04: “there is no significant
impact of fixed assets’ turnover ratio on profitability” is rejected
(0.002) at 1% level.
Proprietary Ratio has significant positive co-efficient (0.003) on ROI at 1% level.
A low ratio indicates greater risk to the creditors. A ratio of below 5 is alarming
to the creditors, as creditors’ money is more than the assets of the shareholders,
hence H05: “there is no significant impact of
proprietary ratio on profitability” is rejected (0.003) at 1% significant
level.
Current asset to proprietor’s funds has significant positive co-efficient
(0.003) on ROI at 1% level. A low ratio indicates that the industry is in risk.
If current assets to proprietor’s funds are increased, the profitability will
also be increased, hence H06:“there is no significant
impact of current assets to proprietor’s funds on profitability” is
rejected (0.003) at 1% level.
Solvency Ratio has significant positive co-efficient (0.005) on ROI at 1% level.
It shows that the lower ratio of solvency affects the payment to outsiders. If the
solvency ratio is increased then the profitability will also be increased hence
H07: “there is no significant impact of solvency
ratio on profitability” is rejected (0.005) at 1% level.
The overall regression model is fit, which is represented by R2
which is above 50% (0.999), which shows that the explaining variables determine
more than 50% of the change in profitability. The R2
and adjusted R2, at 99.9 per cent and 99.7 per cent
respectively, indicate that the explanatory power of the regression is good. F-
Statistics also shows significant (424.925) impact at 1% level.
Concluding Remarks and Suggestions
In order to examine and evaluate the WC efficiency of the pharmaceutical industry,
the study used 33 listed sample firms from the total of 128 firms listed on BSE.
The most commonly used tools are financial ratios, mean, standard deviation, compound
annual growth rate, and multiple regression analysis.
To sum up, the pharmaceutical industry is strongly recommended to adopt the following
measures for its revival and overcoming WC crisis including operational sickness.
- Identify and locate the idle assets of the firms and dispose of the same at competitive
price in order to meet the present WC needs of the firm.
- On the count, the firm‘s position is not up to the mark. There may be liquidity
problems in the short term. The situation needs careful watch and appropriate steps
should be taken to overcome the position, when need arises.
- In WCTR a higher ratio is the indication of lower investment of WC and more profit.
The firms also should concentrate to boast the profit of the business.
- A high DTR and short collection period convey quick payment on the part of the debtors.
If the turnover is low and the collection period is long, it implies that payment
by debtors is delayed. The firm should concentrate on collecting the payment in
short period.
- A high FATR is dangerous which may lead to liquidity crisis. Hence, the FATR shows
the long-term funds are used for financing fixed assets.
- Strengthen the marketing cell for sale and quick recovery from the debtors; credit
period for debtors should be least and from creditors it should be most so that
the credit float is benefited to a greater extent.
Scope for Further Studies
WCM is an important component of corporate financial management but it has not been
recognized in financial literature unlike capital structure, capital budgeting and
dividend policies. Because of this reason the valid research relating to WCM is
found to be scanty in India. So, there is much to be done about WCM in India, hence
the following is the scope for further studies:
- Further researches may be carried out on the same area with large number of firms
and lengthening the years of the study.
- Further research may also be done with the WC components related to different profitability
variables like Return on Assets (ROA), Return on Capital Employed (ROCE) etc.
- Study may also be concluded in WCM in different sectors with large number of sample
firms.
Limitations of the Study
- The study is based on ten years data only i.e. from 2002-03 to 2011-12. Therefore,
a detailed trend covering a lengthy period is not possible.
- The study is based on secondary data collected from the CMIE (Prowess). Therefore,
the quality of the study depends purely upon the accuracy, reliability and quality
of the secondary data source.
- The study is limited to the firms of Pharmaceutical Industry listed in BSE.
References
- Azhagaiah, R., and S. Gejalakshmi. 2007. Working capital management efficiency in
Textile Industry. Udyog Pragati 31(3) (July-September): 15-20.
- Azhagaiah Ramachandran and Murlidharan Janakiraman. 2009. The relationship between
working capital management efficiency and EBIT. Managing Global Transitions 7 (1):
61-74.
- Dutta. Working capital management in small industries. The Management Accountant.
June, 15 (4): 644-57.
- Fazzari, Steven. 1993. Working capital and fixed investment in evidence financing
constraints. Finance India 27(3): 328-42.
- Ghosh, S. P. 1983. Working capital in crane manufacture – A case study.
The Management Accountant. June: 218-21.
- Ikram Ul Haq, M. Sohail, Zaman, and Z. Alam, 2011. The relationship between working
capital management and profitability: A case study of Cement Industry in Pakistan.
Mediterranean Journal of Social Sciences: 2(2):2039-117.
- Keating, Edward G. and Susan M. Gates. 2000. Working capital fund pricing policies:
Lesson from Defense Finance Accounting Services 6(2): 73-85.
- Kumar, A., Vijaya. 1977. A comparative study of working capital management in co-operatives
and private sector firms in the sugar industry of Tamil Nadu. Unpublished Thesis,
Bharathiar University, Coimbatore:
- Merville, L. J., and L. A. Tavis. 1973 Optimal working capital policies: A chance
constrained programming approaching. The Journal of Finance and Quantitative Analysis
(January) 8(1): 47-59.
- D. 2003. Working capital management in Heavy Engineering firms. The Management
Accountant 10(23): 115.
- Prasad, Navin. 2000. Working capital management in paper industry. The Finance
India 14(2): 32-6.
- Rakshit, Debdas and Chanchal Chatterjee. 2012. An empirical study on working capital
management practices of selected Indian pharmaceuticals firms. The Management Accountant
47 (9): 1065-71.
- Rao, Venkateswara Chinta, Chandra Sekhara Rao and Ramachandran Azhagaiah. 2010.
Financial management focus on working capital utilization in the Indian Cotton Textile
Industry: Methodological Analysis. The Journal of Financial Management
and Analysis 23(2): 63-84.
- Singh, D. P. 2012. Working capital management and profitability in the IT and Telecom
Industry in India. Indian Journal of Finance 6 (3), (March): 54-60.
- Singh, Shveta, P. K. Jain and Surendra S. Yadav. 2013. Working capital management-
Empirical evidence from Indian corporates. The Management Accountant 48(6):
691-706.

