TALENT MANAGEMENT PRACTICES AND EMPLOYEE SATISFACTION: A STUDY OF SELECT CEMENT
INDUSTRIES OF RAJASTHAN
|
Satish Chandra Agarwal
Research Scholar
MewarUniversity ,Chittorgarh (Raj.)
|
Prof.Dr.Rajeev Jain
Dean and Head
Deptt of Commerce and Management
University of Kota, Kota
|
INTRODUCTION
Talent Management is the end-to-end process of planning, recruiting, managing, assessing,
developing maintaining & compensating human resources in an organisation. It
is also called Human Capital Management.
Talent management describes the process through which all organizations anticipate
their human capital needs and set about meeting them.Decisions about talent management
shape the competencies that organizations have and their ultimate success, and from
the perspective of individuals, these decisions determine the path and pace of careers.
IMPORTANCE OF TALENT MANAGEMENT
Talent Management market has surpassed $5bn in year 2014 with a growth rate of 17%
over previous year. The market is expected to surpass $6bn by next year. The importance
of Talent Management can be judged by the fact that 85% of organisations are experiencing
recruitment difficulties, 77% of organisations are experiencing retention problems,
53% of employees leaving job reported greater promotion or development opportunities
outside the company, 60% of HR Directors said they would not re-employ their workforce
and 80% of people leave their managers not their job; according to a study by Bersin&
Associates.
The Employment Policy Foundation, USA estimated the cost of losing staff at around$15,000per
employee. McKinsey found that 75 percent ofcorporate officers wereconcerned about
talent shortages and Deloitte reported that retaining the best talent is atop priority
for 87 percent of surveyed HR directors.
A survey released by ORC Worldwide, a New York-based provider of human resource
management consulting and data services found that 62% top HR executives rated talent
management as most strategic issue, 33% felt that talent management, encompassing
acquisition, assessment, development and retention of a workforce will consume majority
of their time and 7.7% felt that “Cultural Transformation” & “Pay for Performance”
will be their major concern. Among the most important issues ranked by HR executives,
leadership development, succession planning, workforce planning, compensation and
diversity ranked at the top.
TALENT MANAGEMENT FRAMEWORK
Talent Management and Organization Development (TMOD) at Johns Hopkins University
has created an integrated frameworkmodel (Figure 1)which illustrates key talent
management processes that have been designed and developed to ensure that organisations
attract, retain, and engage talented employees.
Key talent management processes include:
· WORKFORCE PLANNING
Workforce Planning involves the intentional and strategic projection and planning
of access to talent,either internal or external with the skills, knowledge, and
behaviours essential for the achievement of the organization’s strategic objectives
and/or demands.Integrated with the business plan, this process establishes workforce
plans, hiring plans, compensation budgets, and hiring targets for the year.
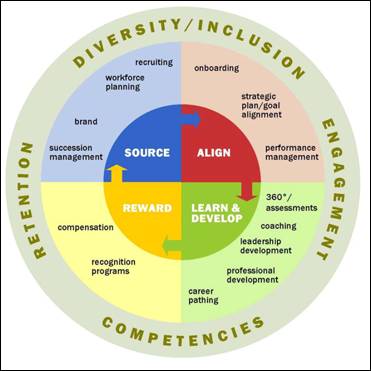
Source: Johns Hopkins University
Fig 1: Talent Management Framework
· ONBOARDING
Onboarding is the process of acclimating new hires and ensuring that they quickly
feel welcomed and valued by their organizations. This process enables a quick integration
of new employees to become productive members of the organization, who understand
expectations for their job roles.
· STRATEGIC PLAN/GOAL ALIGNMENT
Strategic Plan or Goal Alignment is the process of developing and implementing plans
to reach an organization’s long-term goals and objectives. It is the roadmap to
lead an organization from where it is now to where it would like to be in 3-5 years.
· PERFORMANCE MANAGEMENT
Performance Management involves an ongoing, continuous process of communicating
and clarifying job responsibilities, priorities, performance expectations and development
planning that optimize an individual’s performance and align with organizational
strategic goals.
· 360° ASSESSMENTS
360-degree feedback is an assessment tool that provides employees & their leaders
with feedback about their performance. Supervisors, peers, and direct reports answer
questions based on their perceptions and observations of the leader’s skills and
attributes.
· EXECUTIVE COACHING
A helping relationship between a client and a consultant, who uses a wide variety
of behavioural techniques and methods, to assist the client to achieve mutually
identified goals to improve professional performance and personal satisfaction in
an effort to improve the effectiveness of the client’s organization.
· LEADERSHIP DEVELOPMENT
Leadership Development involves intentional goal-driven activities that enhance
the quality of leadership abilities or attitudes within an individual or organization.
· PROFESSIONAL DEVELOPMENT
Professional Development is the process of establishing training goals and plans
that link to individual goal attainment, career planning, and possible succession
planning.
· CAREER PATHING/CAREER DEVELOPMENT
Career Pathing or Development involves how the organization structures the career
progress of their members, and the individual’s process for identifying job opportunities
within an organization’s structure, and the sequential steps in education, skills,
and experience-building needed to attain specific career goals.
· RECOGNITION PROGRAMS
Recognition Programs include method of acknowledging, honouring, encouraging, and
supporting individuals and teams who contribute, through behaviours and actions,
to the success of the organization.
· COMPENSATION
Compensation is a way to reward individuals for important work accomplishments,
contributions to the goals of the organisation and increased skills & competencies
in their jobs.
· SUCCESSION MANAGEMENT
Succession management is a process for identifying and developing internal personnel
with the potential to fill key or critical organizational positions. Succession
management ensures the availability of experienced and capable employees that are
prepared to assume these roles as they become available. This function must be aligned
with the business plan to understand and meet requirements for key positions 3-5
years out.
· BRAND
A career is much more than a job. The organization should be a recognized leader
in its business, customer relations and research, and should be a great place to
both develop professionally and make a difference.
· DIVERSITY/INCLUSION
Diversity represents a group comprised of individuals with similar and different
experiences and backgrounds. Some of these differences include race, colour, religion,
gender, national origin, sexual orientation, age, disability, veteran status, and
ethnicity, but there are many other dimensions of diversity. “Diversity” does not
address how people with different backgrounds and experiences function or work together.
“Inclusion” is a sense of belonging: feeling respected, valued for who you are;
feeling a level of supportive energy and commitment from others so than you can
do your best work.
· ENGAGEMENT
The extent to which employees are committed to their organization’s goals and values,
motivated to contribute to organizational success, and are able at the same time
to enhance their own sense of well-being is a measure of engagement with the organization.
· COMPETENCIES
Competencies are those measurable behaviours, characteristics, abilities and personality
traits that identify successful employees against defined roles within an organization.
· RETENTION
A systematic effort focused not only on retaining an organization’s talented performers
but also to create and foster a welcoming work environment and high-retention culture.
The end result is an organization that operates more effectively and efficiently,
while becoming a great place to work.
BENEFITS OF TALENT MANAGEMENT
Efficient Talent Management Practices in an organization can bring wide range of
benefits contributing to its success and competitive advantage. The range of benefits
may include:
· Right Person in the right Job: Through a proper assessment of employee
skills and strengths allows the organization can have stock of skill inventories
it possesses. This assessment can be used for competency mapping by the organization
resulting in deployment of right person in the right position and increasing employee
productivity. Also it increases alignment between an individual’s interests and
his job profile therebyincreasing the job satisfaction.
· Retaining the top talent: Despite changes in the global economy, attrition
remains a major concern of organizations. Retaining top talent is important to leadership
and growth in the marketplace. Organisations that fail to retain their top talent
are at the risk of losing out to competitors. The focus is now on charting employee
retention programs and strategies to recruit, develop, retain and engage quality
people. Employee growth in a career has to be taken care of, while succession planning
is being performed for those who are on the radar need to be kept in loop so that
they know their performance is being rewarded.
· Better Hiring: The quality of an organization is the quality of workforce
it possesses. The best way to have talent at the top is to have talent at the bottom.
Thus, talent management programs, trainings and hiring assessments have become an
integral aspect of HR processes nowadays.
· Understanding Employees Better: Employee assessments give management deep
insights about their employees, viz. their development needs, career aspirations,
strengths and weaknesses, abilities, likes and dislikes. It is easier therefore
to determine what motivates whom and this helps a lot in Job enrichment process.
· Better professional development decisions: When an organization knowsabout
its high potential employees, it becomes easier to invest in their professional
development. An organization remains bothered since employee development calls for
investment decisions towards learning, training and development of the individual
either for growth, succession planning, performance management, etc. and talent
management just make this easier for them.
· Succession Planning: Empl oyee Assessments & Competency Mapping can
also be utilized for mapping people against the future initiatives of the company
and for succession planning.
Apart from these, other benefits include:
· Predictability of performance
· Higher customer satisfaction rates
· Lower employee turn-over
· Increased profits as a result of right people/right time
· Increased revenue as a result of efficiencies
· Increased employee engagement
· Assurance of stable management team today and in future
RATIONALE OF THE STUDY
Talent Management is one of the most crucial challenges that the organizations are
facing in the coming years. The shortage of talent supply; recruitment difficulties;
orientation, training & development programmes; performance appraisal &
rewards, retention issues and succession planning are making the task tougher. But,
lack of proper talent management practices will result in attrition, i.e. loss of
talent and the organizations will their competitive advantage. Shifting of talent
is not only a financial loss, recruitment, orientation & training costs incurred
by the organization, but also loss of information and knowledge transfer which is
a major loss in terms of competitive strength of the organization.
OBJECTIVES OF THE STUDY
· To analyse the satisfaction level of employees with talent management practices
implemented in their organizations.
· To analyse the impact of different parameters on level of employee satisfaction
with talent management practices.
RESEARCH METHODOLGY
The study is intended to analyse the executive employee perception and satisfaction
regarding the talent management practices in their organizations and will help to
control attrition by identifying the lacunas in the talent management system in
the organization.
The study will involve a questionnaire survey of executives of 5 selected cement
plants in Rajasthan, viz., Ambuja Cement Ltd., Rabariawas, Pali; Birla Cement Works,
Chanderiya, Chittorgarh; J.K. Cement Works, Nimbahera, Chittorgarh; UltraTech Cement,
Shambhupura, Chittorgarh and Wonder Cement, NimbaheraChittorgarh.
For the study, a questionnaire has been prepared. The questionnaireis divided in
two parts. First part consists of demographic details, viz. age, experience, designation,
organization and no. of years working in present organization. The second part of
questionnaires consists of 20 Likert scale based questions relating to talent management
practices in the organization. The questions are divided into four categories: Compensation
& Benefits, Growth & Learning Opportunity, Organisation Culture & Policy
and Interpersonal Relationship.
A sample of 150 executives, 30 from each cement plant have been considered for the
study on the basis of convenience sampling. The sample size of 150 has been chosen
considering the limitations of resources.
HYPOTHESES FOR THE STUDY
H01: There is no significant relationship between the age of the employees
and their satisfaction with the practices of talent management.
H02: There is no significant relationship between the experience of the
employees and their satisfaction with the practices of talent management.
H03: There is no significant relationship between the satisfaction levels
of employees in various organizations with the practices of talent management.
H04: There is no significant difference in the impact of different parameters
on the level of employees' satisfaction with the practices of talent management
in the organization.
DATA ANALYSIS AND INTERPRETATION
The questionnaires were sent to 150 executives, 50 in each of the selected cement
industry, of which 133 filled questionnaires were received. Of these, 10 were rejected
for incomplete information and the remaining 123 responses have been tabulated and
analysed. The data collected showed that most of the executives are satisfied with
the talent management practices in their organizations.
HYPOTHESIS I
H01: There is no significant relationship between the age of the employees
and their satisfaction with the practices of talent management.
For testing the first hypothesis, Chi - square test has been conducted to extend
the relationship between the age of the employees and level of satisfaction regarding
thepractices of talent management.The age of the employees has been divided into
four categories; viz. from 20 - 29 years, 30 - 39 years, 40 - 49 years and 50 years
& above. Table 1 & 2 show the observed and the expected values, table 3
shows the calculation of chi-square and Table 4 shows the comparison of chi-calculated
and chi-tabulated at 3 degrees of freedom.
Table 1: Table of Observed Values with Age
|
Age/Scores
|
High Score
|
Average Score
|
Total
|
|
20-29
|
27
|
0
|
27
|
|
30-39
|
38
|
1
|
39
|
|
40-49
|
35
|
1
|
36
|
|
50& above
|
20
|
1
|
21
|
|
|
120
|
3
|
123
|
Table 2: Table of Expected Values with Age
|
Age/Scores
|
High Score
|
Average Score
|
Total
|
|
20-29
|
26.34
|
0.66
|
27
|
|
30-39
|
38.05
|
0.95
|
39
|
|
40-49
|
35.12
|
0.88
|
36
|
|
50& above
|
20.49
|
0.51
|
21
|
|
|
120
|
3
|
123
|
Table 3: Calculation for Chi-Square Values
|
Observed
|
Expected
|
O-E
|
(O-E)2
|
(O-E)2/E
|
|
27
|
26.34
|
0.66
|
0.43367
|
0.01646341
|
|
38
|
38.05
|
-0.05
|
0.00238
|
0.00006254
|
|
35
|
35.12
|
-0.12
|
0.01487
|
0.00042344
|
|
20
|
20.49
|
-0.49
|
0.23795
|
0.01161440
|
|
0
|
0.66
|
-0.66
|
0.43367
|
0.65853659
|
|
1
|
0.95
|
0.05
|
0.00238
|
0.00250156
|
|
1
|
0.88
|
0.12
|
0.01487
|
0.01693767
|
|
1
|
0.51
|
0.49
|
0.23795
|
0.46457607
|
|
Total
|
1.17111569
|
Table 4: Chi-Square Values
|
Degree of significance
|
0.05
|
|
Degree of Freedom
|
3
|
|
Chi calculated
|
1.17
|
|
Chi tabulated
|
7.81
|
Degree of freedom = (R - 1) X (C - 1) = (4 - 1) X (2 - 1) = 3 X 1 = 3
Table value = 7.81
Calculated value = 1.17
Interpretation
Since the calculated value is smaller than the table value,so the null hypothesis
is accepted. Hence, there is no significantrelationship between the age of the employees
and their satisfaction with the practices of talent management or age of employees
is independent from satisfaction with the practices of talent management.
HYPOTHESIS II
H02: There is no significant relationship between the experience of the
employees and their satisfaction with the practices oftalent management.
For testing the second hypothesis, Chi - square test has been conducted to extend
the relationship between the experience of the employees and level of satisfaction
regarding thepractices of talent management. The experience of the employees has
been divided into four categories; viz. from 0 - 9 years, 10 - 19 years, 20 - 29
years and 30 years & above. Table 5 and 6 show the observed and the expected
values, table 7 shows the calculation of chi-square and Table 8 shows the comparison
of chi-calculated and chi-tabulated at 3 degrees of freedom.
Table 5: Table of Observed Values with Experience
|
Experience/Scores
|
High Score
|
Average Score
|
Total
|
|
0-9
|
43
|
2
|
45
|
|
10-19
|
41
|
0
|
41
|
|
20-29
|
24
|
0
|
24
|
|
30 & above
|
12
|
1
|
13
|
|
|
120
|
3
|
123
|
Table 6: Table of Expected Values with Experience
|
Experience/Scores
|
High Score
|
Average Score
|
Total
|
|
0-9
|
43.90
|
1.10
|
45
|
|
10-19
|
40.00
|
1.00
|
41
|
|
20-29
|
23.41
|
0.59
|
24
|
|
30 & above
|
12.68
|
0.32
|
13
|
|
|
120
|
3
|
123
|
Table 7: Calculation for Chi-Square Values
|
Observed
|
Expected
|
O-E
|
(O-E)2
|
(O-E)2/E
|
|
43
|
43.90
|
-0.90
|
0.81440
|
0.01855014
|
|
41
|
40.00
|
1.00
|
1.00000
|
0.02500000
|
|
24
|
23.41
|
0.59
|
0.34265
|
0.01463415
|
|
12
|
12.68
|
-0.68
|
0.46639
|
0.03677298
|
|
2
|
1.10
|
0.90
|
0.81440
|
0.74200542
|
|
0
|
1.00
|
-1.00
|
1.00000
|
1.00000000
|
|
0
|
0.59
|
-0.59
|
0.34265
|
0.58536585
|
|
1
|
0.32
|
0.68
|
0.46639
|
1.47091932
|
|
Total
|
3.89324786
|
Table 8: Chi-Square Values
|
Degree of significance
|
0.05
|
|
Degree of Freedom
|
3
|
|
Chi calculated
|
3.89
|
|
Chi tabulated
|
7.81
|
Degree of freedom = (R - 1) X (C - 1) = (4 - 1) X (2 - 1) = 3 X 1 = 3
Table value = 7.81
Calculated value = 3.89
Interpretation
Since the calculated value is smaller than the table value. So the null hypothesis
is accepted. Hence, there is no significant relationship between the experience
of the employees and theirsatisfaction with the practices of talent management or
the satisfactionwith the practices of talent management does not differ with experience
of employees.
HYPOTHESIS III
H03: There is no significant relationship between the satisfaction levels
of employees of various organizations with the practices oftalent management.
For testing the third hypothesis, Chi - square test is conducted to extend the relationship
between the employees of various organizations and level of satisfactionregarding
the practices of talent management. The respondents have been classified on the
basis of organizations they are working in, at present. The respondents are from
the five selected cement industries, viz. Ambuja Cements Ltd. (ACL), Binani Cement
Works (BCW), J. K. Cement Ltd. (JK), Ultra Tech Cement Ltd. (UT) and Wonder Cement
Ltd. (WCL). Table 9 and 10 show the observed and the expected values, table 11 shows
the calculation of chi-square and Table 12 shows the comparison of chi-calculated
and chi-tabulated at 4 degrees of freedom.
Table 9: Table of Observed Values with Organisation
|
Age/Scores
|
High Score
|
Average Score
|
Total
|
|
ACL
|
23
|
0
|
23
|
|
BCW
|
22
|
2
|
24
|
|
JK
|
27
|
1
|
28
|
|
UT
|
29
|
0
|
29
|
|
WCL
|
19
|
0
|
19
|
|
|
120
|
3
|
123
|
Table 10: Table of Expected Values with Organisation
|
Age/Scores
|
High Score
|
Average Score
|
Total
|
|
ACL
|
22.44
|
0.56
|
23
|
|
BCW
|
23.41
|
0.59
|
24
|
|
JK
|
27.32
|
0.68
|
28
|
|
UT
|
28.29
|
0.71
|
29
|
|
WCL
|
18.54
|
0.46
|
19
|
|
|
120
|
3
|
123
|
Table 11: Calculation for Chi-Square Values
|
Observed
|
Expected
|
O-E
|
(O-E)2
|
(O-E)2/E
|
|
23
|
22.44
|
0.56
|
0.31469
|
0.01402439
|
|
22
|
23.41
|
-1.41
|
2.00119
|
0.08546748
|
|
27
|
27.32
|
-0.32
|
0.10054
|
0.00368031
|
|
29
|
28.29
|
0.71
|
0.50030
|
0.01768293
|
|
19
|
18.54
|
0.46
|
0.21475
|
0.01158537
|
|
0
|
0.56
|
-0.56
|
0.31469
|
0.56097561
|
|
2
|
0.59
|
1.41
|
2.00119
|
3.41869919
|
|
1
|
0.68
|
0.32
|
0.10054
|
0.14721254
|
|
0
|
0.71
|
-0.71
|
0.50030
|
0.70731707
|
|
0
|
0.46
|
-0.46
|
0.21475
|
0.46341463
|
|
Total
|
5.43005952
|
Table 12: Chi-Square Values
|
Degree of significance
|
0.05
|
|
Degree of Freedom
|
4
|
|
Chi calculated
|
5.43
|
|
Chi tabulated
|
9.49
|
Degree of freedom = (R - 1) X (C - 1) = (5 - 1) X (2 - 1) = 4 X 1 = 4
Table value = 9.49
Calculated value = 5.43
Interpretation
Since the calculated value is smaller than the table value. So the null hypothesis
is accepted. Hence, there is no significant relationship between employees in various
organizations and theirsatisfaction with the practices of talent management or employees
of various organizations have same satisfaction levels with the practices of talent
management.
HYPOTHEIS IV
H04: There is no significant difference in the impact of different parameters
on the level of employee satisfaction with the practices of talent management in
the organization.
For the fourth hypothesis, ANOVA has been used to analyse the impact of different
parameters on the level of employee satisfaction with the talent management practices
in the organization. ANOVA helps to analyse whether there is significant variation
in the given samples (more than two) for the parameters being tested.
For this purpose, the 20 questions have segregated into 4 different groups:
Compensation & Benefits – X1
Growth & Learning Opportunity – X2
Organisation Culture & Policy – X3
Interpersonal Relationship – X4
Table 13 represents the average score of all the executive respondents for the five
questions in each of the four groups. Table 14 represents the total, average and
variance of the responses in each of the four groups. Table 15 represents the sum
of squares, degrees of freedom and mean square score between and within the groups,
the calculated F-score, p-value and the F-critical values.
Table 13: Average & Total Score for each of 5 questions in the four groups
|
|
X1
|
X2
|
X3
|
X4
|
|
1
|
4.23
|
4.25
|
4.45
|
4.18
|
|
2
|
4.14
|
4.31
|
4.16
|
4.40
|
|
3
|
4.51
|
4.29
|
4.29
|
4.30
|
|
4
|
4.28
|
4.31
|
4.17
|
4.23
|
|
5
|
4.40
|
4.35
|
4.46
|
4.23
|
|
Total
|
21.56
|
21.51
|
21.53
|
21.34
|
Table 14: Total, Average and Variance in the four groups
|
Groups
|
Count
|
Sum
|
Average
|
Variance
|
|
X1
|
5
|
21.56
|
4.312
|
0.02107
|
|
X2
|
5
|
21.51
|
4.302
|
0.00132
|
|
X3
|
5
|
21.53
|
4.306
|
0.02113
|
|
X4
|
5
|
21.34
|
4.268
|
0.00727
|
Table 15: ANOVA Calculations
|
Source of Variation
|
SS
|
df
|
MS
|
F
|
F critical
|
|
Between Groups
|
0.001172
|
3
|
0.000391
|
0.030767
|
3.24
|
|
Within Groups
|
0.203160
|
16
|
0.012698
|
Interpretation
We observe that the calculated F value (0.30767) is less than the F critical value
(3.24) at the respective degrees of freedom and 5% level of significance. Thus,
the null hypothesis is accepted, i.e., there is no significant difference in the
impact of different parameters upon the level of employees' satisfaction with the
practices of talent management in the organization.
CONCLUSION
The study indicates that all the executives are satisfied with the talent management
practices in their organisation as most of the responses received were in strongly
agree and agree categories. This was also evident from the fact that many employees
have been working in the present organisations for long periods with a large number
having worked in one single organisation since the beginning of the career never
switching the job.
The analysis clearly shows that there is no difference in the satisfaction level
of employees among different age groups, experience and organizations. All the executives
are highly satisfied with the talent management practices in their organizations.
The analysis also indicated that there was no difference in the impact of the four
parameters on the satisfaction level of employees with talent management practices
in their organizations.

