An Empirical Study of Impact of Demographic Variables on Quality of Work Life among
Insurance sector employees in Indore Division
|
Dr. Barkha Gupta
Faculty
Shri RGP Gujarati Professional Institute
Scheme No.54, Indore (MP)
|
Abstract
Quality of work life (QWL) is one of the major parts for the employees’ motivation
in organizations. People can deliver their best potential if the QWL is improved
and satisfactory. The concept of Quality of Work Life deals
with the issue of how rewarding or satisfying the time spent in the workplace is.
As such, Quality of Work Life may reflect working conditions and contextual issues
such as relationships with work colleagues and the intrinsic satisfaction of the
job itself. Growth of Insurance sector is expected to be US$
350-400 by 2020 and it is also expected that Indian Insurance market will reach
the top 3 insurance market in the world. To achieve those insurance companies must
have to reduce the attrition rate, which is very high in present conditions.
This research study attempted to find out the impact of age, income, gender and
experience on Quality of Work Life of Insurance sector employees.
Data was collected from 151 Insurance sector employees of Indore city.
T-test and One way Anova was used for data analysis.
Keywords- Quality of work life,
Insurance sector employees, Gender, Experience, Age, Income.
Introduction
Quality of work life (QWL):
The Quality of Work Life is the result of an evaluation that each individual carries
out comparing his own hopes, expectations and desires with what he considers as
reality. Quality of Work Life is basically the Quality of life that an employee
experiences at his work place. Unless good Quality of Work Life is provided to an
employee, he cannot be motivated towards work. Quality of Work Life covers all aspects
of employee’s work life like economic, social, psychological and organizational.
Quality of work life is a multifaceted concept. The premise of quality of work life
is having a work environment where employees’ activities become more important.
Cunningham, J.B. and T. Eberle, (1990) described that, the
elements that are relevant to an individual’s Quality of Work Life include the task,
the physical work environment, social environment within the organization, administrative
system and relationship between life on and off the job. Chan, C.H. and W.O. Einstein,
(1990) pointed out Quality of Work Life reflects a concern for people’s
experience at work, their relationship with other people, their work setting and
their effectiveness on the job . European Foundation for the Improvement of Living
Conditions (2002) described that the Quality of Work Life is a multi-dimensional
construct, made up of a number of interrelated factors that need careful consideration
to conceptualize and measure. It is associated with job satisfaction, job involvement,
motivation, productivity, health, safety, job security, competence development and
balance between work and non-work life.
From this perspective, there has stemmed the notion of organizational responsibility
and specifically of management, to ensure that employees who commit themselves fully
to achieving the organization’s objectives should also experience a high Quality
of Work Life (Kotze 2005). Besides, an employee who feels a great deal of
work related well being and little job distress is apt to have a good Quality of
Work Life (QWL), and vice versa (Riggio 1990). Indeed, QWL is a process by
which an organization responds to employee need by developing mechanisms to allow
members to share fully in making decisions that design their lives at work (Robbins
1998). Subsequently, organizations cognizant of issues surrounding the concept
quality of work life appear to be more effective at retaining their employees and
achieving their goals (Louis & Smith 1990).
Review of literature
Various authors and researchers have proposed models of Quality of Working Life
which include a wide range of factors. Baba and Jamal
(1991) listed factors what they described as typical indicators of Quality
of Working Life, including: job satisfaction, job involvement, work role ambiguity,
work role conflict, work role overload, job stress, organizational commitment and
turn-over intentions. They also explored reutilization of job content, suggesting
that this facet should be investigated as part of the concept of Quality of Working
Life. Rao (1992) contended that those factors which influence the
importance of a particular need to an individual and those, which satisfy or frustrate
the need determine Quality of Work Life. The Quality Work of Life is determined
by interactions of personal and situational factors. The factors that influence
and decide the Quality of Work Life are: Attitude, Environment, Opportunities, Nature
of the job, People, Stress level, Career prospects, Challenges, Growth and development,
Risk involved and reward.
According to Balu (2001), Quality of Work Life encompasses various aspects
relating to (1) Working Environment and (2) Employee Motivation. Employee Motivation
consists of (i) Proper Communication at Shop-level, (ii) Employee Facilities, (iii)
Employee Performance Recognition, (iv) Employee participation with team spirit,
(v) Development and Job redesign and Job enrichment, (vi) Dynamic HRD factors, and
(vii) Status of family. Arts et al. (2001) focused on the following factors:
job satisfaction, involvement in work performance, motivation, efficiency, productivity,
health, safety and welfare at work, stress, work load, burn-out etc. According to
Royuela et al. (2007), European Commission (EC) proposed ten dimensions
for QWL, which are (1) intrinsic job quality, (2) skills, life-long learning and
career development, (3) gender equality (4) health and safety at work, (5) flexibility
and security, (6) inclusion and access to the labor market, (7) work organization
and work-life balance, (8) social dialogue and worker involvement, (9) diversity
and non-discrimination, and (10) overall work performance.
Ellis and Pompli (2002) identified a number of factors contributing
to job dissatisfaction and Quality of Work Life, including: Poor working environments,
Resident aggression, Workload, inability to deliver quality of care preferred, Balance
of work and family, Shift work, Lack of involvement in decision making, Professional
isolation, Lack of recognition, Poor relationships with supervisor/peers, Role conflict,
Lack of opportunity to learn new skill. Warr and colleagues (1979), in an
investigation of Quality of Working life, considered a range of apparently relevant
factors, including: work involvement, intrinsic job motivation, higher order need
strength, perceived intrinsic job characteristics, job satisfaction, life satisfaction,
happiness, and Self-rated anxiety. They discussed a range of correlations derived
from their work, such as those between work involvement and job satisfaction, intrinsic
job motivation and job satisfaction, and perceived intrinsic job characteristics
and job satisfaction.
1. Objectives of the study:
· To study the Quality of work life with
respect to gender among Insurance sector employees.
· To study the Quality of work life with
respect to experience among Insurance sector employees.
· To study the Quality of work life with
respect to age among Insurance sector employees.
· To study the Quality of work life with
respect to income among Insurance sector employees
2. Hypotheses:
H01: There is no significant difference in Quality
of work life with respect to gender among Insurance sector employees.
H02 There is no significant difference in Quality
of work life with respect to experience among Insurance sector employees.
H03: There is no significant difference of Quality
of work life with respect to age among Insurance sector employees.
H04: There is no significant difference of Quality
of work life with respect to income among Insurance sector employees.
Research Methodology
This research is descriptive in nature. Employees of Insurance sector
of Indore City (n=151) were selected the sample of this study. For data
collection purposes, Scale of QWL has been used, which was developed by
Dhar, S. et at. (2006).This scale has been widely used in various researches of
social science and well accepted to assess QWL of employees of various sectors.
The questionnaire was divided in two parts. The first part of the questionnaire
included questions about demographic profile of the respondents. Second part of
the questionnaire included questions/variables related with dimensions of QWL. All
the variables were required to be marked on likert scale in the range of 1 – 5,
where 1 represented strongly disagree and 5 represented strongly agree.
Reliability and Validity of the scale is 0.89 and 0.94 respectively.
A convenient sampling technique was adapted for the research.
Data was collected from 151 respondents during Jan –April 2014. Initially 180
questionnaires were distributed Out of the same, 167 questionnaires were received
back and 151questionnaire were finally considered for data analysis. After collecting
the data, the raw scores are tabulated and analyzed through appropriate statistics
tools with the help of SPSS, t-test One way Anova was used
to test the hypothesis.
Results and Discussion
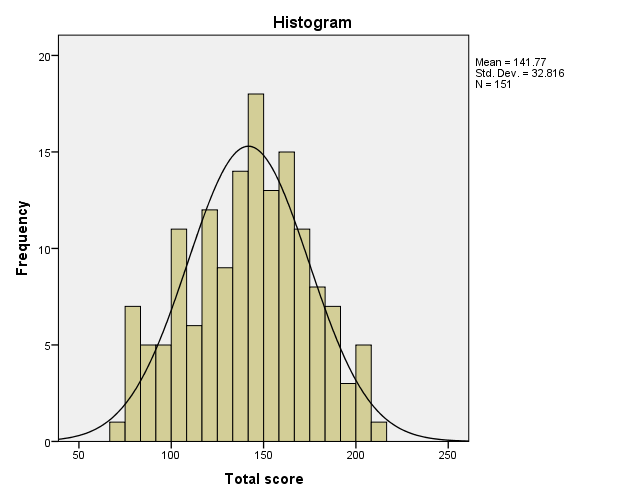
The Kolmogorov- Smirnov Statistic tests the hypothesis that the data normally
distributed. A low significance value less than 0.05 indicates that the distribution
of the data differs significantly from a normal distribution. After conducting this
test, it was found that the assumption holds good for the data. The data is normality
distributed (.779) (see annexure1).
Reliability test has been made for testing the reliability of Quality of work
life, with the help of Coefficient (Cronbach Alpha). Reliability of data is (.971)
(see annexure 2) which is excellent.
Since p=.239 (see Annexure 3) which is greater than .05 which means
that null hypothesis is accepted. Therefore, H01 (There is no significant
difference in Quality of work life with respect to gender among Insurance sector
employees) is accepted. Hence, it may be concluded that there is no significant
difference in Quality of Work Life of Insurance sector employees with respect to
gender. G. Balachandar et al. (2013) also found
that there is no significant difference between male and female category
officers with respect to their quality of work life in Insurance Company.
Since p=.000 (see annexure 4) which is less than .05 which means that null
hypothesis is not accepted. Therefore, H02 (There is no significant difference
in Quality of work life with respect to experience among Insurance sector employees)
is not accepted. From annexure 4 it can be concluded that significant difference
arises among low experienced and high experienced employees. It could be the reason
that higher experienced employees had spent more time with the organization so they
are more comfortable with the working environment, policies, salaries, benefits
etc. Bolhari Alireza et al. (2011) also found relation between work experience
and QWL.
Since p=.000 (see Annexure 5) which is less than .05 which means that null
hypothesis is not accepted. Therefore, H03 (There is no significant difference
of Quality of work life with respect to age among Insurance sector employees) is
not accepted. Hence there is a significant difference of Quality of work life with
respect to age among Insurance sector employees. P. Aranganathan and R. Sivarethinamohan
(2012) also found that there is significant association between the respondent’s
age and various dimensions of overall Quality of Work Life.
Since p=.000 (see Annexure 6) which is less than .05 which means that null
hypothesis is not accepted. Therefore, H04 (There is no significant difference
of Quality of work life with respect to income among Insurance sector employees)
is not accepted. Difference emerged between high income group and low income group.
G. Nasl Saraji and H. Dargahi, (2006) study of Quality of Work Life,
conducted in hospital employees that reported that having a good and interesting
income is an important issue for a high Quality of Work Life.
Conclusion
The result of the study revealed that there is a significant difference between
experiences; age; income and total mean scores of Insurance sector employees on
QWL. Age has a positive impact on Quality of Work Life as the older people are having
higher degree of Quality of Work Life than Younger. Income of respondent was also
found to have significant association with QWL. Accordingly, one is inclined to
say that people who have high salaries seem to be unwilling to change their jobs
and more satisfied with their jobs and enjoys high level of QWL. Experience seemed
to affect the QWL of Insurance sector employees, with higher level of QWL shown
for higher experienced group. This implies that QWL is stronger among Insurance
sector employees that have spent longer period with the same organization. Gender
has no impact on QWL of employees, means male and female employees both are enjoying
same level of QWL.
References
· Alireza Bolhari, Ali Rezaeean, Jafar Bolhari, Sona
Bairamzadeh 4and Amir Arzi Soltan (2011). The Relationship between Quality of Work
Life and Demographic Characteristics of Information Technology Staffs. International
Conference on Computer Communication and Management , Proc. of CSIT, 5,
IACSIT Press, Singapore.
· Arts, E. J., Kerksta, A., & Van der Zee, J. (2001).
Quality of working life and workload in home help services. Nordic College of Caring
Sciences, 12-22.
· Baba, VV and Jamal, M (1991) .Routinisation of job
context and job content as related to employees quality of working life: a study
o f psychiatric nurses. Journal of organizational behaviour. 12, 379-386.
· Balu, V. (2001). Improving Quality of Work Life –
The need for dynamic H.R.D. practices. In Bhatia, B. S. and Batra, G. S. (Eds.) .Human
Resource Development, New Delhi: Deep and Deep Publications Pvt. Ltd.
· Chan, C.H. and W.O. Einstein( 1990). Quality of Work
Life (QWL): What can unions do? SAM Advanced Management J., 55, 17-22.
· Cunningham, J.B. and T. Eberle. (1990). A guide to
job enrichment and redesign. Personnel, 67, 56-61.
· Dhar Upinder , Dhar Santosh , Roy Rishu (2006).
Quality of Work Life Scale. National Psychological Corporation.
· Ellis N & Pompli A( 2002). Quality of working
life for nurses. Commonwealth Dept of Health and Ageing, Canberra.
· European Foundation for the Improvement of Living
Conditions ((2002). New Work Organization, Working Conditions and Quality of Work:
Towards the Flexible Firm? Online available at www euro found.eu.int on
8-6-2013.
http://www.human- resources- health.com/ content/10/1/30
· G. Balachandar, n.
Panchanatham and k. Subramanian. (2013). Quality
of work life the power of insurance company: impact of personal factors on the quality
of work life of the officers. Management and Marketing Journal,
Xi (1), 123-133.
· G. Nasl Saraji and H. Dargahi (2006). Study of Quality
of Work Life. Iranian Journal of Public Health, 35 (4) , 8-14.
· Kotze, T. (2005). The nature and development of the
construct 'quality of work life'. Acta Academica, 37(2), 96-122.
· Louis, K. S., & Smith, B. (1990). Teacher working
conditions. In P. Reyes (Eds.),
Teachers and their workplace: commitment, performance, and
productivity ,23-47.
Newbury Park, CA: Sage.
· P.Aranganathan and R.Sivarethinamohan (2012).Quality
of Work Life as perceived by employees in private sector manufacturing companies
– a research pape. Elixir Hum. Res. Mgmt, 44, 7462-7470.
· Rao, S. (1992). Human Resource Management.
New Delhi; Discovery Publishing House.
· Riggio, R.E. (1990). Introduction to industrial/organizational
psychology. Glenview, Illinois: Scott, Foresman and Company.
· Robbins, S. P. (1998). Organizational behavior.
(8th ed.). New Jersey: Simon & Schuster.
· Royuela, V, Tamayo, JL, Suriñach, J (2007).The institutional
vs. the academic definition of the quality of work life. What is the focus of the
European Commission?. Research Institute of Applied Economics, Working Papers 2007/13,
AQR-IREA Research Group, University of Barcelona, Geneva.
· Warr, P, Cook, J and Wall, T (1979) .Scales for the
measurement of some work attitudes and aspects of psychological well being. Journal
of Occupational Psychology. 52, 129-148.
Annexures :
Annexure 1
|
One-Sample Kolmogorov-Smirnov Test
|
|
|
Total score
|
|
N
|
151
|
|
Normal Parametersa,b
|
Mean
|
141.77
|
|
Std. Deviation
|
32.816
|
|
Most Extreme Differences
|
Absolute
|
.054
|
|
Positive
|
.040
|
|
Negative
|
-.054
|
|
Kolmogorov-Smirnov Z
|
.658
|
|
Asymp. Sig. (2-tailed)
|
.779
|
|
a. Test distribution is Normal.
|
|
b. Calculated from data.
|
Annexure 2
|
Reliability Statistics
|
|
Cronbach's Alpha
|
N of Items
|
|
.971
|
45
|
Annexure 3
|
Group Statistics
|
|
|
Gender
|
N
|
Mean
|
Std. Deviation
|
Std. Error Mean
|
|
Total score
|
Male
|
87
|
145.15
|
33.829
|
3.627
|
|
Female
|
64
|
137.17
|
31.057
|
3.882
|
|
Independent Samples Test
|
|
|
Levene's Test for Equality of Variances
|
t-test for Equality of Means
|
|
F
|
Sig.
|
t
|
df
|
Sig. (2-tailed)
|
Mean Difference
|
Std. Error Difference
|
95% Confidence Interval of the Difference
|
|
Lower
|
Upper
|
|
Total score
|
Equal variances assumed
|
1.396
|
.239
|
1.482
|
149
|
.140
|
7.978
|
5.383
|
-2.659
|
18.614
|
|
Equal variances not assumed
|
|
|
1.502
|
141.822
|
.135
|
7.978
|
5.313
|
-2.525
|
18.480
|
Annexure 4
|
Descriptives
|
|
Total score
|
|
|
N
|
Mean
|
Std. Deviation
|
Std. Error
|
95% Confidence Interval for Mean
|
Minimum
|
Maximum
|
|
Lower Bound
|
Upper Bound
|
|
0-10 Years
|
69
|
129.00
|
29.835
|
3.592
|
121.83
|
136.17
|
69
|
195
|
|
10-20 Years
|
37
|
148.76
|
34.329
|
5.644
|
137.31
|
160.20
|
81
|
209
|
|
20-30 Years
|
29
|
152.62
|
28.910
|
5.369
|
141.62
|
163.62
|
103
|
207
|
|
30& above Years
|
16
|
161.00
|
29.198
|
7.300
|
145.44
|
176.56
|
104
|
208
|
|
Total
|
151
|
141.77
|
32.816
|
2.671
|
136.49
|
147.04
|
69
|
209
|
|
ANOVA
|
|
Total score
|
|
|
Sum of Squares
|
df
|
Mean Square
|
F
|
Sig.
|
|
Between Groups
|
22389.249
|
3
|
7463.083
|
7.884
|
.000
|
|
Within Groups
|
139145.638
|
147
|
946.569
|
|
|
|
Total
|
161534.887
|
150
|
|
|
|
|
Post Hoc Tests Multiple Comparisons
|
|
Dependent Variable: Total score
|
|
Tukey HSD
|
|
(I) Experience
|
(J) Experience
|
Mean Difference (I-J)
|
Std. Error
|
Sig.
|
95% Confidence Interval
|
|
Lower Bound
|
Upper Bound
|
|
0-10 Years
|
10-20 Years
|
-19.757*
|
6.269
|
.011
|
-36.05
|
-3.47
|
|
20-30 Years
|
-23.621*
|
6.809
|
.004
|
-41.31
|
-5.93
|
|
30& above Years
|
-32.000*
|
8.537
|
.001
|
-54.18
|
-9.82
|
|
10-20 Years
|
0-10 Years
|
19.757*
|
6.269
|
.011
|
3.47
|
36.05
|
|
20-30 Years
|
-3.864
|
7.630
|
.957
|
-23.69
|
15.96
|
|
30& above Years
|
-12.243
|
9.206
|
.545
|
-36.17
|
11.68
|
|
20-30 Years
|
0-10 Years
|
23.621*
|
6.809
|
.004
|
5.93
|
41.31
|
|
10-20 Years
|
3.864
|
7.630
|
.957
|
-15.96
|
23.69
|
|
30& above Years
|
-8.379
|
9.581
|
.818
|
-33.28
|
16.52
|
|
30& above Years
|
0-10 Years
|
32.000*
|
8.537
|
.001
|
9.82
|
54.18
|
|
10-20 Years
|
12.243
|
9.206
|
.545
|
-11.68
|
36.17
|
|
20-30 Years
|
8.379
|
9.581
|
.818
|
-16.52
|
33.28
|
|
*. The mean difference is significant at the 0.05 level.
|
Annexure 5
|
Descriptives
|
|
Total score
|
|
|
N
|
Mean
|
Std. Deviation
|
Std. Error
|
95% Confidence Interval for Mean
|
Minimum
|
Maximum
|
|
Lower Bound
|
Upper Bound
|
|
up to 30 Years
|
53
|
121.30
|
28.785
|
3.954
|
113.37
|
129.24
|
69
|
195
|
|
30-40 Years
|
23
|
149.26
|
31.499
|
6.568
|
135.64
|
162.88
|
82
|
203
|
|
40-50 Years
|
46
|
148.48
|
29.069
|
4.286
|
139.85
|
157.11
|
103
|
209
|
|
50 & above Years
|
29
|
162.59
|
27.034
|
5.020
|
152.30
|
172.87
|
106
|
208
|
|
Total
|
151
|
141.77
|
32.816
|
2.671
|
136.49
|
147.04
|
69
|
209
|
|
ANOVA
|
|
Total score
|
|
|
Sum of Squares
|
df
|
Mean Square
|
F
|
Sig.
|
|
Between Groups
|
38130.770
|
3
|
12710.257
|
15.141
|
.000
|
|
Within Groups
|
123404.117
|
147
|
839.484
|
|
|
|
Total
|
161534.887
|
150
|
|
|
|
Post Hoc Tests
|
Multiple Comparisons
|
|
Dependent Variable: Total score
|
|
Tukey HSD
|
|
(I) Age
|
(J) Age
|
Mean Difference (I-J)
|
Std. Error
|
Sig.
|
95% Confidence Interval
|
|
Lower Bound
|
Upper Bound
|
|
up to 30 Years
|
30-40 Years
|
-27.959*
|
7.235
|
.001
|
-46.76
|
-9.16
|
|
40-50 Years
|
-27.176*
|
5.839
|
.000
|
-42.35
|
-12.00
|
|
50 & above Years
|
-41.284*
|
6.692
|
.000
|
-58.68
|
-23.89
|
|
30-40 Years
|
up to 30 Years
|
27.959*
|
7.235
|
.001
|
9.16
|
46.76
|
|
40-50 Years
|
.783
|
7.399
|
1.000
|
-18.45
|
20.01
|
|
50 & above Years
|
-13.325
|
8.090
|
.356
|
-34.35
|
7.70
|
|
40-50 Years
|
up to 30 Years
|
27.176*
|
5.839
|
.000
|
12.00
|
42.35
|
|
30-40 Years
|
-.783
|
7.399
|
1.000
|
-20.01
|
18.45
|
|
50 & above Years
|
-14.108
|
6.870
|
.173
|
-31.96
|
3.74
|
|
50 & above Years
|
up to 30 Years
|
41.284*
|
6.692
|
.000
|
23.89
|
58.68
|
|
30-40 Years
|
13.325
|
8.090
|
.356
|
-7.70
|
34.35
|
|
40-50 Years
|
14.108
|
6.870
|
.173
|
-3.74
|
31.96
|
|
*. The mean difference is significant at the 0.05 level.
|
Annexure 6
|
Descriptives
|
|
Total score
|
|
|
N
|
Mean
|
Std. Deviation
|
Std. Error
|
95% Confidence Interval for Mean
|
Minimum
|
Maximum
|
|
Lower Bound
|
Upper Bound
|
|
up to Rs.20000 pm
|
59
|
126.10
|
27.836
|
3.624
|
118.85
|
133.36
|
79
|
195
|
|
Rs. 20000-30000 pm
|
23
|
143.17
|
39.099
|
8.153
|
126.27
|
160.08
|
69
|
203
|
|
Rs.30000-40000 pm
|
39
|
148.82
|
31.843
|
5.099
|
138.50
|
159.14
|
100
|
209
|
|
Rs. 40000 & above pm
|
30
|
162.33
|
22.952
|
4.190
|
153.76
|
170.90
|
118
|
208
|
|
Total
|
151
|
141.77
|
32.816
|
2.671
|
136.49
|
147.04
|
69
|
209
|
|
ANOVA
|
|
Total score
|
|
|
Sum of Squares
|
df
|
Mean Square
|
F
|
Sig.
|
|
Between Groups
|
29153.783
|
3
|
9717.928
|
10.791
|
.000
|
|
Within Groups
|
132381.104
|
147
|
900.552
|
|
|
|
Total
|
161534.887
|
150
|
|
|
|
Post Hoc Tests
|
Multiple Comparisons
|
|
Dependent Variable: Total score
|
|
Tukey HSD
|
|
(I) Income
|
(J) Income
|
Mean Difference (I-J)
|
Std. Error
|
Sig.
|
95% Confidence Interval
|
|
Lower Bound
|
Upper Bound
|
|
up to Rs.20000 pm
|
Rs. 20000-30000 pm
|
-17.072
|
7.377
|
.099
|
-36.24
|
2.10
|
|
Rs.30000-40000 pm
|
-22.719*
|
6.193
|
.002
|
-38.81
|
-6.63
|
|
Rs. 40000 & above pm
|
-36.232*
|
6.729
|
.000
|
-53.72
|
-18.74
|
|
Rs. 20000-30000 pm
|
up to Rs.20000 pm
|
17.072
|
7.377
|
.099
|
-2.10
|
36.24
|
|
Rs.30000-40000 pm
|
-5.647
|
7.890
|
.891
|
-26.15
|
14.86
|
|
Rs. 40000 & above pm
|
-19.159
|
8.317
|
.102
|
-40.77
|
2.45
|
|
Rs.30000-40000 pm
|
up to Rs.20000 pm
|
22.719*
|
6.193
|
.002
|
6.63
|
38.81
|
|
Rs. 20000-30000 pm
|
5.647
|
7.890
|
.891
|
-14.86
|
26.15
|
|
Rs. 40000 & above pm
|
-13.513
|
7.288
|
.252
|
-32.45
|
5.43
|
|
Rs. 40000 & above pm
|
up to Rs.20000 pm
|
36.232*
|
6.729
|
.000
|
18.74
|
53.72
|
|
Rs. 20000-30000 pm
|
19.159
|
8.317
|
.102
|
-2.45
|
40.77
|
|
Rs.30000-40000 pm
|
13.513
|
7.288
|
.252
|
-5.43
|
32.45
|
|
*. The mean difference is significant at the 0.05 level.
|

