A Study on Relationship between Profitability and Dividend Payment in Iron &
Steel Industries in India
|
Dr. Biswajit Prasad Chhatoi
Faculty
Department of Business Administration
Ranenshaw Business School
Ranenshaw University
|
Abstract
Purpose: The purpose of this paper is
to measure/assess relationship between profitability and dividend
payment in select Indian iron & steel industry.
Design/Methodology/Approach: The researchers
collect, compile and analyze publically available data like; EPS, DPS,
and Payout Ratio of selected companies from the annual reports over the period 2004
to 2012. Descriptive as well as inferential statistical tools
are used to arrive at any conclusion. The hypotheses are tested with 95% of significance
level.
Findings: The results suggest that the
dividend decision is greatly influenced by profitability of the firm.
Research Limitations: The
study depends more on empirical procedures rather than a theoretical justification
in the anomalies on dividend policy. The research is totally based on publically
available information and limited with regard to the time span and sample size.
Practical Implications: Dividend decision
is directly associated to the financing and investment decision, it becomes crucial
for a firm to decide optimum dividend decision to the shareholders. This
also makes a judicious balance between the retention and shareholders’
satisfaction.
Originality: The present study concentrates on matters like;
do the companies belonging to the same industry declare similar percentage of dividend?
Is the growth rate fluctuate, when dividend is declared? Do the dividends declared
by the companies differ significantly from one company to other?
Keywords: Dividend, Earning per Share (EPS), Dividend per
Share (DPS) and Dividend Payout Ratio
Classification: Financial economics (JEL: G)
Introduction
Dividends are referred as reward to the shareholders for providing finance to
a firm. So far as ‘dividend payout’ is concerned, there are two schools of thought.
The first school gives importance on payment of dividend as because without any
dividend payout, shares would not have any value, whereas the other school of thought
stressed on no relationship between dividend and market price of the share -‘the
irrelevance theory’. Lintner (1956) concluded ‘in developed countries firms target
their dividend payout ratio considering current earnings and past dividends’. Miller
and Modigliani (1961) suggested ‘ irrelevance of dividend policy in measuring the
current worth of shares assuming market perfections, zero transaction costs, perfect
certainty and indifferent behaviour of investors’. Payout policy in finance has
been the primary puzzle in the economics of corporate finance since the work of
Black (1976). However, Miller and Scholes (1982) argue that in the real world, dividend
decision is inspired more by high taxes on dividends than capital gains and market
imperfections.
In corporate finance, the dividend decision is studied to identify the relation
between firm’s financing and investment decisions. The association between these
two decisions has posed various questions like; “How much should a firm pay as
dividend? How does a dividend payout policy influence the valuation of a firm? Does
a firm’s decision to distribute cash correspond to its financing and investing decisions?
What is the outcome of changes in the dividend policy assuming steady financing
and investment decisions of a firm?” Researchers have attempted
to address these questions analyzing dividend practices of some of the steel giants
in India. Dividend policy and decisions are still believed to be in ambiguity.
Literature Review
Literature review is not just a theoretical collection of concepts rather it is
the work of some people carried out in the same area based on the real time scenario
and thus would give the researcher and anyone reading the report a more practical
preview about the subject. Different studies those are directly as well as indirectly
related to the researcher area have been reviewed. Few of these are as:
Darling (1957) has conducted a study on influence of expectation and liquidity
on dividend and concluded that the expectation of the investor has an influence
on dividend policy as well as the influence of liquidity also played a vital role
in dividend policy.
Babiak et. al., (1968) in their study on ‘Dividend policy: an empirical
analysis’ used different models to predict the future dividend for which the study
was tested with selected American companies with the help of application of different
variables like cash flow, net profit, etc., and it was found that, these variables
were able to explain the dividend.
Mohanty (1999) concluded in his study on ‘Dividend and bonus policy of Indian
companies’ that firms took decision on dividend depending on the availability of
profit and he found that firms adopt constant dividend per share and have fluctuating
payout ratio during his study period.
Reddy (2002) analyzes the trends and determinants of dividend of Indian companies
listed on BSE and NSE during 1990-2001 conducting a study on factors like; number
of firms paying dividend, average dividend per share and the average payout . He
concluded, “only few companies maintain the dividend payout rate and that firms
forming a part of small indices pay higher dividend compared to firms forming a
part of broad market indices”. Further, deviations in the tax regime examined using
the trade-off theory and it is observed that this theory does not apply to the Indian
corporate sector. He concludes that the omission of dividends have information content
i.e. such companies expect lower earnings in the future whereas the same does not
hold true in case of dividend initiations.
Gugler (2003) analyzed the relationship between dividends,
the ownership and control structure of the firm for a panel of Austrian firms over
the periods 1991-1999,
and found that state-controlled firms engage in dividend smoothing, while family-controlled
firms do not. Anand (2004) analyzes the results of Anand (2002) analyzing the factors
considered by 81 CFOs in formulate divided policy to find out the determinants of
dividend policy of Indian companies. He finds that Indian companies use dividend
policy as a signaling mechanism to convey information about their present and future
prospects, therefore, affecting their market value. He also reports that while designing
a dividend policy, companies take into consideration the investors’ preference for
dividends and the clientele effect.
Hu and Liu (2005) analyzed the cash dividend payment in their article ‘Empirical
analysis of cash dividend payment in Chinese listed companies’ and observed direct
relationship existed between current earnings and dividend payout, but at the same
time debt to total asset ratio is inversely proportional to the DPR.
Das (2006) has made an attempt to study about ‘Dividend Practices in selected
Company: An empirical analysis’. In his study, he found that the company had a policy
of pursuing conservative policy from 1989 to 2005. Further, he tried to find out
whether any close association exists among the variables like DPS, EPS and capital
employed by the way of using correlation technique and vindicated that coefficient
of correlation between DPS, EPS and Capital employed was high.
Kent and Dutta (2007) in their study on "The Perception of Dividend,
by an Indian Managers: New Evidence" disclosed that the
dividend paying firms are significantly larger have other characteristics like;
earn more profit, have greater cash flows, and have growth opportunities. Bhayani
(2008) has examined the influence of earnings and lagged dividend on dividend policy
of companies listed on the BSE. He found that the current year’s earnings is the
foremost factor affecting the dividend behaviour of a firm and concludes that Indian
companies follow a stable cash dividend policy.
Azfa & Mirza (2010) present a study, which is investigated “Ownership Structure
and Cash Flows as Determinants of Corporate Dividend Policy in Pakistan” on 100
companies listed at Karachi Stock Exchange over the period 2005-2007, by using Ordinary
Least Square (OLS). They concluded, “managerial and individual ownership, cash flow
sensitivity, size and leverage are negative effect and operating cash-flow and profitability
are positively related to cash dividend”.
Mirzaei (2012) in their research paper focus on ownership structure and dividend
policy on the companies listed on Tehran Stock Exchange over a period 2004-2009.
The researcher takes company dividend policy as a dependant variable and stockholders
composition and ownership concentration as independent variables. The findings disclosed
that ‘the independent variable had not shows their positivity’.
Al- Gharaibeh et. al., (2013) conducted a study on “The Effect of Ownership
Structure on Dividends Policy in Jordanian Companies”. They selected 35 Jordanian
corporations listed on the Amman Stock Exchange over the period 2005-2010, using
full adjustment and partial adjustment model. The finding of their study is that
“the institutional ownership of a company is more it make the shareholder more in
power and it increase the value of the firm because the shareholder use their influence
and did not allow a company to invest in low return projects. Moreover, managerial
ownership has a negative coefficient in the Partial Adjustment”.
Al-Nawaiseh et. al., (2013) studied “Dividend Policy and Ownership Structure:
An Applied Study on Industrial Companies in Amman Stock Exchange” on sixty two industrial
firms listed in ASE from (2000-2006), by using Tobit Model or censored regression
model. The independent variable of the study is Leverage Ratio, Profitability, Firm
Size, Family, Multi, Institution, Insider, and Foreigner. The fraction held by insiders
(INSD), has negative impact on the level of dividends paid. The other ownership,
family is negatively but not significantly but institution is positively and significant
influence on the dividend policy. The multiple ownership is negative and insignificant;
the finally variable for ownership is foreigner positive and insignificant. More
than half of the firm observation is zero dividend.
The above literature- reviews pointed out that there is no consensus on a general
dividend theory regarding dividend decision making (or) to ensure optimum dividend
policy. Therefore, it is necessary to study dividend behavior of companies using
the framework of empirical model.
Statement of the Problem
Dividend decision have a significant role in helping the company to take an important
decision in which a firm can decide how much it should declare and how much it has
to retain from EPS. Dividend decision is directly associated to the financing and
investment decision, it becomes imperative of a firm to decide optimum dividend
decision to the shareholders. In this context, it is right time to answer the questions;
do the companies belonging to the same industry declare similar percentage of dividend?
Is the growth rate fluctuate, when dividend is declared? Do the dividends declared
by the companies differ significantly from one company to other? In order to find
solution, the present study has been carried out.
Objectives & Methodology
Objectives
To examine the EPS, DPS and Dividend Pay-Out Ratio (DPR) of selected companies
To examine the relationship between profitability and Return for selected companies
Methodology
The current study is analytical in nature. The authors have used information already
available i.e., secondary in nature. Critical evaluations of the publically available
data (basically panel type i.e., a sweet blend of cross sectional and time series
data) were made to draw any conclusion on research area. The data covered the annual
EPS, DPS, and Payout Ratio of selected companies.
During data collection, it was found that some of the sample company has split-up
their shares. In case of split –up, the researchers did not consider the split-up
value. Rather, they made all computation on the basis of face value as per 2004
financial report. Out of five sample companies, BHUSAN has split the stock in 1:5
in the year 2011, Jindal saw in the year 1:5 in 2010 and Jindal SP in the year 1:5
in 2008. The EPS and DPS data for above mention companies were manipulated from
the year of split-up by multiplying the EPS and DPS figures with their split-up
ratio to avoid unnecessary extremeness in data.
Sampling
For the purpose of the study, Iron & Steel Industry in India
were considered as its universe. The companies those satisfied
certain accepted criteria have been identified and taken as sample frame. Purposively
two criteria were considered for sieving out the companies.
· The company should be a listed company in any one
of the stock exchanges.
· Chronological availability of the data for the period
of nine years i.e., 2004 to 2012.
Based on the above conditions five companies from Iron & Steel Industry were
selected. Each selected company was treated as a sample unit of research.
Sample Size
The companies selected from Iron & Steel Industry were JINDAL
SAW, BHUSAN, JSW, TATA, and JINDAL SP.
Period of the Study
Period of the study for the above research work was covered nine
financial years. The cross sectional indicators like; EPS, DPS, and Dividend Payout
Ratio of selected companies were collected over a period from 2004 to 2012 that
constitute the panel data matrix for the study.
Data
The data for the study collected from secondary sources. The sources for the study
were Annual reports and web site of selected companies, web site of BSE and NSE,
and money control.com. The data consists of EPS, DPS, and
Dividend Payout Ratio for each financial year over 2004 to
2012.
Techniques Used
Descriptive as well as inferential statistical tools were used to arrive at any
conclusion. The hypotheses for the study were tested with 95% of significance level.
Hypotheses
In order to conduct the study and examine the objectives, the researchers formed
following hypotheses for testing.
H01: Average EPS earned among selected sample are
uniform
H02: Average DPS paid among selected sample are
uniform
H03: Average DPR among selected sample is uniform
H04: EPS and DPS vary together.
Limitations of the Study
The study depends more on empirical procedures rather than theoretical proof on
dividend policy. The researcher has drawn conclusion by way of analyzing the secondary
data and not used any theoretical modeling. The period of study was restricted to
the financial years covering 2004 -2012. The sample size for the study was only
five companies therefore any generalization of the findings of the study may be
subjected to certain cautions. Several other qualitative factors, which might have
influenced dividend policy were not taken into consideration in this study.
Analysis & Interpretations
Analysis
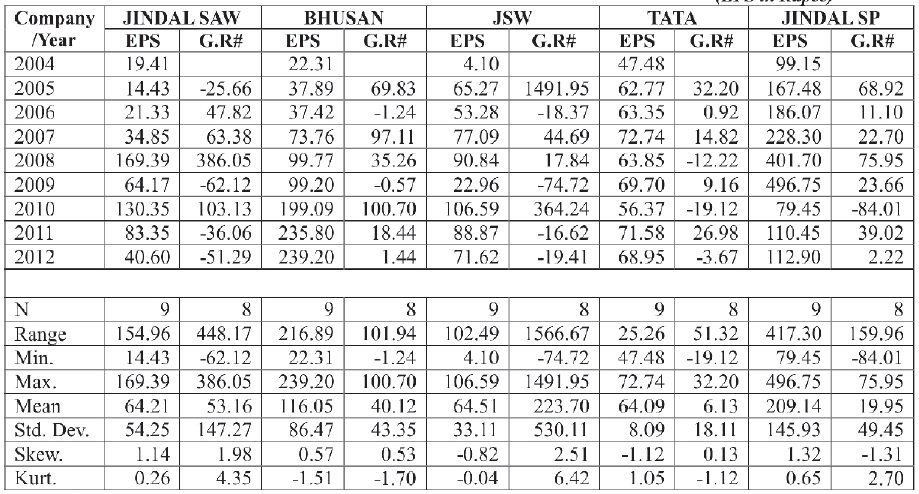
Table-1: EPS and Year over Year Growth in EPS of Selected Iron & Steel
Companies
(EPS in Rupee)
Source: Compiled and computed from Annual Reports
[BHUSAN has Split the Stock (1:5) in 2011, Jindal Saw (1:5) in 2010 and Jindal
SP (1:5) in 2008]
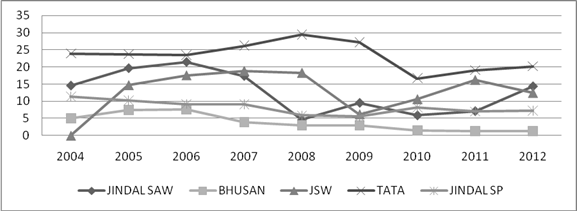
Figure-1: EPS Trend of Selected Iron & Steel Companies
.png)
Sources: Plotted from the data in the Table -4
Table-1 and Figure -1 discloses EPS of five selected Iron & Steel companies.
Out of which, JSW has recorded minimum EPS in 2004 whereas Jindal SP has highest
EPS in 2009. The average EPS earned by Jindal SP as well as the deviation of EPS
was highest among all the companies. Further, in year over year growth of EPS, highest
growth, highest average growth and maximum deviation in growth rate was recorded
for JSW whereas the minimum average growth and deviation in growth rate was recorded
for TATA Steel. EPS of JSW and TATA Steel was slightly negatively skewed with a
variation towards lower value of EPS. Referring to kurtosis values of EPS it gave
a less convex shape curve where in all cases ẞ2 <3.
Table-2: DPS and Year over Year Growth in DPS of Selected Iron & Steel
Companies
(DPS in Rupee)
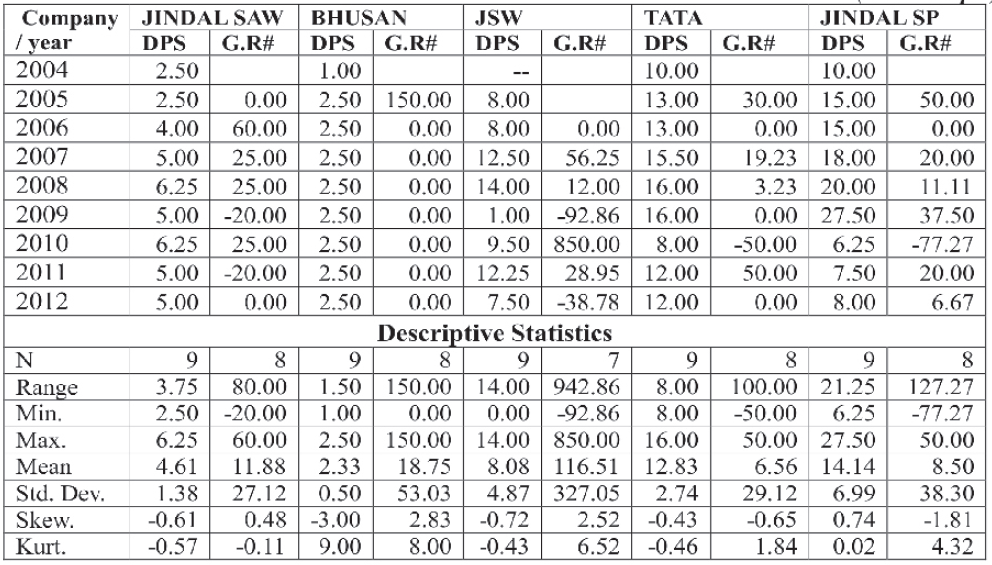
Source: Compiled and computed from Annual Reports
Figure-2: DPS Trend of Selected Iron & Steel Companies
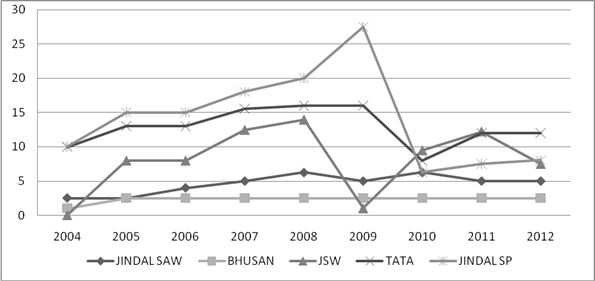
Sources: Plotted from the data in the Table -5
Table- 2 and corresponding figure discloses the DPS of five selected Iron &
Steel companies. Out of which, Bhusan has paid minimum DPS whereas Jindal SP has
paid highest dividend. The average DPS of Jindal SP and Bhusan was recorded highest
and lowest respectively among five companies. Similarly, in year over year growth
of DPS, highest year over year growth, highest average growth, and maximum deviation
was recorded for JSW.
Table-3: DPR and Year over Year Growth in DPR of Selected Iron & Steel
Companies
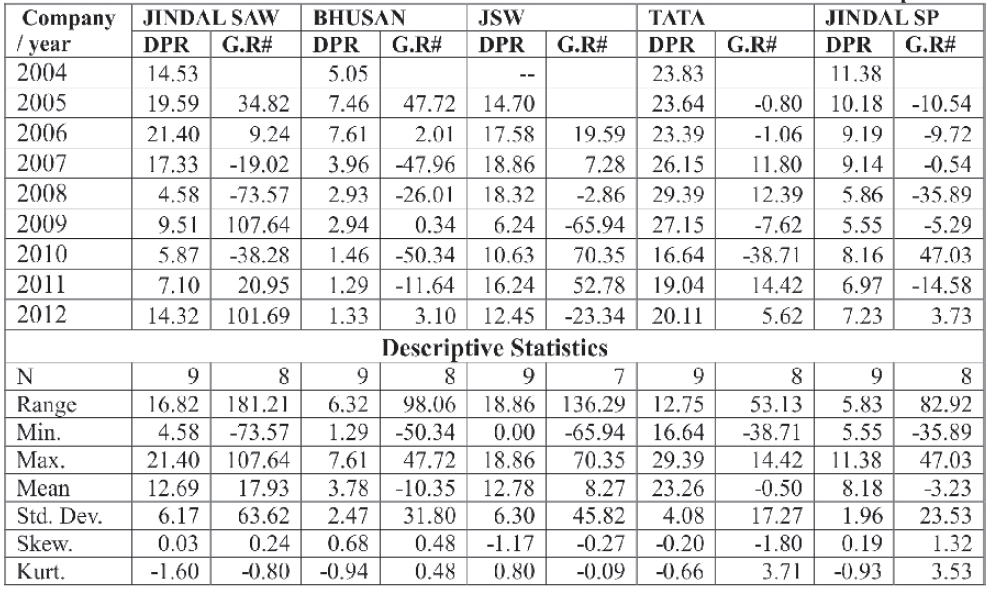
Source: Compiled and computed from Annual Reports
Figure-3: DPR Trend of Selected Iron & Steel Companies
Sources: Plotted from the data in the Table -6
As would be observed from above Table and Figure that the Dividend Payout Ratio
(DPR) of JSW was minimum among five companies whereas minimum average DPR belongs
to Bhusan Steel. DPR of Tata Steel has the highest payout ratio as well as highest
average DPR. In year over year growth of DPR, highest average growth as well as
highest year over year growth was recorded for Jindal SAW.
Hypothesis Testing
H01: Average EPS earned among selected sample are uniform
From the Table-1 & 4, it was observed that the EPS earned by Iron & Steel
as well as growth in EPS were fluctuating over the period of study. At this juncture,
the researchers have applied ANNOVA to justify whether the difference among the
mean EPS was uniform or not.
Table-4: ANNOVA Summary; EPS and Growth in EPS for Iron & Steel Companies
|
EPS Value of Iron & Steel Companies
|
|
Details
|
Sum of Squares
|
df
|
Mean Square
|
F
|
Sig.
|
|
Between Groups
|
143406.673
|
4
|
35851.668
|
5.453
|
.001
|
|
Within Groups
|
263010.208
|
40
|
6575.255
|
|
|
|
Total
|
406416.881
|
44
|
|
|
|
|
Growth in EPS Value of Iron & Steel Companies
|
|
Between Groups
|
250999.195
|
4
|
62749.799
|
1.021
|
.410
|
|
Within Groups
|
2151531.361
|
35
|
61472.325
|
|
|
|
Total
|
2402530.557
|
39
|
|
|
|
Source: Computed Data
Table-7 contains ANNOVA summary of EPS and Growth in EPS for
Iron & Steel Companies. The results of EPS
for Iron & Steel Companies in summary table leads to rejection
of null hypothesis whereas results of Growth in EPS result
leads to acceptance of null hypothesis. So the null hypothesis (Average
EPS earned among selected sample are uniform) were to be rejected with 95% confidence.
H02: Average DPS paid among selected sample
are uniform
Table-5: ANNOVA Summary; DPS and Growth in DPS for Iron & Steel Companies
|
DPS Value of Iron & Steel Companies
|
|
Details
|
Sum of Squares
|
df
|
Mean Square
|
F
|
Sig.
|
|
Between Groups
|
934.647
|
4
|
233.662
|
14.217
|
.000
|
|
Within Groups
|
657.403
|
40
|
16.435
|
|
|
|
Total
|
1592.050
|
44
|
|
|
|
|
Growth in DPS Value of Iron & Steel Companies
|
|
Between Groups
|
54763.226
|
4
|
13690.806
|
.685
|
.607
|
|
Within Groups
|
699864.861
|
35
|
19996.139
|
|
|
|
Total
|
754628.087
|
39
|
|
|
|
Source: Computed Data
The ANNOVA test result in the Table-5 disclosed that the ‘F’ value were significant
at 95% of confidence level being the observed significant value was less than 0.01
for DPS of Iron & Steel Companies.
But, in case of Growth in DPS, for Iron & Steel Companies the
‘F’ value is not significant. So the null hypothesis (Average
DPS paid among selected sample are uniform) were to be rejected with 95% confidence.
H03: Average DPR among selected sample is uniform
Table-6: ANNOVA Summary; DPR for Iron & Steel Companies
|
Details
|
Sum of Squares
|
df
|
Mean Square
|
F
|
Sig.
|
|
Between Groups
|
934.647
|
4
|
233.662
|
14.217
|
.000
|
|
Within Groups
|
657.403
|
40
|
16.435
|
|
|
|
Total
|
1592.050
|
44
|
|
|
|
Source: Computed Data
The ANNOVA test result in the Table-6 disclosed that the ‘F’ value were significant
at 95% of confidence level being the observed significant value was less than 0.01
for DPR of Iron & Steel Companies.
So the null hypothesis (Average DPS paid among selected Iron & Steel companies
are uniform) were to be rejected with 95% confidence.
H04: EPS and DPS vary together.
Table - 7: Correlation Result of EPS and DPS for Iron & Steel Companies
|
Details
|
JINDAL SAW
|
BHUSAN
|
JSW
|
TATA
|
JINDAL SP
|
|
EPS
|
DPS
|
EPS
|
DPS
|
EPS
|
DPS
|
EPS
|
DPS
|
EPS
|
DPS
|
|
EPS
|
Correlation#
|
1
|
.823**
|
1
|
.407
|
1
|
.818*
|
1
|
.642
|
1
|
.946**
|
|
Sig. (2-tailed)
|
|
.006
|
|
.278
|
|
.013
|
|
.062
|
|
.000
|
|
N
|
9
|
9
|
9
|
9
|
8
|
8
|
9
|
9
|
9
|
9
|
|
DPS
|
Correlation#
|
.823**
|
1
|
.407
|
1
|
.818*
|
1
|
.642
|
1
|
.946**
|
1
|
|
Sig. (2-tailed)
|
.006
|
|
.278
|
|
.013
|
|
.062
|
|
.000
|
|
|
N
|
9
|
9
|
9
|
9
|
8
|
9
|
9
|
9
|
9
|
9
|
|
*. Correlation is significant at the 0.05 level (2-tailed).**. Correlation is significant
at the 0.01 level (2-tailed).
|
Source: Computed Data # Pearson Correlation
Coefficient
Table-7 shows that there have been positive correlation between EPS and DPS for
all the sample companies selected. This basically means that there was a strong
association between EPS and DPS as indicated by positive correlation. While testing
the nature of relationship, the correlation is significant at the 5% level, for
JSW in Iron & Steel whereas the correlation is significant at the 1% level for
Jindal SAW and Jindal SP. The correlation between EPS and DPS for Bhusan steel (.407)
was least among all the Iron & Steel Companies. Further, the correlation between
EPS and DPS for TATA Steel (.642) is not significant at the 5% level. So the hypothesis
that EPS and DPS vary together
holds good.
Findings & Conclusion
Summary of Findings
The key objective behind the research work is to examine the relationship between
profitability and dividend for selected steel companies over the period of study.
The researchers arrived at following points viz:
· In relation to the EPS, Jindal SP
earned highest amount of EPS (496.75) in 2009, as well as registered highest average
EPS value (209.14), whereas Tata steel registered lowest average value of EPS (64.09).
· So far as the DPS is concerned, JSW has
adopted ‘no dividend policy’ in 2004 whereas
Bhusan has declared minimum DPS (Rs. 1) in that year.
Jindal SP declared highest amount of DPS (27) in 2009, as
well as registered highest average value (14.14) of DPS.
· As far as the association between EPS and DPS,
the correlation is significant at the 1% level for Jindal SAW and Jindal SP, whereas
the correlation is significant at the 5% level for JSW. The correlation between
EPS and DPS for Bhusan and TATA Steel is not significant at the 5% level. It has
been inferred that with the increase in EPS, DPS also increases.
Concluding Note
Dividend decision is a crucial decision for a firm because it makes a trade-off
between requirement of fund for long-term commitments and shareholders expectations.
A liberal dividend decision brings satisfaction to the shareholders who expect a
fat and regular income but at the other hand, the firm's financing decision is affected
when the firm finds an opportunity to reinvest its surplus. As because retained
earnings do not involve any explicit cost, finance managers prefer retained earnings
as a mode of financing towards its investment decision. Steel industry in India
is one of the potential sectors to grow in the years to come. The study has brought
to the light the impact of dividend decision on corporate financing pattern by the
way of studying the trends and progress of selected corporate dividend decision
during the period of study. The study has revealed that the sample companies, which
were selected for the purpose of the research, exercised precautionary measures
in declaring dividend decision as well as they has maintained consistency in terms
of EPS, DPS and DPR.
References
1. Afza, T., Mirza, H, H., (2010), Ownership Structure
and Cash Flows As Determinants of Corporate Dividend Policy in Pakistan, International
Business Research, 3(3), 2010-2021
2. Al- Gharaibeh , M., Ziad, Z., and Al-Harahsheh, K.,
(2013), The Effect of Ownership Structure on Dividends Policy in Jordanian Companies,
Interdisciplinary Journal Of Contemporary Research In Business, 4(9), 769-796
3. Al-Nawaiseh, M., (2013), Dividend Policy and Ownership
Structure: An Applied Study on Industrial Companies in Amman Stock Exchange, Journal
of Management Research. 5(2), 83-106
4. Anand, M. (2004). Factors Influencing Dividend Policy
Decisions of Corporate India. The ICFAI Journal of Applied Finance, 2(10):
5 – 16.
5. Anand, M.( 2002). Corporate Finance Practices in
India: A Survey. Vikalpa, 27(4): 29 – 56.
6. Babiak Harvey Sugene and Fama (1968) "Dividend
Policy: An Empirical Analysis", journal of American Statistical
Association, December, pp. 1132-1161.
7. Bhayani, S. J. (2008). Dividend Policy Behaviour
in Indian capital Market: A Study of BSE – 30 Companies. DIAS Technology Review,
4(1): 30 – 39.
8. Black, F. (1976), The dividend puzzle, The Journal of Portfolio
Management 2, 72-77.
9. Darling P G (1957), "The Influence of Expectations
and Liquidity on Dividend Policy', Journal of Political Economy, June,
pp. 209-224.
10. Das P K (2006), "Dividend Practices in Selected
Company: An Empirical Analysis", The Management Accountant, Vol. 41,
No. 4, pp. 288-293.
11. Gugler, K. (2003). Corporate
governance, dividend payout policy, and the interrelation between dividends,
r&d and capital investment.
Journal of Banking and Finance 27 (7):
1297–321.
12. Hu Y and Liu S (2005), "Empirical Analysis
of Cash Dividend Payment in Chinese Listed Companies", Nature and Science,
Vol. 3, No. 1, pp. 65-70.
13. John Ltnter (1956), "Distribution of Income
of Corporations among Dividends Retained Earnings and Taxes",
The American Economic Review, May, 46(2): 97 – 113.
14. Kent Baker H and Dutta Gandhi D (2007), "The
Perception of Dividend, by an Indian Managers: New Evidence", International
journal of Managerial Finance, Vol. 3, No. 1, pp. 70-91.
15. Miller, M. H. and Scholes, M. (1982). Dividends
and Taxes: Some Empirical Evidence. Journal of Political Economy, December,
1118-1141.
16. Miller, M. H., & Modigliani, F. (1961). Dividend
Policy, Growth and Valuation of shares. The Journal of Business , 4 (34),
411-433.
17. Mirzaei, H., (2012), A survey on the relationship
between ownership structure and dividend policy in Tehran stock exchange, International
Conference on Management, Applied and Social Sciences, 24(25), 327-332
18. Mohanty P (1999), "Dividend and Bonus Politicies
of the Indian Companies” Vikalpa. Vol. 24, No. 4, pp. 35-42.
19. Reddy, Y. S. (2002). Dividend Policy of Indian Corporate
Firms: An Analysis of Trends and Determinants. NSE Working Paper No. 19,
December: 1 – 47.
20. Singhania Monica (2005), "Trends in Dividend
Payout: A Study of Select Indian Companies", Journal of Management
Research, Vol. 5, No. 3, pp. 129-142
Books
1. Prasanna Chandra (2001), Financial Management
Theory and Practice, Tata Mcgraw Hill Publishing Company Ltd., New
Delhi.
2. Jain and Khan (2004), Financial Management,
Tata Mcgraw Hill Publishing Company Ltd., New Delhi.
3. R. P. Rustagi (2006), Financial Management
Theory, concepts and Problems, Galgotia
Publishing Company, New Delhi.
Website
www.moneycontrol.com
www.jindalsaw.com
www.bhusan.org
www.tatasteel.com
www.spjindal.com
www.jsw.in

