To understand the Price Sensitivity buyer behavior of Consumer
|
Prof. Amit Shrivastava
Assistant Professor Marketing
Durga Devi Saraf Institute of Management Studies
S.V. Road, Opp. Bajaj Hall, Malad (W), Mumbai (India)- 400064
Contact No.- +91 9768129299
Email: amitshri0073@gmail.com
|
Dr. Sushil Kumar Pare
Assistant Professor, Marketing
Thakur Institute of Management Studies and Research
Thakur Shyam Narayan Marg, Kandivali (E),Mumbai (India) - 400066
Email: paresushil@hotmail.com
|
Dr. Saumya Singh
Associate Professor, Marketing
Indian School of Mines, Dhanbad
Contact No.- +91 94313 77737
Email: saumya.ism@gmail.com
|
Abstract
Consumers in rural markets are exposed to ever increasing expansion of options
with reference to consumables in the last decade of 21st century. Marketers
desire to set a price that will maximize demand and ensure a profitable business
result in the rural areas. Therefore, correct approximation of demand, with respect
to price sensitivity across the segments, ability to define distribution expectation
of rural markets is crucial for marketers. Understanding the price sensitivity of
potential buyers is a requirement for successfully segmenting the consumer so that
as a marketer, firms can design suitable value propositions instead of offering
similar marketing mix and under-utilize scared resources. This paper is an attempt
to establish and validate the price sensitivity of the rural buyer. Despite an earlier
intensive research work done by researchers on price and its various aspects
, a study on comparative Price Sensitivity for Personal Care & Grocery
Category specifically framed for the FMCG Sector has been missing, particularly
in the rural area. The study aims to address this area. Comparative study was conducted
to ensure that respondent is able to register their sensitivity towards pricing
corresponding to both the categories with choice and fairness. The research design
involved three broad stages: item generation and selection assessment of reliability
and validity and developing a model of price sensitivity. The paper provides future
course of study of consumer’s price sensitivity for researchers and practitioners.
Key words: Price Sensitivity Scale, Price Sensitivity Measurement,
Consumer Behaviour, Personal Care, Grocery, Price Sensitive, Value Segment
Introduction
Fast Moving Consumer Goods (FMCG) goods are popularly named as consumer packaged
goods. Items in this category include all consumables (other than groceries/pulses)
people buy at regular intervals. The most common in the list are toilet soaps, detergents,
shampoos, toothpaste, shaving products, shoe polish, packaged foodstuff, and household
accessories and extends to certain electronic goods. These items are meant for daily
of frequent consumption and have a high return.
India has been a consumption-driven economy for the last many decades. Broadly categorised
into urban and rural markets, Consumer spending in the country is expected to increase
about 2.5 times by 2025, therefore, the Indian consumer segment is gaining high
attention and pampering from marketers across the globe.
The overall fast moving consumer goods (FMCG) market is expected to increase at
a compound annual growth rate (CAGR) of 14.7 per cent to US$ 110.4 billion during
2012–2020, with the rural FMCG market expected to increase at a CAGR of 17.7 per
cent to US$ 100 billion during 2011–2025 (Indian Consumer Market: SNAPSHOT: Introduction,
2014) . FMCG companies were largely dependent on rural demand to garner volumes
in 2013 when sales of discretionary items were affected in a slowing market. The
industry, which grew in high double digits until 2012, was grappling with the slowdown
in the past three quarters. High input costs left no choice for consumer goods companies
but to increase prices and reduce unit pack sizes. A non-food category experienced
a higher degree of slowdown and is driven by hair care and personal care. Essentials
such as cooking oil and impulse foods saw better growth compared with indulgent
categories such as skincare. (Purvita Chatterjee, 2013) FMCG companies with categories
such as household insecticides, hair colours and fabric whiteners have been spared
from the slow growth that hit bigger categories such as soaps and detergents.
Despite a market of 100 Million ascribed to 400 towns, FMCG companies have not been
able to tap the market potential fully due to limited understanding of consumers’
habit of deriving value against price, as sourced by performance & measurement
company AC Nielsen.
Companies have been struggling to get the numbers attributed to ever rising inflation
and weaker crippling consumer sentiment. However, as per Nielsen reports, there
is larger market begging for attention. This proposes FMCG players to focus on the
middle India (with population range from 1 Lac to 10 Laces) & rural India in
the long term. These two markets together contribute to 3/4th of the
market, by 2015. Middle India’s per capita consumption stood at Rs.2800/-, which
is significantly higher than all-India average of Rs.1200/-. Euro monitor International's
survey has found that 68 per cent of personal care products were sold in rural India
in FY 12 as against 31 per cent in cities. Thus, markets in rural and semi-urban
India are on the edge to be the future growth drivers due to higher disposable incomes,
rising desires of people to own quality products and improved infrastructure support
extended by the Government for the development of these areas (Avinash Pareek, 2013).
Rural markets, unaffected by the economic slowdown, have created a complete turnaround
in the mindsets of the marketers. Rural India is and will remain a major consumer
of goods and services, its sheer size making it a force to reckon with. It is well
known that 70 per cent of the country’s population and 56 per cent of its overall
consumption comes from rural India. (Purvita Chatterjee, 2013).
Several factors have led to an increase in rural purchasing power; the sector is
excited about a burgeoning rural population whose incomes are rising and which is
willing to spend on goods designed to improve lifestyle (S John Mano Raj, 2007).
It is also not uncommon to notice that growth in hinterland is also propelled by
the distribution push because search area for growth is ably supported by manufacturers
placing their brands on shelves across geographies and create demand by sheer availability.
Geographic presence and the availability of these products in proximal markets now
mean faster replenishment cycles that is likely to translate into greater per capita
consumption. A leading consumer research firm has also identified that consumer
readiness for trial a category has also expanded the ambit of large number of consumers
in rural markets demanding for branded packaged goods (Prashant Singh, 2011). The
rural audience has matured enough to understand the communication developed for
the urban markets, especially with reference to FMCG products. Television has been
a major effective communication system; an advertisement touching the emotions of
rural folks has also driven quantum jump in the sales volume (S John Mano Raj, 2007).
Also with a near saturation and cut throat competition in urban India, many producers
of FMCGs are driven to chalk out bold new strategies for targeting the rural consumers
in a big way.
The increase in procurement prices the government sets the minimum support price
-- MSP -- for many farm products has contributed to a rise in rural demand. A series
of good harvests on the back of several good monsoons boosted rural employment in
agricultural and allied activities. Government schemes like NREGS [National Rural
Employment Guarantee Scheme, which guarantees 100 days of employment to one member
of every rural household] reduced rural underemployment and raised wages. Also,
farmers benefited from loan waivers introduced in the last Union Budget. Total income
in rural India (about 43% of total national income) is expected to increase from
around US$220 billion in 2004-2005 to US$510 billion by 2012-2013, a CAGR of 12%,
lastly, rural consumer is nearly free from spending on rent or food, therefore,
rural way of living leaves the consumer with higher amount that can be spent on
other products.
Challenges of Rural India
(Pawan Kumar, August, 2013) The typical structure of rural markets and behavior
of rural consumer pose challenges to marketers in reaching these markets. One of
the concerns are no all weather roads to connect the urban center with the rural
areas, other infrastructure handicap is warehousing, because of which, wastage is
a perennial problem. Inadequate media coverage and lack of power creates hindrance
for communication in rural areas, apart from this, there is relatively low literacy
level, inability to consume print media, and extremely scattered market pockets
make the job difficult for rural marketers.
Literature Review
Price sensitivity can be defined as how consumer feels about the price of an offering
(Goldsmith & Newell, 1997). Early AIO (activities, interest & opinion) measures
of lifestyle contained a subscale to measure price consiousness (Wells & Tigert,
1971). It is important for the marketers to ascertain the range and the Price Sensitivity,
because, if they miss the range by miniscule margins, it will result into enormous
consequences to their bottom-line. Despite the concerns, the Price Sensitivity Measurement
remains a simple method; it is both easy to execute and easy to understand. Although
it is rarely proposed and recommended the Price Sensitivity Measurement as a method
for definitively selecting the price for a product, it can be used as a tool for
gauging consumers’ price perceptions and expectations (bsaikrishna, 2012).
(SANGMAN HAN, 2001) states that, price influence consumer purchase behavior and
eventually firm’s sales and profits. Price plays a considerable role in consumers’
formation of quality perception (Robin Raffard 1992). Managing price and price perception
is typically difficult, because price is often a quality cue and really lower price
may allow consumer perceive low price as a signal of poor quality. The most common
definition of value is the ratio or trade-off between quality and price (Monroe,
1990). The relationship between Price-Value has been a common expression. Some researchers
have tried to find relationship beyond just monetary value. The interpretation of
price value must be based on the buyer’s view of the relationship between price
and value (Lewis & Shoemaker, 1997). It is also interesting to note that consumers
may be conditioned to expect deals and insensitive to smaller on offers. (C M Lillis,
1974) found that out shoppers of larger communities residents from smaller communities
have a perception that local prices are higher and quality to be poor viz-a-viz
retail centers. Low levels of income mean that rural markets are apt to be most
concerned about receiving value for money. This does not always mean a low price,
but rather that the product or service is deemed to offer appropriate benefits
for the expenditure (Douglas, 2011).
(Vantrappen, 1992) commented that perceived value will be critically important in
21st century; indeed in retailing industry. (Burden, 1998), Successful
retailers target their offers towards two customer categories; those with an emphasis
on value and others with time pressure is key.
In nearly every market, particularly rural market, there will be a segment, which
is driven with price. Such a segment is given nomenclature as “Value Segment”. The
size of the ‘Value Segment” inflates more during the inflationary period. It is
risky to ignore this segment, particularly in developing economies because of expanding
lower-middle class and steep recession can enhance the market value share of ‘value
segment’. (Douglas, 2011) has suggested rural areas in emerging markets require
modified marketing mix in terms of low cost functional and innovative pricing strategies.
The value propositions designed for countries at the upper end of the income spectrum
seldom work sustainably for the needs of the emerging rural population. The problem
persists when companies try to export value propositions developed for the Middle
and Upper-Middle tiers, with some customization, to the rural population (Shashank
Tripathi, 2012). Therefore, researcher proposes that companies need to develop a
nuanced understanding of the set of expectation; this consumer segment keeps developing
innovative propositions to meet its needs. While, lower prices are critical in this
segment, as rural markets have irregular bite-sized cash flow. Yet rural marketer
has to position the value proposition around performance and rising aspirations,
marketer must focus on what ‘job’ the consumer is ‘hiring’ the product to perform,
businesses must design and position their solutions on other dimensions of value.
Which signifies proposition around only low cost will not lead to success.
Researcher ambition is to develop a scale to measure price sensitivity of rural
consumer, because as a marketer, nuanced understanding of various segments with
underpinning of their price sensitivity will help in designing appropriate value
proposition.
Development of Scale
The literature already discussed suggested distinct aspects of price sensitivity.
This section describes the process used to establish the content for dimensions
and validate the scale theoretically and statistically. After the development of
initial set of 23 items based on the theoretical groundwork, sample of diverse set
of rural consumers, balanced between males and females and were from range of occupations
such as farmers, self-employed and business men. They were aged between 24-59 years.
The diversity of respondents was planned to represent buyers of consumable product
in study with the key intention to generate items measuring price sensitivity. The
respondents were asked to register their price sensitivity on low-involvement category
consumables such as paste & shampoo.
As a consequence of exploratory phase, many of the items produced were generic and
eliminating those alpha coefficients items increased the reliability statistics
of the scale to 0.921. An initial quantitative procedure to reduce the number of
items and to examine the scale’s psychometric properties. Eight items were deleted
from scales on the basis of retest of correlation value of less than 0.50. After
this 15 items remained.
Till this stage, researcher has not checked the probable overlap of items across
dimensions, keeping this in view, a Principal Component Analysis with varimax rotation.
A clear factor pattern emerged; however, after the repeated iteration of removing
items, which had highest loading on inappropriate factor, or almost similar loading
on more than one factor, 7 items remained. Another exploratory factor analysis was
on these 7 items showed an absolutely clear factor pattern.
Reliability & Validity of Scale
Since the other dimensions of the scale were established, researcher conducted a
confirmatory factor analysis, which was tested against a one factor model suggested
that observed variables represent a single value dimension.
Methodology
Research Design
As the researchers are using active research, the research design includes two basic
things, first is designing a questionnaire and administering the survey. The questionnaire
was reviewed by three reviewers experienced in consumer buying behavior research,
out of which, one was blind review.
Before going for actual administration of the questionnaire, first it was administered
on a small sample to check and then it is actually carried out on the sample population.
Furthermore to enhance the effectiveness a 20% of the sample is covered with structured
interview.
To limit the scope of study the researchers has chosen the personal care category
and grocery as both the categories occupy major portion in the monthly shopping
list of the households.
Objectives
The study was undertaken with the following objective:
- To understand the Price Sensitive buying behavior of Consumer
Development of study
After consulting relevant literature and discussion with academicians and practitioners,
29 items were developed. These items were discussed with three experts. After discussion,
23 items remained. These items were converted into a structured questionnaire. These
questionnaires were administered on the sample size of 300. The data was then tabulated
and Quartile test was administered to establish the lower & upper limit for
the price sensitivity.
Reliability
The reliability of an instrument is its ability to produce consistent results each
time. While administering the instrument under similar conditions to the same population
– similar the results, higher the reliability. There are external and internal consistency
procedures for determining reliability. The present research considers the internal
consistency procedure for measuring reliability of the instrument in personal care
category.
Validity
Besides face validity, as all items of the scale are related to the variable under
focus, it has high content validity. It is evident from the assessment and ratings
of the judges /experts that items of the scale are directly related to the concept
of price sensitivity measurement. In order to find out the validity from the coefficient
of reliability (Garrett, 1981), the reliability index was calculated, which indicated
high validity on account of being 0.94.
Conclusion
The Consistency
The item-item correlation matrix is the important component of item analysis. This
matrix displays the correlation of each item with every other item. This matrix
provides important information about a test’s internal consistency. As we all know,
it should be correlated highly with the other items measuring the same construct.
As only two items are negatively correlated with other items, it can be safely assumed
that first two items can be dropped without compromising the reliability of the
test. These two items viz. “checking price before buying” and “checking at three
different options before buying” mainly signifies comparison.
Researcher can interpret that even a price sensitive customer is not going for explicit
“comparison” of the alternate before buying or ‘comparison’ is not on top of the
mind while taking purchase decision for these categories.
Item Reduction and exploratory analysis
Exploratory Factor Analysis has been used as researcher has little idea about the
underlying idea about the underlying interplay of variables therefore how variable
would operate with one another (Matsunaga, 2010). Research has used EFA to identify
a latent factor that reconstructs the complexity of the observed variable into a
form, that solution extracted from EFA should retain all important variables and
covariance between the construct while redundant information are removed (R.K.Henson
& Roberts, 2006).
Researcher generated pool of items that are supposed to tap the construct, it was
expansive with 23 items, since ambition was to not to miss any important aspect
of the construct thereby maximizing the face validity. Researcher collected quantitative
data interval and ordinal data using five point likert scale.
Cronbach's alpha is an index of reliability associated with the variation accounted
for by the true score of the "underlying construct." Construct is the
hypothetical variable that is being measured (L.Hatcher, 1994). Once data are collected
with sample size of 333. The item total statistics table presents the ‘Cronbach’s
Alpha if item deleted’ as appearing in the table below:
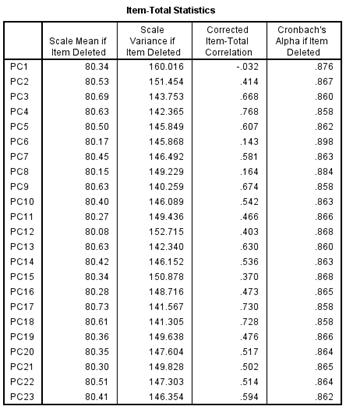

Test of Reliability was administered on 23 items which reported Cronbach’s Reliability
Statistics of 0.871 with 23 items. The last column presents the value that Cronbach's
Alpha would be if that particular item was deleted from the scale. We can see that
removal of any item, except item 1, 6, 8 & 15 would result in a lower Cronbach's
alpha. Therefore, we would not want to remove these questions. Removal of question
1, 6, 8 & 15 would lead to an improvement in Cronbach's alpha, and we can also
see that the "Corrected Item-Total Correlation" value
was low (below 0.40) for these items. This led the researcher to remove these items.
After removing the items when reliability statistics was reiterated, the improved
Cronbach’s Alpha is discussed below:
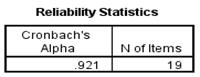
After 4 iterations improved Cronbach’s Alpha is 0.92 with 19 items for the intended
construct.
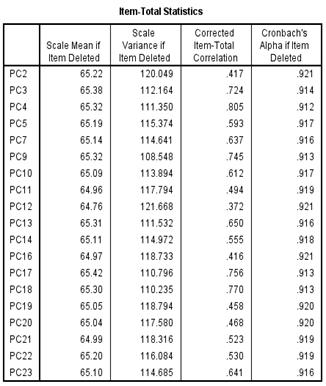
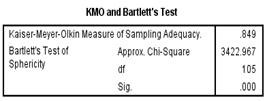
KMO & Bartlett’sTest
 Barlett's test of sphericity is significant, thus the hypothesis that the inter-correlation
matrix involving these eight variables is an identity matrix is rejected. Thus from
the perspective of Bartlett's test, factor analysis is feasible. As Bartlett's test
is almost always significant, a more discriminating index of factor analyzability
is the KMO. For this data set, it is .849, which is very large, so the KMO also
supports factor analysis. Kaiser's rule of retaining factors with Eigen values larger
than 1.00 was used in this analysis as the default.
Barlett's test of sphericity is significant, thus the hypothesis that the inter-correlation
matrix involving these eight variables is an identity matrix is rejected. Thus from
the perspective of Bartlett's test, factor analysis is feasible. As Bartlett's test
is almost always significant, a more discriminating index of factor analyzability
is the KMO. For this data set, it is .849, which is very large, so the KMO also
supports factor analysis. Kaiser's rule of retaining factors with Eigen values larger
than 1.00 was used in this analysis as the default.
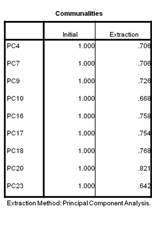
Analysis of Communalities
Once the extraction of factors has been completed, researcher examined the table
of 'Communalities' which explains how much of the variance in each of the original
variables is explained by the extracted factors. Higher communalities are desirable.
If the communality for a variable is less than 50%, it is an item for exclusion
from the analysis because the factor solution contains less then, which can be seen
below:
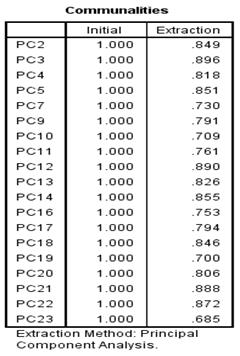 Half of the variance in the original variable, and the explanatory power of that
variable might be better represented by the individual variable. The table of Communalities
for this analysis shows communalities for three variables below 0.75. Since the
researcher does not use the factors as either dependent or independent variables
in additional analysis, removal of variables with low communalities is not an issue.
Half of the variance in the original variable, and the explanatory power of that
variable might be better represented by the individual variable. The table of Communalities
for this analysis shows communalities for three variables below 0.75. Since the
researcher does not use the factors as either dependent or independent variables
in additional analysis, removal of variables with low communalities is not an issue.
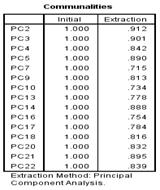
After removing item numbers reiterating the process, the revised Communalities are
mentioned below:
Exploratory Factor Analysis
Exploratory factor analysis (EFA) is a statistical approach to examine the internal
reliability of a measure. EFA is generally used when researchers have no hypotheses
about the nature of the underlying factor structure of their measure. It is used
to investigate the theoretical constructs, or factors, that might be represented
by a set of items. Either can assume the factors are uncorrelated, or orthogonal.
It is used to assess the quality of individual items.
With EFA, researchers usually decide on the number of factors by examining output
from a principal components analysis. Eigen values are produced by a process
called Principal Components Analysis (PCA) and represent the variance accounted
for by each underlying factor.
Using the rotated component matrix gives few dimensions of price sensitivity.
In order to explore the underlying factors, which structure the measure, there were
few items removed based on close cross loading or low loading among more than one
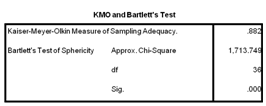
factor, after three iterations KMO & Bartlett’s Test was also administered to
ascertain the sample adequacy.

After continuing the iteration to establish the factors that can ascertain the construct
of measure, researcher removed items
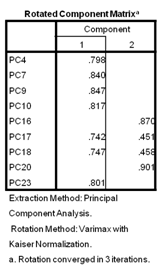
Here, there are nine items to measure the construct, however, since, two items do
not define any factor therefore researcher has safely removed these items to establish
one factor model. In the subsequent stage, researchers have performed confirmatory
factor analysis to by measuring goodness of fit indices as a construct to measure
the price sensitive buyer behavior.
The Confirmatory Factor Analysis
With the help of SPSS; having established that the scale is one factor model the
other probabilities such as two factor model are ruled out (sweeny & Southar,
2001). As suggested by Bollen (1989, as cited by sweeny and southar, 2001), a null
model, in which no factors were conserved underlie the observed variables, correlations
between observed indicators were zero and variances of the observed variables were
not restricted can be tested against a series of models. In this case a one factor
model (suggesting that the observed variables represent a single value dimension)
is the appropriate for testing.
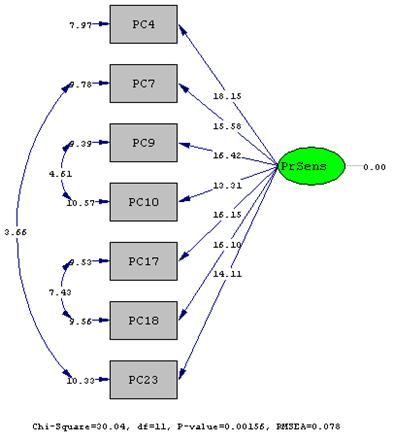
Goodness of Fit Statistics
Minimum Fit Function Chi-Square = 30.57 (P = 0.0013)
Root Mean Square Error of Approximation (RMSEA) = 0.078
90 Percent Confidence Interval for RMSEA = (0.045 ; 0.11)
P-Value for Test of Close Fit (RMSEA < 0.05) = 0.078
Chi-Square for Independence Model with 21 Degrees of Freedom = 2601.75
Independence AIC = 2615.75
Model AIC = 64.04
Saturated AIC = 56.00
Independence CAIC = 2648.42
Model CAIC = 143.37
Saturated CAIC = 186.66
Parsimony Normed Fit Index (PNFI) = 0.52
Comparative Fit Index (CFI) = 0.99
Incremental Fit Index (IFI) = 0.99
Relative Fit Index (RFI) = 0.98
Root Mean Square Residual (RMR) = 0.013
Standardized RMR = 0.019
Goodness of Fit Index (GFI) = 0.97
Adjusted Goodness of Fit Index (AGFI) = 0.93
Parsimony Goodness of Fit Index (PGFI) = 0.38
|
Covariance Matrix (Lisrel output)
|
|
|
PC4
|
PC7
|
PC9
|
PC10
|
PC17
|
PC18
|
PC23
|
|
PC4
|
0.61
|
|
|
|
|
|
|
|
PC7
|
0.36
|
0.45
|
|
|
|
|
|
|
PC9
|
0.76
|
0.66
|
2.04
|
|
|
|
|
|
PC10
|
0.44
|
0.34
|
0.95
|
0.83
|
|
|
|
|
PC17
|
0.34
|
0.26
|
0.6
|
0.31
|
0.38
|
|
|
|
PC18
|
0.35
|
0.25
|
0.61
|
0.34
|
0.34
|
0.39
|
|
|
PC23
|
0.3
|
0.27
|
0.49
|
0.26
|
0.21
|
0.2
|
0.33
|
Since all the parameters are in place. These measures of fit indicate that the model
provides a good fit to the data. Since this is one factor model so all the variables
are strongly suggest only one variable that is price sensitivity of the consumer.
Managerial Implications
This study discusses the role of price sensitivity in today’s scenario and establishes
relationship of pricing with various variables and their relative importance for
buyer while making the buying decision in FMCG industry. This research is also addressing
the precedence of the Factor Budget on all the other factors, which indicates during
pricing process, due consideration should be given to budgeting aspect of consumer’s
buying decision process.
Researcher’s endeavor is to help managers by finding out variables having significant
bearing on the buyer’s decision making process while buying personal care and grocery
category. Thus, manager will be able to design the retail format keeping a purview
and finding of this study.
As the finding suggests there could be three major factors in assessing the consumers’’
price sensitivity namely budget, price and the comparison. It may lead to some practical
and interesting insight into Indian consumer’s buying pattern.
Firstly, customer is more discerning as the finding suggests - budget and price
are two more important factors viz.-a-viz. “comparison” as a factor, which means
– while taking decision Indian customer is concerned with their monthly budget for
respective categories.
As it is evident that budget for monthly shopping is big bracket in this country.
Indian consumer is shopping for all kind of products available, so there is probability
in upgrading the consumer from one platform (in terms of price point) to another.
Importance of budget and price factors also indicates that Indian consumer is more
value driven rather than communication, since comparison as a factor is not in the
high priority for buying decision in most of the situations, therefore, the RTB
i.e. reason to buy communication should revolve around value vis-à-vis any other
driver.
Scope for further study
The study can be extended to other sectors as the brands are now-a-days getting
commoditized, as a result price sensitivity is increasing across all the product
categories and even in service sector too.
With the exhibiting behavior, further study could be conducted to design an absolute
product or place proposition in line with the consumer preferred factors such as
Budget, Price, Comparison and availability.
References
· Anuradha Devadas, a. H. (2011). Shopping behavior of rural consumer migrated to
urban.African Journal of Business Management , 5(6), 2276-2282.
· Blackwell, R. D., Miniard, P. W., & F.Engel, J. (2007). Consumer Behavior,
10e (1st Indian Reprint ed.). Kundli, Haryana, India: Thomson Learning.
· bsaikrishna. (2012, December 15). Price Sensitivity Model. Retrieved May 5, 2012,
from A Wordpress Website: http://brandalyzer.wordpress.com
· Capon, N. (2009). Capon's Marketing Framework. (L. Maize, Ed.) Bronxville, Newyork,
United States: Wessex.inc.
· Dr.Sanjeev Gupta, P. M. (2010). An Impirical Analysis of the Factors Influencing
the Purchase behaviour of Micro-Brands. Interdisciplinary Journal of Contemporary
Research in Business , 2 (No.6), 433-450.
· E.Kahn, B., & Raju, J. S. (1991). Effects of Price Promotions on Variety -
Seeking and Reinforcement Behavior. Marketing Science , 10 (4), 316.
· G. Vani, M. G. (December). Toothpaste Brands – A Study of consumer behavior in
Bangalore city. Journal of Economics and Behavioral Studies , 1 (No.1), 27-39.
· Harmon, R., Unni, R., & Anderson, T. (2007, Aug 5-9). "Price Sensitivity
Measurement and New Product Pricing: A Cognitive Response Approach,". Management
of Engineering and Technology , 1961-1967.
· Home:Urban Consumer Markets of India: The Wall Street Journal. (2010, September
13). Retrieved March 27, 2012, from The Wall Street Journal: http://www.livemint.com/2010/09/12193548/Urban-Consumer-Markets-of-
Indi.html?atype=tp
· http://en.wikipedia.org : Article : Consumer behaviour. (2012, February 24). Retrieved
March 27, 2012, from http://en.wikipedia.org: http://en.wikipedia.org
· IBEF. (2012, March). Indian Brand Equity Foundation Industry > Retail. Retrieved
March 20, 2012, from Indian Brand Equity Foundation: http://www.ibef.org/artdispview.aspx?in=63&art_id=31194&cat_id=376&page=1
· Indian Brand Equity Foundation>Urban Market>Indian Urban market>A Bief
Overview. (2012, February). Retrieved March 27, 2012, from An IBEF Website: http://www.ibef.org/artdispview.aspx?art_id=31123&cat_id=788&in=79
· Lewis, R. C., & Shoemaker, S. (1997, April). Price-Sensitivity Measurement
A Tool for the Hospitality Industry. Cornell HOTEL AND RESTAURANT ADMINISTRATION
QUARTERLY, 44-54.
· Majumdar, R. (2010). Consumer Behaviour: Insights From Indian Market. In R. Majumdar,
Consumer Behaviour: Insights From Indian Market (p. 350). New Delhi, India: PHI
Learning Private Limited.
· Moneycontrol. (2011, December 20). Retrieved May 5, 2012, from A Moneycontrol
Website:http://www.moneycontrol.com
· Parikh, D. (2006). Measuring Retail Service Quality:An Empirical Assessment of
the Instrument. Vikalpa-The Journal of Decision Makers , 31 (2), 45-54.
· Rao, T. R. (1969). Consumers' Purchase Decision Process: Stochastic Model. Journal
of Marketing Research , VI (6), 321-329.
· Robert Draeger. (2000). Measuring and analyzing Price Sensitivity By Level of
Product Usage. The Journal of Professional Pricing , 21-24.
· Robin Raffard. Decomposing Price Sensitivity. Nomis Solutions.
· Roger Mose, N. M. (2010, July). Home ›› July 2010 ›› Marketing ›› Understanding
the Indian retail consumer. Retrieved March 27, 2012, from ideas & insights
from the Indian Institute of Management Bangalore: http://www.iimb.ernet.in/newsletter/issues/57
· Ruth N.Bolton, V. S. (2006, 2007). Recent Trends and Emerging Practices in Retail
Pricing. New York:: Manfred Krafft and Murali Mantrala (Eds.),.
· Sethuraman, R., & Cole, C. (1999). Factors Influencing the Price Premiums
That Consumers Pay for Nathional Brand Over Store Brands. Journal of Product &
Brand Management , 8 (No.4), 340-351.
· Sinha, N. D. (2005, January). Observations on Observation in India's Dynamic Urban
Markets. Retrieved March 27, 2012, from FORUM: QUALITY SOCIAL RESEARCH: http://www.qualitative-research.net/index.php/fqs/article/view/519/1124
· Speedy Growth in FMCG Segment Expected. (2011, November 16). Retrieved May 5,
2012, from India Today: http://indiatoday.intoday.in
· Urbania, A. A. (1997). Psychological Testing. New Delhi, New Delhi, India: PHI
Learning Private Limited.
· Zeithaml, V. A. (1988). Consumer Perceptions of Price, Quality & Value: A
Means-End Model and Synthesis of Evidence. Journal of Marketing , 52, 2-22.

