The Status of Financial Inclusion in Nepal
|
Bharat Ram Dhungana
Assistant Professor
School of Business
Pokhara University, Nepal
|
Dr. Prashant Kumar
Professor
Faculty of Commerce
BHU, Varanasi, India
|
Abstract
The objective of the paper is to examine the status of financial inclusion in
Nepal. The study is based on secondary data to analyse the financial inclusion led
by banks and financial institutions and 'D class' micro-finance institutions. The
status of financial inclusion in Nepal is not satisfactory and majority of people
have still no bank accounts at the formal financial institutions. The financial
inclusion led by banks and financial institutions as well as 'D class' MFIs shows
that far-western and mid-western development region has poor penetration of formal
financial services as compared to other development region due to complex geographical
location and lack of basic infrastructure. MF industry is necessary to develop as
a tool of inclusive financial market through the wider expansion of its services
in remote rural and hilly areas of Nepal. T he government should provide
enough supports to develop financial infrastructure, sound MF policies, strengthening
regulatory authority, and inclusive economic growth that will help to build-up inclusive
financial environment in the nation.
Keywords: Financial Inclusion, Financial Institutions,
Micro-Finance, Regulatory Authority.
Introduction
Financial inclusion has become a significant issue in developing countries like
Nepal where the large number of people are still far from the access of formal banking
services. It is a major aspect of finance that covers various financial services
such as savings, insurance, payments, and remittance facilities to those who have
been excluded by formal financial system. Marginalized and vulnerable people, who
have been exploited by informal lending system and no capacity to pledge any physical
collateral for the loan, are the major target of financial inclusion. M icro-finance
is an important tool in connecting the unbanked population into a formal financial
system. Higher financial inclusion facilitates the economic development of nation
through capital formation and savings mobilization into productive sectors.
Financial inclusion refers to the access of financial products and services to
the people who are geographically backward, socially marginalised, and financially
poor. Financial products and services include broad range of services having financial
awareness, knowledge about banks and banking services, and high access of financial
services offered by the banking institutions such as savings, short and long-term
credit, insurance, pensions, payments, local money transfers, and international
remittances. An inclusive financial system can provide wide access of financial
services to the poor.
There are various ways to measure the financial inclusion out of which, outreach
dimension and actual usage dimension are more common in practice. The outreach dimension
can be measured by two types of indicator i.e. geographical penetration and demographic
penetration. Geographical penetration of financial inclusion deals with the bank
branches and ATMs per thousand square kilometers and it indicates that smaller distances
to the nearest physical bank outlets ensure easier geographical access. Demographic
penetration measures the average number of people served by each bank branch and
ATM. Higher numbers imply that there are fewer clients per branch and ATM that indicates
easier access of banking services.
The actual usage dimension of financial inclusion can be measured in terms of
users of banking services or access to financial services, and the ratio of deposits
to GDP or credit to GDP or deposit plus credit to GDP. The number of loan accounts
per thousand people and the number of deposit accounts per thousand people are the
major indicators of the actual usage dimension of financial inclusion. The measurement
of financial inclusion largely depends on the level of development of a country
and varies across countries and the regions.
In most developing economies, financial services are only available to a minority
of the population, frequently to only a very small minority. Although financial
sectors are expanding as these economies grow, financial assets usually remain highly
concentrated in the hands of a few. The majorities of the people in developing countries
have no savings accounts, do not receive credit from a formal financial institution,
and have no insurance policies (United Nations, 2006).
Objectives of the Study
The objective of paper is to assess the status of financial inclusion in Nepal.
The financial inclusion has been measured in terms of zone wise and region wise
led by banks and financial institutions as well as 'D class' micro-finance institutions.
The followings are the specific objectives of the study:
I . To assess the financial inclusion led by banks and financial
institutions.
II. To measure the financial inclusion led by 'D class' micro-finance
institutions.
III. To evaluate the outreach performance of micro-finance
industry.
Sources of Data
This study is based on secondary data published by Nepal Rastra Bank (Central
Bank of Nepal) and Global Findex Data (World Bank).
Statistical Tools
The descriptive statistics has been used to analyse the status of financial inclusion
in Nepal.
Review of Literature
The study made by Allen, Demirguc-Kunt, and et al. (2012) found that greater financial
inclusion is associated with a better enabling environment to access financial services,
such as lower banking costs, greater proximity to branches, and fewer documentation
requirements to open an account. Policies targeted to promote inclusion- such as
government requirements to offer basic or low-fee accounts, exempting small or rural
depositors from onerous documentation requirements, and the use of bank accounts
for government payments, are especially effective among rural residents and the
poor.
Bangladesh government has been pursuing inclusive socio-economic growth aiming
at well-being for all outlined in its five year and annual development plans. To
cover about one-fifth of adult population who could not get any financial services
from any regulated and supervised financial institutions, MFIs and cooperatives,
Bangladesh bank's policy is to encourage MFIs for initiating cost saving innovative
partnerships and for introducing technology based financial services. Institute
of Micro-finance conducted a survey on 'Access to financial services in Bangladesh'
in 2011 found that the aggregate access to any financial services stood at 76.8
percent of which access to formal services is about 37.0 percent and access to quasi-formal
(MFIs and co-operatives) is about 43.0 percent (Islam and Mamun, 2011).
A growing body of research shows that financial inclusion can have significant
beneficial effects for individuals, providing both an economic and a political rationale
for policies that promote financial inclusion. The literature has found
that providing individuals with access to savings instruments increases savings
(Aportela, 1999; Ashraf et al., 2010a), productive investment (Dupas and Robinson,
2009), consumption (Dupas and Robinson, 2009; Ashraf et al., 2010b), and
female empowerment (Ashraf et al., 2010b).
Development theory provides important clues about the impact of financial inclusion
on economic development. Available models illustrate how financial exclusion, and
in particular, lack of access to finance can lead to poverty traps and inequality
(Aghion and Bolton, 1997; Banerjee and Newman, 1993; Galor and Zeira, 1993). The
micro-finance and financial inclusion model provides a framework to enhance the
financial inclusion to the people those who are under the involuntary exclusion.
The financial inclusion model has been presented in the following figure:
Figure 1: Financial Inclusion Model
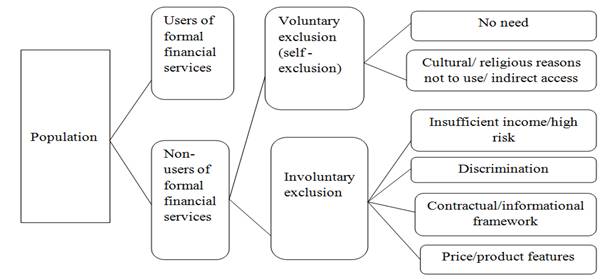
Source: Demirguc-Kunt, Beck, and Honohan, 2008.
There are two types of population in terms of financial inclusion i.e. users of
formal financial services and non-users of formal financial services. The non-users
of formal financial services are voluntary and involuntary exclusion. The voluntary
exclusion people do not use financial services for cultural and religious reasons
or because they do not see any need. Among the involuntarily excluded,
there is a group of households and enterprises that are considered un-bankable by
commercial financial institutions and markets because they do not have enough income
or present too high a lending risk. There might be discrimination against certain
population groups based on social, religious, or ethnic grounds. The contractual
and informational framework might prevent financial institutions from reaching out
to certain population groups because the outreach is too costly to be commercially
viable. Finally, the price of financial services may be too high or the product
features might not be appropriate for certain population groups.
Financial Inclusion: A Global Scenario
The level of financial inclusion varies widely around the world. More than 2.5
billion adults, about half of the world adult population does not have an account
with a formal financial institution. Not all the 2.5 billion unbanked need financial
services, but barriers such as cost, travel distance, and documentation requirements
are critical. The account penetration differs extremely between high-income
and developing economies. More than 99.0 percent of adults in Denmark have a formal
account while virtually none do in Niger (The World Bank, 2012). The account penetration
of adults (having the age of 15 years and above) at formal financial institutions
has been exhibited in the following table:
Table 1: Account Penetration: Adults with an Account at Formal Financial Institutions
|
S. N.
|
Region
|
Bank Account (Percent of People)
|
No Bank Account (Percent of People)
|
|
1.
|
High Income Economies
|
89.0
|
11.0
|
|
2.
|
East Asia and Pacific
|
55.0
|
45.0
|
|
3.
|
Europe and Central Asia
|
45.0
|
55.0
|
|
4.
|
Latin America and Caribbean
|
39.0
|
61.0
|
|
5.
|
South Asia
|
33.0
|
67.0
|
|
6.
|
Sub Saharan Africa
|
24.0
|
76.0
|
|
7.
|
Middle East and North Africa
|
18.0
|
82.0
|
Source: The World Bank, The Global Findex Database, 2012.
The Middle East and North Africa has the lowest account penetration with only
18.0 percent people. In several economies around the world including Cambodia, the
Democratic Republic of Congo, Guinea, the Kyrgyz Republic, Turkmenistan, and the
Republic of Yemen, more than 95.0 percent of adults do not have still an account
at a formal financial institution (The World Bank, 2012).
The scenario of financial inclusion in South Asia has been exhibited in the following
table:
Table 2: Financial Inclusion in South Asia
(Percent)
|
S. N.
|
Name of Country
|
Account at Formal Financial Institutions
|
Women Account at Formal Financial Institutions
|
|
1
|
Afghanistan
|
9.0
|
3.0
|
|
2
|
Bangladesh
|
40.0
|
35.0
|
|
3
|
Bhutan
|
NA
|
NA
|
|
4
|
India
|
35.0
|
26.0
|
|
5
|
Maldives
|
NA
|
NA
|
|
6
|
Nepal
|
25.0
|
21.0
|
|
7
|
Pakistan
|
10.0
|
3.0
|
|
8
|
Sri Lanka
|
69.0
|
67.0
|
Source: The World Bank, The Global Findex Database, 2012 .
The financial inclusion in South Asia is not also satisfactory. The account penetration
in this region is only 33.0 percent and still two third people have no bank accounts
at formal financial institutions. The status of financial inclusion in
Afghanistan and Pakistan is seen very poor in South Asia. It shows that 91.0 percent
still do not have bank account at formal financial institutions in Afghanistan where
as 90.0 percent in the case of Pakistan. Sri Lanka has the highest level of financial
inclusion in the South Asia. The account penetration of women is also significantly
lower in Afghanistan and Pakistan as compared to the other members of the region.
Enhancing financial inclusion requires the policy and market problems that lead
to financial exclusion to be addressed. The government and regulatory bodies should
give adequate attention to achieve this goal by developing an appropriate legal
and regulatory framework and supporting the information environment as well as by
educating and protecting the users of financial services.
The Status of Financial Inclusion in Nepal
The financial inclusion is a serious issue in the context of developing countries
like Nepal. The status of financial inclusion in Nepal is not satisfactory and three-fourth
(75.0 percent) of the people still has no bank accounts at the formal financial
institutions. The development region-wise and zone-wise financial inclusion led
by banks and financial institutions as well as led by 'D class' MFIs have been studied
to explore the status of financial inclusion in Nepal.
Region-wise Financial Inclusion Led by Banks and Financial Institutions
The region-wise financial inclusion led by banks and financial institutions
for mid-July, 2013 has been presented in table 3.
Table 3: Region-wise Financial Inclusion Led by Banks and Financial Institutions
|
S. N.
|
Dev. Region
|
Branches
|
Total Population
|
Population per Branch
|
|
No.
|
Percent
|
No.
|
Percent
|
|
1
|
Eastern
|
570
|
18.2
|
5,811,555
|
21.9
|
10,196
|
|
2
|
Central
|
1,411
|
45.0
|
9,656,985
|
36.4
|
6,888
|
|
3
|
Western
|
725
|
23.1
|
4,926,765
|
18.6
|
6,795
|
|
4
|
Mid Western
|
278
|
8.8
|
3,546,682
|
13.5
|
12,758
|
|
5
|
Far Western
|
154
|
4.9
|
2,552,517
|
9.6
|
16,575
|
|
Total
|
3,138
|
100.0
|
26,494,504
|
100
|
8,443
|
Source: Banking and Financial Statistics, NRB, Mid July 2013.
The number of branches in central development region is very high (45.0 percent)
as compared to other development region. The far western development region has
the lowest number of branches (4.9 percent) of banks and financial institutions
whereas mid western development region has 8.8 percent. Similarly, the population
per branch in western development region is lower (6,795) whereas this proportion
in far western development region is very high (16,575). The study shows that financial
inclusion led by banks and financial institutions in western development region
is better. But in the case of far western and mid western development region, the
status of financial inclusion is very poor. Due to complex geographical location
and lack of basic infrastructure, there is limited number of banks and financial
institutions in the region. The government and regulatory authority should give
adequate attention regarding the enhancement of financial inclusion towards these
geographical regions.
Zone-wise Financial Inclusion Led by Banks and Financial Institutions
The financial access has increased with the expansion of network of financial
institutions. As per mid-July 2013, the total number of banks and financial institutions
stood at 207 which include 31 commercial banks, 86 development banks, 59 finance
companies and 31 micro-finance institutions. The numbers of deposit accounts and
borrowers in A, B and C class financial institutions were about 11.1 million and
845,000 respectively. Total depositors and borrowers in micro-finance institutions
are about 1.16 million and 849,000 respectively (Economic Survey, 2013).
The banks and financial institutions include commercial banks (class A), development
banks (class B), finance companies (class C), and micro-finance development banks
(class D). The zone-wise financial inclusion led by banks and financial institutions
for mid-July, 2013 has been presented in table 4.
Table 4: Zone-wise Financial Inclusion Led by Banks and Financial Institutions
|
S. N.
|
Dev. Region
|
Zone
|
Class A
|
Class B
|
Class C
|
Class D
|
Total
|
Population
|
Population per Branch
|
|
1.
|
Eastern
|
Mechi
|
74
|
30
|
8
|
58
|
170
|
1,422,182
|
8,366
|
|
2.
|
Koshi
|
137
|
64
|
15
|
66
|
282
|
2,335,047
|
8,280
|
|
3.
|
Sagarmatha
|
61
|
13
|
4
|
40
|
118
|
2,054,326
|
17,410
|
|
4
|
Central
|
Janakpur
|
71
|
35
|
4
|
69
|
179
|
2,837,481
|
15,852
|
|
5
|
Narayani
|
138
|
112
|
22
|
101
|
373
|
2,975,908
|
7,978
|
|
6
|
Bagmati
|
527
|
157
|
112
|
63
|
859
|
3,843,596
|
4,475
|
|
7
|
Western
|
Gandaki
|
110
|
115
|
32
|
47
|
304
|
1,549,857
|
5,098
|
|
8
|
Lumbini
|
123
|
124
|
30
|
77
|
354
|
2,834,612
|
8,007
|
|
9
|
Dhavalagiri
|
29
|
25
|
5
|
8
|
67
|
542,296
|
8,094
|
|
10
|
Mid Western
|
Rapti
|
46
|
32
|
4
|
34
|
116
|
1,456,202
|
12,553
|
|
11
|
Karnali
|
13
|
0
|
0
|
3
|
16
|
388,713
|
24,295
|
|
12
|
Bheri
|
70
|
33
|
4
|
39
|
146
|
1,701,767
|
11,656
|
|
13
|
Far Western
|
Seti
|
53
|
13
|
2
|
24
|
92
|
1,575,003
|
17,120
|
|
14
|
Mahakali
|
34
|
11
|
0
|
17
|
62
|
977,514
|
15,766
|
|
Total
|
1,486
|
764
|
242
|
646
|
3,138
|
26,494,504
|
8,443
|
Source: Banking and Financial Statistics, NRB, Mid July 2013.
As of mid-July 2013, the branch network of commercial banks reached 1,486, development
banks 764, finance companies 242 and micro-finance development banks 646. As a result,
in mid-July 2013, each branch has covered approximately 8,443 population on an average.
There is poor outreach of banks and financial institutions in Karnali zone (24,295
population per branch), Sagarmatha zone (17,410 population per branch), Seti zone
(17,120 population per branch), Janakpur zone (15,852 population per branch), and
Mahakali zone (15,766 population per branch). The study shows that there is imbalanced
regional development of financial institutons in Nepal. The government and regulatory
authority should give proper attention to maintain regionally balanced financial
inclusion in the region.
Region-wise Financial Inclusion Led by D Class Micro-finance Institutions
The region-wise financial inclusion led by 'D class' MFIs for mid-July, 2013 has
been presented in table 5.
Table 5: Region-wise Financial Inclusion Led by D Class Micro-finance Institutions
|
S. N.
|
Dev. Region
|
Branches
|
Total Population
|
Population per Branch
|
|
No.
|
Percent
|
No.
|
Percent
|
|
1
|
Eastern
|
164
|
25.4
|
5,811,555
|
21.9
|
35,436
|
|
2
|
Central
|
233
|
36.1
|
9,656,985
|
36.4
|
41,446
|
|
3
|
Western
|
132
|
20.4
|
4,926,765
|
18.6
|
37,324
|
|
4
|
Mid Western
|
76
|
11.8
|
3,546,682
|
13.5
|
46,667
|
|
5
|
Far Western
|
41
|
6.3
|
2,552,517
|
9.6
|
62,256
|
|
Total
|
646
|
100
|
26,494,504
|
100
|
41,013
|
Source: Banking and Financial Statistics, NRB, Mid July 2013.
The branches of 'D class' MFIs are more located in central development region (36.1
percent) whereas lower in far western (6.3 percent) and mid western development
region (11.8 percent). Similarly, the population per branch of 'D class' MFIs is
lower in eastern development region (35,436) and higher in far western development
region (62,256). The region-wise financial inclusion led by 'D class' MFIs shows
that far western and mid western development region has poor penetration of MF services
as compared to other development region. The reason behind poor financial inclusion
is due to complex geographical location and tendency of locating the branches in
urban and city areas where road facilities and other basic services are available.
The government should develop basic financial infrastructure to expand formal financial
services especially in remote rural and hilly areas.
Zone-wise Financial Inclusion Led by D Class Micro-finance Institutions
The zone-wise financial inclusion led by 'D class' micro-finance institutions for
mid-July, 2013 has been presented in table 6.
Table 6: Zone-wise Financial Inclusion Led by D Class Micro-finance Institutions
|
S. N.
|
Dev. Region
|
Zone
|
Branches
|
Population
|
|
Numbers
|
Percent
|
Total
|
Per Branch
|
|
1.
|
Eastern
|
Mechi
|
58
|
9.0
|
1,422,182
|
24,520
|
|
2.
|
Koshi
|
66
|
10.2
|
2,335,047
|
35,380
|
|
3.
|
Sagarmatha
|
40
|
6.2
|
2,054,326
|
51,358
|
|
4
|
Central
|
Janakpur
|
69
|
10.7
|
2,837,481
|
41,123
|
|
5
|
Narayani
|
101
|
15.6
|
2,975,908
|
29,464
|
|
6
|
Bagmati
|
63
|
9.8
|
3,843,596
|
61,009
|
|
7
|
Western
|
Gandaki
|
47
|
7.3
|
1,549,857
|
32,976
|
|
8
|
Lumbini
|
77
|
11.9
|
2,834,612
|
36,813
|
|
9
|
Dhavalagiri
|
8
|
1.2
|
542,296
|
67,787
|
|
10
|
Mid Western
|
Rapti
|
34
|
5.3
|
1,456,202
|
42,829
|
|
11
|
Karnali
|
3
|
0.5
|
388,713
|
129,571
|
|
12
|
Bheri
|
39
|
6.0
|
1,701,767
|
43,635
|
|
13
|
Far Western
|
Seti
|
24
|
3.7
|
1,575,003
|
65,625
|
|
14
|
Mahakali
|
17
|
2.6
|
977,514
|
57,501
|
|
Total
|
646
|
100.0
|
26494,504
|
41,013
|
Source: Banking and Financial Statistics, NRB, Mid July 2013.
The branches of 'D class' MFIs are higher in Narayani zone (15.6 percent) whereas
lower in Karnali zone (0.5 percent). Similarly, Dhavalagiri zone (1.2 percent),
Mahakali zone (2.6 percent), and Seti zone (3.7 percent) have lower number of branches
of 'D class' MFIs as compared to the other zones. The population per branch of 'D
class' MFIs is lower in Mechi zone (24,520) whereas this proportion is higher in
Karnali zone (129,571). The zone-wise financial inclusion led by 'D class' MFIs
shows that Karnali zone, Dhavalagiri zone, and Seti zone has poor penetration of
micro-finance services as compared to other zones of Nepal. The reason behind the
poor financial inclusion in the region is difficult topography and lack of basic
infrastructure. Thus, government and regulatory authority should develop inclusive
financial environment in the nation.
Outreach Performance of Micro-finance Industry
The outreach performance measures the institutional coverage and their access of
services to the people. Higher outreach indicates the ability of MFIs to maintain
financial coverage to a large number of clients. The outreach dimension may include
both geographical and demographic penetration of services. It includes district
coverage, number of branches, number of members, number of savers, number of borrowers,
and so on. Higher outreach performance indicates greater degree of social performance
of the institution and vice-versa. The outreach performance of Micro-finance Industry
for the year January, 2014 has been presented in table 7.
|
Table 7: Outreach Performance of Micro-finance Industry in Nepal
|
|
Indicators
|
GMFIs
|
PMFIs
|
WLMFIs
|
Total
|
|
No.
|
%
|
No.
|
Percent
|
No.
|
%
|
No.
|
|
District coverage to target district
|
-
|
80.0
|
-
|
60.0
|
-
|
90.0
|
76.7
|
|
No. of branches
|
170
|
21.9
|
597
|
76.8
|
10
|
1.3
|
777
|
|
No. of members
|
190,089
|
13.4
|
890,715
|
63.0
|
333,279
|
23.6
|
1,414,083
|
|
No. of borrowers
|
136,941
|
13.3
|
678,691
|
65.9
|
214,623
|
20.8
|
1,030,255
|
|
No. of savers
|
150,902
|
13.7
|
947,736
|
86.3
|
0
|
0.0
|
1,098,638
|
Source: Monthly Statistics of NRB, Mid January 2014 .
The outreach performance of Nepalese MF industry shows that 'D class' MFIs have
76.7 percent district coverage to target district ratio. The outreach performance
in terms of number of branches, members, borrowers, and savers of private MFIs is
significantly high as compared to the government MFIs and wholesale lending MFIs.
Although district coverage of MFIs is high (76.7 percent), its services have not
been extended in remote rural areas. The MF services are basically confined in the
surrounding areas of district headquarters, city, and towns where road and basic
amenities are available. The inclusive financial system should be developed in the
nation that will help in expanding formal financial services to the marginalized
and poor people.
Role of Government for Financial Inclusion in Nepal
Financial inclusion has become an emerging issue in developing countries like Nepal
because mass number of people is still deprived from formal banking services. The
existing financial system has excluded the marginalized and vulnerable people of
rural community and they have been still exploited by the informal lending system.
The commercial banks and other formal financial institutions demands physical collateral
security for the loan and the poor people are unable to pledge such collateral.
The MFIs provide collateral-free micro-credit to the people who are excluded by
the formal financial institutions. Therefore, MF industry is necessary to develop
as a tool of inclusive financial market through the wider expansion of its services
in remote rural and hilly areas of Nepal.
Building inclusive financial system, in fact, is a challenging task of the government
and regulatory authority for which high degree of efforts and commitment is essential.
Inclusive financial environment provides opportunities of formal financial services
to the people living in the rural part of the country. Micro-finance is an appropriate
way of reaching to the poor and marginalised people. Moreover, it helps to bring
socio-economic transformation of the people through micro-business and enterprises
generation. MF services encourage the people to participate fully in the economic
life of their societies, create employment for them/others, and realize their full
potential. Once the level of income increases after MF intervention, they may utilize
their earnings on better nutrition, housing, health, and educational expenditure
to enhance socio-economic status. Government can build inclusive financial system
through the following three major ways:
I. The Government has to deliver financial services directly and indirectly,
often by disbursing credit to preferred groups and developing a good mechanism for
managing resources to the financial institutions through wholesale arrangements.
Governments are not good at offering credit directly to poor people, although government
banks can expand their outreaches to maintain financial inclusion over the rural
part of the country.
II. The Government has to develop and implement new plans and policies in
the financial system that may help to build-up inclusive financial system. These
policies may include ensuring macro-economic stability, liberalizing interest rates,
encouraging banking and financial institution to the remote rural areas, and establishing
effective banking regulation and supervision that make viable micro-finance services.
III. The Government has to promote inclusion by offering fiscal incentives
to serve poor and low-income people.
A sound financial system plays a significant role to promote financial inclusion
in the nation. The role of government is to ensure wider access of financial services
to the people who are deprived from the formal financial services. Thus, government
and regulatory authority should play supportive role to maintain inclusive financial
environment in the nation through appropriate management of basic infrastructure,
sound MF policies, strengthening MFIs, and other necessary supports.
Conclusion and Suggestions
The financial inclusion has become a serious issue in the context of developing
countries like Nepal. The status of financial inclusion in Nepal is not satisfactory
and three-fourth (75.0 percent) of the people still has no bank accounts at the
formal financial institutions (World Bank, 2012). Due to complex geographical location
and lack of basic infrastructure, there is limited number of banks and financial
institutions in mid-western and far-western development region. MF services are
basically confined in the surrounding areas of district headquarters, city, and
towns where road and basic amenities are available. MF industry is necessary to
develop as a tool of inclusive financial market through the wider expansion of its
services in remote rural and hilly areas of Nepal. The government and regulatory
authority should give adequate attention regarding the enhancement of financial
inclusion towards these geographical regions.
Inclusive economic growth has been one of the priority agenda in developing countries
like Nepal. It is widely acknowledged that inclusive economic growth cannot be accomplished
without achieving financial inclusion. In fact, building inclusive financial system
is a challenging task that requires high degree of efforts and commitment. Unless
government adequate support is available, financial inclusion will remain poor in
the nation. So, the government should provide enough supports to develop financial
infrastructure, sound MF policies, strengthening regulatory authority, and inclusive
economic growth that will help to build-up inclusive financial environment in the
nation.
Building inclusive financial sector improves the livelihood status of the people
through productive application of micro-credit. A small loan, a savings account
or an insurance policy can make a great difference to a low-income family. They
enable people to invest in better nutrition, housing, health and education for their
children. Since there is poor financial inclusion basically in rural and hilly areas,
so, high degree of efforts and investment is necessary to scale-up its operation
to the majority people.
References
Aghion, P., & Bolton, P. (1997). A theory of trickle-down growth and development.
Review of Economics Studies, 64 (2): 151–72.
Allen, F., Demirguc-Kunt, & et al. (2012). The foundations of financial inclusion:
Understanding ownership and use of formal accounts. Policy Research Working Paper,
WPS 6290, The World Bank, Development Research Group, 1-59.
Aportela, F. (1999). Effects of financial access on savings by low-income people.
Unpublished Dissertation, MIT Department of Economics.
Ashraf, N., Aycinena, C., Martinez, A., & Yang., D. (2010). Remittances and
the problem of control: A field experiment among migrants from El Salvador. Mimeo.
Ashraf, N., Karlan, D., & Yin, W. (2010). Female empowerment: Further evidence
from a commitment savings product in the Philippines. World Development,
28 (3): 333-44.
Banerjee, A., & Newman, A. (1993). Occupational choice and the process of development.
Journal of Political Economy, 101(2): 274-98.
Demirgüç-Kunt, A., Beck, T., & Honohan, P. (2008). Finance for all? Policies
and pitfalls in expanding access. World Bank Policy Research Report, The
World Bank, Washington, DC.
Dupas, P., & Robinson, J. (2009). Savings constraints and micro-enterprise development:
Evidence from a field experiment in Kenya. National Bureau of Economic Research
Working Paper 14693.
Galor, O., & Zeira, J. (1993). Income distribution and macro-economics. Review
of Economics Studies, 60 (1): 35–52.
Islam, M. E., & Mamun, M. S. A. (2011). Financial inclusion: The role of Bangladesh
bank. Working Paper Series: WP 1101, Research Department, Bangladesh Bank,
1-21.
Ministry of Finance (2013). Economic survey for the fiscal year 2012/13. Ministry
of Finance, Kathmandu, Nepal.
Nepal Rastra Bank (2013). Banking and financial statistics for mid-July 2013. Nepal
Rastra Bank , Kathmandu, Nepal.
The World Bank (2012). Measuring financial inclusion. The global Findex Database,
Policy Research Working Paper, The World Bank Development Research Group Finance
and Private Sector Development Team, 1-58.
Nepal Rastra Bank (2014). Banking and financial statistics (monthly) for mid-January
2014. Nepal Rastra Bank, Kathmandu, Nepal.
United Nations (2006). Building inclusive financial sectors for development.
New York: United Nations.

