IMPACT OF GLOBAL FINANCIAL CRISIS ON SECTORAL COMPOSITION OF FOREIGN INSTITUTIONAL
INVESTMENTS IN INDIA
|
Dr. Rekha Mehta
Associate Professor & Head
Department of Economics
Jai Narain Vyas University
Jodhpur (Rajasthan) 342005
Contact No.- 919314341242 / 7597950281
Email: rekhamehta1960@yahoo.com
|
Akansha Jain
Research scholar
Department of Economics
Jai Narain Vyas University
Jodhpur (Rajasthan)
Contact No.- 91-9460051950
Email: akansha_ritesh@yahoo.com
|
ABSTRACT
In this paper, impact of FII on sectoral composition will be discussed, because
Foreign Institutional Investments have a great impact on Indian market since 1993
but during global financial crises FIIs had shown negative as well as positive impact
in the economy which fluctuate with fluctuating behaviour of FIIs inflows. Therefore,
it is necessary to examine impact of FIIs on different sector of India during 2007
to 2013 and to understand their investment pattern in debt and equity.
Keywords: Foreign Institutional Investments (FII), Global financial
crisis, FIIs Equity and Debt, Effect of FII on different sector.
INTRODUCTION
The role of investment in promoting economic growth has received considerable attention
in India since independence. But role of Foreign Institutional Investment in the
economic growth of India is a recent topic of discussion among economist and development
planner. Economic reform in India since 1991 advocated a progressive liberalisation
of external capital flows especially in non debt creating one such as FII equity
investment. This has led to surge of capital inflow and strengthened Balance of
Payment position.
The term foreign institutional investment is used most commonly in India to refer
to outside companies investing in financial market of India. India received portfolio
investment from investor outside in the form of FII equities in 1993. Under the
regulation prescribed by SEBI (stock exchange board of India) , “FII is an institution
organised outside of India for the purpose of making investment into Indian securities
market”. FIIs includes investment trust, asset management companies, nominee company,
university fund, industrial portfolio manager, charitable trust, charitable societies,
mutual funds, overseas pension funds, endowments, foundation etc.
FIIs generally invest in two ways:
EQUITY INVESTMENT
100% investment could be in equity related instruments or up to 30% could be invested
in debt instruments i.e.70 (Equity Instruments):30 (Debt Instruments).
100% DEBT
100% investment has to be made in debt securities only.
FIIs flow supplement and augmented domestic saving and domestic investment without
increasing foreign debt of our country. The stock market boom is a result of FIIs,
Henry (2000) reports the two possible consequences of market liberalisation in forming
international assets pricing models. First outcome is increase in a country’s equity
prices. The next effect of market liberalisation is on physical investment that
will increase, which leads an increase in the rate of economic growth. Total investment
by foreign institutional investors (FIIs) in equities since January 2014 has risen
to about Rs 28,979 crore ($4.78 billion). FIIs in India has shown substantial growth
during 1992-2014 but during this period, foreign investors withdrew investment from
Indian share market due to global financial crisis which affected FIIs share in
different sector of India.
The global financial crisis of 2008 is the most severe financial crisis that the
world has over faced since the great Depression of 1930s. Foreign portfolio investment
flows bore the most prominent brunt of the global financial meltdown. There was
a net outflow of portfolio investment in the financial year 2008-2009, in US $ term
during 2008-09, FIIS recorded a net outflow of 15 billion as against net inflow
of 20.3 billion in 2007-08. The main reason behind was the bearish market condition
.The financial crisis is characterized by contracted liquidity in the global credit
and housing market, triggered by the failure of mortgage companies, investment banks
and government institution which had heavily invested in subprime loans. Though
the crisis started in 2005-2006 but has become more visible during 2007-2008, when
many of the renowned Wall Street firms collapsed.
The immediate impact of the US financial crisis has been felt when India’s stock
market started falling on 10 October 2008 Rs 250,000 crores was wiped out on a single
day bourses of the India’s share market. The sensex lost 1000 points on that day
before regaining 200 points, an intraday loss of 200 points. This huge withdrawal
from the India’s stock market was mainly by Foreign Institutional Investment and
participatory notes.
However the trend reversed in the first quarter of 2009-10 with a net inflow of
US$ 8.2billion and US$ 7 billion during this period the sharp increase in FII inflow
was beneficial to the recovery in domestic stock market. The impact of global crisis
was observed in other countries like Thailand, Indonesia, Brazil, where outflow
of FII created inflationary pressure just like India.
REVIEW OF LITERATURE
There are tremendous studies that have been conducted so far in the field whether
the FII investment behaviour is reflected in the stock market, at various intervals
of time. Many studies have done across the world mainly related to effect of FII
volatility across various economy as well as Indian economy and the contagion effects
of a financial crisis with granger causality test in which work done by:
Kulwantraj N. Bindu (2004), in his research paper titled 'A study on the
determinants of foreign institutional investment in India and the role of risk,
inflation and return’ had conducted an intensive study to find out the determinants
responsible for the flow of FIIs and their degree of impact. With the help of monthly
data they find out that FII inflow depends on stock market returns, inflation rates
(both domestic and foreign), and ex-ante risk. The study has not found any causative
link running from FII inflow to stock returns.
Karimullah (2009) examined the impact of FIIs equity investment behaviour
in the Indian stock market and found bi-directional causality between FII and stock
return. Garg and Bodla (2009) concluded that the rate of FII flows into the
country is governed by the performance of the domestic stock market and the foreign
investors’ expectations about this performance. More recent work includes that of
Anshuman, Chakrabarti and Kumar (2010) who bring high frequency data and
the powerful tools of market microstructure analysis to address these questions.
They find that the aggregate trading of FIIs dampens the volatility of the Indian
stock market. Furthermore, positive shocks in trading volume have greater impacts
than negative shocks, while trading between FIIs and domestic investors increase
volatility. Borner et al. (2010) examine the behaviour of gross capital flows
of foreigners and domestic investors before and after financial crises. They use
panel data, with annual observations covering 1970-2009 and 103 countries (segmented
by income classes). IMF (2010) includes an event study of the impact of capital
control introductions on 37 “liquidity receiving” countries. The data is quarterly,
and covers 2003:Q1 to 2009:Q2. Bose and Dipankar in their study attempted
to estimate the quantitative impact of certain regulatory policy decision related
to FII investment in India using the technique of intervention analysis of time
series econometrics. Dr. Mamta, Priya Laxmi Meena and Mathur, in their research
paper examined the behavioural pattern of FII during the period of 2001 to 2010
and volatility of BSE, SENSEX due to FII. With this paper they clear that the FII
are influencing the SENSEX movement to greater extent. Dr. M. Venkata Subba Reddy,
Mahammed Saleem(2013), in their research paper examine the impact of FII’s
on Indian Stock Markets. The important result of their study is that foreign investment
is determined by stock market return. But foreign investment is not a major factor
for the stock market boom in India the FII are increasingly dominant in the stock
market. The fear of sudden outflow of foreign capital may be a trigger a third stock
market scam as most regulatory changes are being made only as a follow up of an
adverse event.
OBJECTIVE OF THE STUDY
An attempt has been made:
· To understand the investment pattern of FII in India during global financial crisis.
· To analysis the Foreign Institutional Investments (FIIs) trend in debt and equity.
· To study the impact of FIIs on different sector due to financial crisis.
DATA COLLECTION AND RESEARCH METHODOLOGY
To achieve the objective of the study, the secondary data has been collected from
www.bseindia.com ,
www.nseindia.com , www.sebi.gov.in
, www.rbi.org.in for a period ranging from 2001
to 2014 ( before and after global financial crisis). Besides the websites mentioned
above various publications of SEBI, BSE, RBI & Economic Political weekly, etc.
has been used. The Data has been classified & tabulated using Ms- Excel. Diagrams
are used as statistical tool for data analysis
FII INVESTMENT PATTERN IN INDIA
India’s capital account has been liberalized over the year with a carefully calibrated
approach, so as to attract long-term , non- debt creating capital inflows. For this
purpose , FIIs were allowed In India to invest in equity and debt market since1992.
The investment pattern of FIIs in India have been changed over a period of time.
As FIIs invested around Rs 79,709 crore (US$ 13.23 billion) in the country’s equity
market in 2014, according to data released by the Securities and Exchange Board
of India (SEBI). During the year, foreign investors invested majorly in domestic
equities markets as Indian equity markets gave some of the best returns among emerging
countries, as per market analysts.
TABLE -1
|
FII Investments - Financial Year
|
|
INR crores
|
|
Financial Year
|
Equity
|
Debt
|
Total
|
|
1992-93
|
13
|
0
|
13
|
|
1993-94
|
5,127
|
0
|
5,127
|
|
1994-95
|
4,796
|
0
|
4,796
|
|
1995-96
|
6,942
|
0
|
6,942
|
|
1996-97
|
8,546
|
29
|
8,575
|
|
1997-98
|
5,267
|
691
|
5,958
|
|
1998-99
|
-717
|
-867
|
-1,584
|
|
1999-00
|
9,670
|
453
|
10,122
|
|
2000-01
|
10,207
|
-273
|
9,933
|
|
2001-02
|
8,072
|
690
|
8,763
|
|
2002-03
|
2,527
|
162
|
2,689
|
|
2003-04
|
39,960
|
5,805
|
45,765
|
|
2004-05
|
44,123
|
1,759
|
45,881
|
|
2005-06
|
48,801
|
-7,334
|
41,467
|
|
2006-07
|
25,236
|
5,605
|
30,840
|
|
2007-08
|
53,404
|
12,775
|
66,179
|
|
2008-09
|
-47,706
|
1,895
|
-45,811
|
|
2009-10
|
1,10,221
|
32,438
|
1,42,658
|
|
2010-11
|
1,10,121
|
36,317
|
1,46,438
|
|
2011-12
|
43,738
|
49,988
|
93,726
|
|
2012-13
|
1,40,033
|
28,334
|
1,68,367
|
|
2013-14
|
79,709
|
-28,060
|
51,649
|
Source: SEBI
FIIs bought debt securities worth Rs 8,155 crore (US$ 1.35 billion) and sold bonds
to the tune of Rs 4,609 crore (US$ 765.69 million) in the period January 1–10, 2014,
which resulted in a net inflow of Rs 3,546 crore (US$ 589.10 million), according
to data provided by SEBI. Their total investment in debt and equity in the period
was about Rs 4,091 crore (US$ 679.49 million) in January 2014. The table given above
is providing the detail of FIIs investment in India from 1992 to 2014.
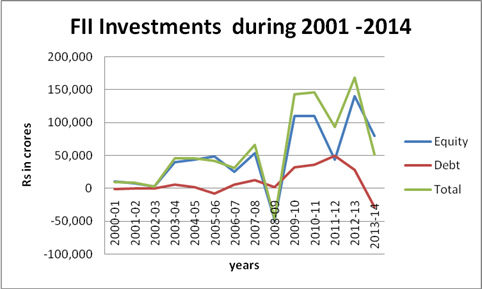
Table 1 given above presenting the net investment of FII in financial year from
1992 to 2014.Here in the table it can be easily observed that FII started their
investment with its main instrument as Equity , which was 13 crore in 1992. Then
they took their initiation in the next form of FII investment that is Debt in 1996-97
with 29 crores at the same time investment in equity had risen but in 1997 -98 investment
reduced and become negative as -717 and -867 in both Equity and Debt in 1998-99.
From 1999 to 2001 FII Equity have increased but negative in debt, but it can be
observed that 2002-03 FII investment in both the instrument had declined. From 2003
equity investment performance had improved but not improved in case of debt folio.
When we move to 2008-09 investment portfolio, it can be observed that investment
in Equity become negative as -47,706 due to huge withdrawal(outflow) of FII in India
because of which total investment of FII also become negative during global crises.
After crises, the performance of FII had improved in Indian stock market. But again
till 2013-14 investment in equity and debt has decreased, and total investment also
declined. Chart 1 also depicts the same fluctuation in FII investment during
2001 to 2014 which affected Indian capital market adversely as well as positively.
Chart 1 : FII investment in India
Source: SEBI
FIIs IN DIFFERENT SECTORS OF INDIA (2007 TO 2013)
FII is playing important role in growth of different Indian sector. It is observed
in Indian sector that FII are now investing more in construction and banking sector.
Also now they are moving more towards PSU sectors. The impact of FII in different
sector can be discussed through table 3:
TABLE: 3 Share of FII in different sectors of Companies listed on NSE
|
Sector
|
March-2007
|
March-2008
|
March-2009
|
March-2010
|
March-2011
|
March-2012
|
March-2013
|
|
Finance
|
18.18
|
17.44
|
13.01
|
16.53
|
23.35
|
8.4
|
8.8
|
|
Engineering
|
11.45
|
10.63
|
7.34
|
8.28
|
9.36
|
5.1
|
4.6
|
|
FMCG
|
11.91
|
14.07
|
12.72
|
14.09
|
16.34
|
9.4
|
9.2
|
|
Banks
|
18.41
|
19.15
|
14.27
|
16.02
|
17.62
|
15.9
|
16.9
|
|
IT
|
14.53
|
16.00
|
12.44
|
11.68
|
21.16
|
7.3
|
7.2
|
|
Infrastructure
|
7.15
|
8.86
|
7.31
|
8.90
|
7.87
|
5.9
|
6.3
|
|
Manufacturing
|
9.57
|
9.46
|
7.28
|
8.79
|
9.41
|
4.8
|
4.6
|
|
Media and entertainment
|
15.20
|
11.71
|
11.42
|
7.06
|
10.97
|
5.8
|
6.1
|
|
Petrochemicals
|
5.83
|
4.73
|
4.77
|
6.08
|
6.52
|
4.5
|
5.1
|
|
Pharmaceuticals
|
11.17
|
10.69
|
7.88
|
8.78
|
10.19
|
6.2
|
6.8
|
|
Services
|
13.09
|
10.70
|
8.39
|
8.05
|
7.41
|
5.4
|
5.2
|
|
Telecommunication
|
11.17
|
9.12
|
6.85
|
8.64
|
8.44
|
5.7
|
5.6
|
|
miscellaneous
|
8.19
|
9.30
|
8.39
|
8.10
|
13.65
|
6.1
|
5.8
|
|
Total share of FII in the sectors
|
10.78
|
10.62
|
8.40
|
9.58
|
10.32
|
6.0
|
6.0
|
Source : NSE India
Table 3 Explaining the status of FII share in different sector in India listed on
NSE. The sector which received highest share of FII in 2007 is banking sector with
18.41 and the lowest is received by 5.83. Total stake of FII across different sector
was 10.78%. At the end of March, 2008, the FII held the highest stake in banking
sector 19.15% followed by finance, Information Technology, Media & Entertainment
and Service sector 17.44%, 16.00%, 11.71% and 10.70% respectively.
In the year 2009, share of FII was highest again as 14.27% but if we compare this
ratio with 2008 bank share, it has decreased about 5 % due to global financial crises;
the impact of crises was followed by all sectors in Economy. It was also observed
that FIIs total stake in the sectors was also decreased from 10.62 %( 2008) to 8.40
%( 2009). FIIs highest share (investment) was recorded in finance sector in 2010
and lowest in petrochemical as 6.08%. Same condition of finance sector and petrochemical
sector can be observed from the table as highest (23.35%) and lowest (6.52%) respectively
in 2011.
In 2012, there was a drastic change in FIIs investment across different sectors.
Their share had declined sharply in all sectors but majority of the investment of
FII were in banking sector as 15.9%. In 2013, it could be observed that there was
a minor change in FII investment (share) across all sectors, highest share held
by banking sector and lowest was held by engineering and manufacture sector. Total
% share of FII were same in 2012 and 2013. On the whole FII investment in petrochemicals
was lowest during 2007 to 2012.
Sector wise analysis of FII investment with the following chart in order
to find out the role of FII in different sectors:-
Chart: 2
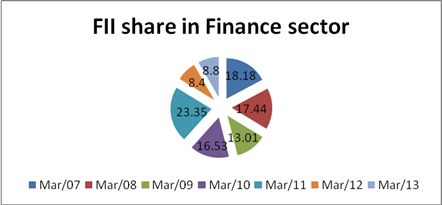
The chart 2 depicts that FII invested more in 2011 as 23.35 in finance sector and
very less they invested in 2012. It could be also observed that during global crises
their share has reduced.
Chart: 3
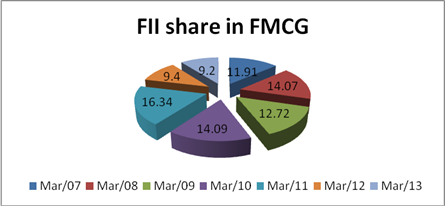
Here in the chart 3 we can see that FMCG held less share if FIIs compare to finance
sector in 2011 but this sector enjoyed superiority in holding more share of FIIs
(9.2) in 2013 compare to finance (8.8).
Chart: 4
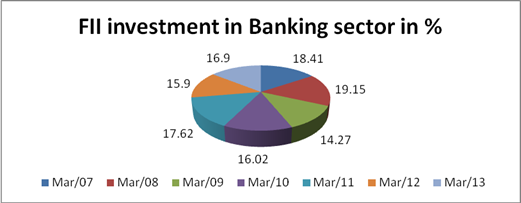
Chart: 4 shows that banking sector held regular investment of FIIs during global
crises period and even after global crises . FIIs stake was high in 2008 as 19.15
and less in 2009 as 14.27. In 2013 it was 16.9 % only.
Chart: 5
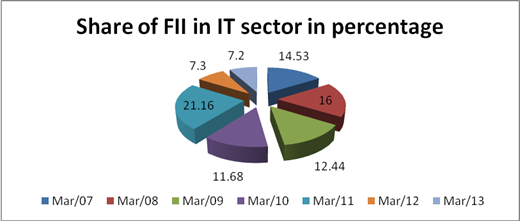
In the above chart it can be observed that IT sector held highest stake of FIIs
in 2011(21.16) and lowest in 2013, which is very low compare to 2007 to 2012 investment.
Chart :6
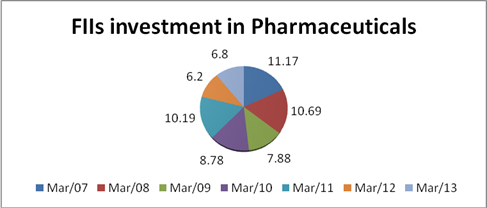
In the above chart it can be seen that FII investment was comparatively low during
2007 to 2013 in pharmaceutical sector, it was low in 2009(7.88), 2010(8.78), 2012(6.2)
and 2013(6.8).
Overall it can be said that FII role was prominent in banking sector as they invested
more in this sector compare to other sector but it can also be seen that FII investment
had reduced in 2013 in all the sectors form 2007.
OTHER IMPACT OF GLOBAL FINANCIAL CRISES ON INDIA
Though in the beginning Indian official denied the impact of financial crises affecting
the Indian economy but later the government had to acknowledge the fact the US financial
crises will have some impact on the Indian economy. Impact can be discussed as:
· The sensex lost 1000 points on 10 October 2008 before regaining 200 points. This
huge withdrawal from the India’s stock market was mainly by Foreign Institutional
Investment (FII).
· Trade deficit was at alarming proportions. Because of worker’s remittances, NRI
deposits, FII investment.
· Indian exports have run into difficult times, since October 2008. Manufacturing
sectors like leather, textile, gems and jewellery have been hit hard because of
the slump in the demand in the US and Europe.
· With the outflow of FIIs, India’s rupee depreciated approximately by 20% against
US dollar.
CONCLUSION
On the basis of above discussion and data interpretation, it can be concluded that
investments made by FIIs, have greater impact on Indian stock market as well as
on Economy. But FIIs investment was not consistent during global crises. The global
financial crises were the shear consequences of ‘greed’ and to make ‘too much profit’
on the part of Wall Street forms and investment banks. This crisis also shows the
failure of capital market economy. Due to this crisis, FIIs made withdrawal of $5.5
billion.
It can also be concluded that FIIs are mainly concentrating in banking sector as
they were investing more in banking sector even during crises and after crises period
but their investment decreased in all sectors till 2013. FIIs investment with huge
inflow 142,658.3 Rs crores in 2009 had changed the position of India and India becomes
main destination for FII investments in comparison to other Asian countries. India
is holding a top position in Asian countries for FII stake. FIIs investments were
more before crises, negative in 2008-2009 and then increase or decrease till 2013-14
as shown in trends.
Thus it can be said that foreign institutional investment and global financial crises
had a great impact on different sector of Indian economy. FII was the big cause
of fluctuation in sectoral composition.
REFERENCES
1. Samal, C. Kishore (1997), Emerging Equity Market in India: Role of Foreign
Institutional Investors, Economic and Political Weekly, Vol. 32, No. 42.
2. Reserve Bank of India (RBI). Various years. Report on currency & finance
Mumbai: RBI
3. AnandBansal report, “ Foreign Institutional Investor’s impact on stock
prices in India”, Journal of academic Research in Economics Volume 1 Number 2 October
2009.
4. Subbaro, Duvvuri 2010 “Volatility in Capital Flows : Some perspectives.”Speech
delivered organised by IMF Zurich , 11 May available online at :
http://www.bis.org/review/r100517b.pdf
5. Verma, Radheyshyam, and AnandPrakash, 2011. “ Sensitivity of capital flows
to interest rate differentials: An Empirical Assessment for India” RBI Working Paper
Series : 7/2011.
6. Dr Shukla& Dr Upadhyay : “ FII Equity Investment & Indian Capital
Market- An Empirical Investigation”, PBRI Vol 3 Issue : 3 Jan- March 2011.
7. “Net FII flows into India: A cause and effect study”, 108 ASCI Journal
of Management 41 (2) March 2012.
8. Dr Mamta ,Ms Priyalaxmi and Mathur : “Impact of FII on stock market with
special reference to BSE : A study of last decade”, Asian journal of research in
banking and finance,vol.2 issue4,April2012
9. IMF working paper: R esearch department, “foreign investors under stress
evidence from India prepared by La Patnaik, Ajay Shah, Nirvikar Singh” March 2013.
10. A.V. Rajwade “External sector with FII” Economic and Political Weekly
from Vol. XLVIII No. 29, 20 July 2013.
11. Dr.Namita Rajput: “FIIs and its impact on stock market” Asian Journal
of Finance & Accounting 2013, Vil. 2, No. 2.
12. Dr. K. Mallikarjuna Rao: “Impact of FII on Indian capital market” International
Journal of Marketing ,Financial Services and Management Research .vol 2 , no 6 ,
June 2013.
13. Dr. M. Venkata Subba Reddy , Mahammed Saleem(2013): “ Impact of FII’s on Indian
Stock Markets” Indian journal of applied research , vol:3, issue:4, April
2013.
14. Garg A and Bodla BS (2009), “Determinants of FIIs in Indian Stock Market,”
Abhigyan,vol.26, No.4, pp 12-24.
15. Karimullah (2009): “ The impact of FIIs equity investment behaviour in
the Indian stock market”
16. Borner et al 2010: “ The behaviour of gross capital flows of foreigners
and domestic investor before and after financial crises”
17. Bose and Dipankor : “ The impact of FII regulation in India”. ICRA Bulletin
( money and finance) .
18. IMF (2010) : ‘An event study of the impact of capital control introductions
on 37 “liquidity receiving” countries’. IMF working paper .
Online Resources:
www.sebi.gov.in
www.rbi.org.in
www.imf.org
www.indiainfoline.com
www.mydigitalfc.com
www.bseindia.com
www.nseindia.com
www.businessstandard.com

