A Refereed Monthly International Journal of Management
Demand Side Issues of Financial Inclusion: An Interpretive Structural Modelling Technique
Barun Kumar Jha
Research Scholar
Dept. Of Applied Economics & Commerce
Patna University
Ph.- 9718156609
E-mail:- jhabarunkr@gmail.com
Address:- D-281, Street No. -7A
Mukund Vihar
Karawal Nagar
Delhi-110094
Demand Side Issues of Financial Inclusion: An Interpretive Structural Modelling Technique
Abstract
Financial Inclusion or Inclusive Finance refers to the delivery of financial services at an affordable cost to the vast sections of the disadvantaged and low profile groups of the society. Financial Inclusion helps vulnerable groups such as low income groups, weaker sections, etc., to increase incomes, acquire capital, manage risk and work their way out of poverty through secure savings, appropriately priced credit and insurance products, and payment services. Financial Inclusion should not be seen as a social responsibility of the Governments and the banking system, but it is a potentially viable business proposition today which provides the poor with opportunities to build savings make investments and get credit. This paper analyse the demand side factors which are responsible for financial exclusion.
Key words: - Financial Inclusion, Financial Services, Social responsibility
Introduction
Finance is very essential for every economic activity. Without adequate finance no activity can be undertaken. Finance is also required by the every section of the society. But from the beginning of the civilization, only the financial needs of the upper section of the society were catered. Access to finance by the poor and weaker groups is very difficult. This is due to the various reasons such as lack of banking facilities for this section, unawareness about the schemes available for them, lack of a regular or substantial income etc. Moreover, banks also give more importance to meet their financial targets. So they focus on larger accounts. It is not profitable for banks to provide small loans and make a profit. Hence, the need for financial inclusion is felt by the Government of India, the policy makers and Reserve bank of India.
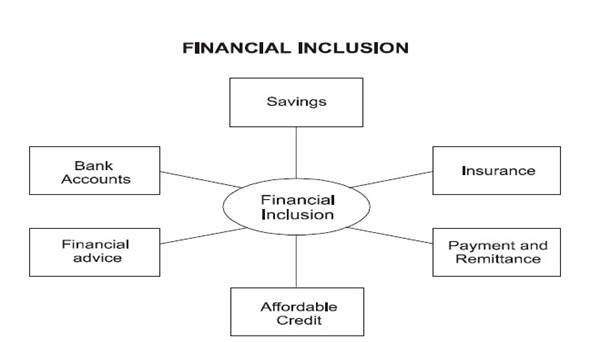
Financial inclusion denotes delivery of financial services at an affordable cost to the vast sections of the disadvantaged and low-income groups. The various financial services include credit, savings, insurance and payments and remittance facilities. The objective of financial inclusion is to extend the scope of activities of the organized financial system to include within its ambit people with low incomes. Through graduated credit, the attempt must be to lift the poor from one level to another so that they come out of poverty. Financial inclusion mainly focuses on the poor who do not have formal financial institutional support and getting them out of the clutches of local money lenders.
Sources: Report of the Rangrajan Committee on Financial Inclusion
Whose Inclusion?
The essence of Financial Inclusion is to ensure that a range of appropriate financial services is available to every individual of the country. This should include:
- Regular financial intermediation such as banking which includes basic no frills accounts for sending and receiving money.
- Saving Products which are suitable to the pattern of cash flow of the poor household.
- Availability of the Money transfer facilities.
- Availability of small loans and overdrafts for productive, personal and other uses.
Historical Background of Financial Inclusion
Financial inclusion is not a new concept. It emerged during the first decades of 20th century when cooperative movement took place for the first time in India. It highlighted at time of nationalisation of 14 major commercial banks in India in 1969. Large numbers of bank branches were opened to include the people in formal financial system. Bangladeshi Economist and Nobel Laureate Prof. Muhammad Yunus Khan developed a Grameen Model and finally he named his model as Grameen Bank in late 1980 to provide loan to poor people of Bangladesh. The planning commission of India constituted a committee on financial inclusion in 2005. C. Rangarajan was chair person of this committee and the report of the committee was published in 2008. The Rangarajan committee defined Financial Inclusion is a process of ensuring access to financial services and timely and adequate credit where needed by vulnerable groups such as weaker sections and low-income group at affordable cost. Many other eminent scholars highlighted the issue of financial inclusion and have done research on financial inclusion. Sarma and Pais (2008) examined the cross country empirical analysis of the relationship between financial inclusion and development. Index of financial inclusion developed by Mandira Sarma is used to identify the associated factors with financial inclusion. It was found out that index of human development and index of financial inclusion are strongly correlated except few factors and non-performing assets which are inversely associated with financial inclusion. It was also found that capital asset ratio is negatively associated with financial inclusion. Ghosh (2007) tried to examine the role of micro finance in improving the financial inclusion vulnerable groups of the society such as marginalized farmers, low income groups etc. The study used the time series data from 1991 to 2007 on selected variables like bank branches, financially excluded population and impact of SHGs linkages programme with banks. Data were obtained from various sources such as Hand Book of Statistics on Indian Economy, RBI and Economic Survey. In this study, he examined the problems of formal banking in providing micro credit to the poor of rural and urban areas in the present era and suggested that programs like Post Office Saving Banks (POSBs), SHGs and micro finance can be used to cater the financial needs of rural India. Ganghaiah and Nagaraja (2009) tried to examine the impact of Self-Help Groups on income and employment. They determined some objectives such as to include the savings and banking habits among members, to secure them from financial, technical and moral strengths, and to gain economic prosperity through loan/credit.
Demand Side Issues of financial exclusion:
(a) Lack of banking habits and credit culture.
(b) Lack of awareness about savings, credit, remittance and micro insurance.
(c) Non availability of ideal products and services for vulnerable section.
(d) Very small volume/size transactions are not encouraged by formal banking institution.
(e) Non availability of timely and doorstep banking services.
(f) Rural customers contact cost to bank is very high for travel, wage losses, incidental expenses etc.
(g) Hassles related to papers and documents necessary at bank level.
(h) High level of rejection/indifference at bank branch level.
(i) Perception levels of bankers are not positive towards vulnerable section.
(j) Distance is a factor for servicing and supporting viable credit proposal
Methodology
ISM is an interactive technique in which elements are structured to form a comprehensive systematic model (Sage 1977). It helps to impose order and direction to resolve the complexity of interrelationships within the system. It is an appropriate modelling technique for analyzing the influencing of one variable on the other variables. This model helps in understanding the mutual relationships of complex set of variables. In this paper, ISM has been applied to identify the influential relationships of demand side factors which are responsible for financial exclusion.
Structural Self Interaction Matrix
Variables affecting demand side financial inclusion are: Lack of banking habits (1), Lack of awareness (2), Non availability of ideal products (3), Small transactions (4), Non availability of timely services (5), Contact cost to bank (6), Documentations (7), High level of rejection (8), Perception level of bankers (9), Distance (10).
For analysing these variables, a contextual relationship of 'affect' type is chosen implying that one variable affect the other. The associated direction of relations has been depicted using four symbols:
- V- Variable i is dependent on j
- A- Variable j is dependent on i
- X- Both variables affect each other
- O- Both variables are not related
Based on these relationships SSIM is prepared as shown below:
Table 1: Self Structured Initial Matrix
|
Elements
|
10
|
|
9
|
8
|
|
7
|
|
6
|
5
|
4
|
3
|
|
2
|
|
1
|
V
|
|
V
|
V
|
|
V
|
|
O
|
V
|
V
|
V
|
|
V
|
|
2
|
A
|
|
V
|
A
|
|
X
|
|
O
|
V
|
O
|
O
|
|
|
|
3
|
A
|
|
O
|
O
|
|
V
|
|
O
|
X
|
X
|
|
|
|
|
4
|
A
|
|
X
|
X
|
|
X
|
|
A
|
X
|
|
|
|
|
|
5
|
X
|
|
O
|
O
|
|
O
|
|
A
|
|
|
|
|
|
|
6
|
V
|
|
O
|
V
|
|
V
|
|
|
|
|
|
|
|
|
7
|
O
|
|
O
|
X
|
|
|
|
|
|
|
|
|
|
|
8
|
O
|
|
V
|
|
|
|
|
|
|
|
|
|
|
|
9
|
A
|
|
|
|
|
|
|
|
|
|
|
|
|
Reachability Matrix
The SSIM table is transformed into a reachability matrix by depicting the entries of SSIM in 0s and 1s in reachability matrix. The situations are:
- If (i,j) entry is V, then (i,j) in reachability matrix becomes 0 and (j,i) entries is 1.
- If (i,j) entry is A, then (i,j) in reachability matrix becomes 1 and (j,i) entries is 0.
- If (i,j) entry is X, then (i,j) in reachability matrix becomes 1 and (j,i) entries is 1.
- If (i,j) entry is O, then (i,j) in reachability matrix becomes 0 and (j,i) entries is 0.
Table 2: Initial Reachability Matrix
|
Elements
|
1
|
2
|
3
|
4
|
5
|
6
|
7
|
8
|
9
|
10
|
|
1
|
1
|
0
|
0
|
0
|
0
|
0
|
0
|
0
|
0
|
0
|
|
2
|
1
|
1
|
0
|
0
|
0
|
0
|
1
|
1
|
0
|
1
|
|
3
|
1
|
0
|
1
|
1
|
1
|
0
|
0
|
0
|
0
|
1
|
|
4
|
1
|
0
|
1
|
1
|
1
|
1
|
1
|
1
|
1
|
1
|
|
5
|
1
|
1
|
1
|
1
|
1
|
1
|
0
|
0
|
0
|
1
|
|
6
|
0
|
0
|
0
|
0
|
0
|
1
|
0
|
0
|
0
|
0
|
|
7
|
1
|
1
|
1
|
1
|
0
|
1
|
1
|
1
|
0
|
0
|
|
8
|
1
|
0
|
0
|
1
|
0
|
1
|
1
|
1
|
0
|
0
|
|
9
|
1
|
1
|
0
|
1
|
0
|
0
|
0
|
1
|
1
|
1
|
|
10
|
1
|
0
|
0
|
0
|
1
|
1
|
0
|
0
|
0
|
1
|
1* entries are included to show transitive relationships in SSIM. Final reachability matrix is prepared by including transitivity.
Table 3: Final Reachability Matrix
|
Element
|
|
1
|
2
|
3
|
4
|
5
|
6
|
7
|
8
|
9
|
10
|
|
1
|
|
1
|
0
|
0
|
0
|
0
|
0
|
0
|
0
|
0
|
0
|
|
2
|
|
1
|
1
|
1*
|
1*
|
1*
|
1*
|
1
|
1
|
0
|
1
|
|
3
|
|
1
|
1*
|
1
|
1
|
1
|
1*
|
1*
|
1*
|
1*
|
1
|
|
4
|
|
1
|
1*
|
1
|
1
|
1
|
1
|
1
|
1
|
1
|
1
|
|
5
|
|
1
|
1
|
1
|
1
|
1
|
1
|
1*
|
1*
|
1*
|
1
|
|
6
|
|
0
|
0
|
0
|
0
|
0
|
1
|
0
|
0
|
0
|
0
|
|
7
|
|
1
|
1
|
1
|
1
|
1*
|
1
|
1
|
1
|
1*
|
1*
|
|
8
|
|
1
|
1*
|
1*
|
1
|
1*
|
1
|
1
|
1
|
1*
|
1*
|
|
9
|
|
1
|
1
|
1*
|
1
|
1*
|
1*
|
1*
|
1
|
1
|
1
|
|
10
|
|
1
|
1*
|
1*
|
1*
|
1
|
1
|
0
|
0
|
0
|
1
|
Partitioning Reachability Matrix
The matrix is divided by identifying the reachability antecedent set and intersection set. The reachability set consists of element which directly affects whereas antecedent set consists of elements which may be affected. Then the intersection set is derived out of these sets for all the elements.
The elements for which the reachability set and intersection set are same as the top level elements in ISM model. The top level elements are the outcomes. Once these are identified, it is separated out from the rest of the elements. Then the same process is repeated to find next level of elements. On the basis of these identified levels, diagraph is build to establish a model. The various iterations of level building are shown. The process is completed in three iterations as follows:
- In table 4, the element 1 & 6 are found at level 1. They will be positioned at the top of hierarchy of ISM model.
- In table 5, the element 2,3,4,5 & 10 are put at level II.
- In table 6, element 7, 8 and 9 are put at level III.
Table 4: Iteration 1
|
Elements
|
Reachability set
|
Antecedent set
|
Intersection set
|
Level
|
|
1
|
1
|
1,2,3,4,5,7,8,9,10
|
1
|
I
|
|
2
|
1,2,3,4,5,6,7,8,10
|
2,3,4,5,7,8,9,10
|
2,3,4,5,7,8,10
|
|
|
3
|
1,2,3,4,5,6,7,8,9,10
|
2,3,4,5,7,8,9,10
|
2,3,4,5,7,8,9,10
|
|
|
4
|
1,2,3,4,5,6,7,8,9,10
|
2,3,4,5,7,8,9,10
|
2,3,4,5,7,8,9,10
|
|
|
5
|
1,2,3,4,5,6,7,8,9,10
|
2,3,4,5,7,8,9,10
|
2,3,4,5,7,8,9,10
|
|
|
6
|
6
|
2,3,4,5,6,7,8,9,10
|
6
|
I
|
|
7
|
1,2,3,4,5,6,7,8,9,10
|
2,3,4,5,7,8,9
|
2,3,4,5,6,8,9,
|
|
|
8
|
1,2,3,4,5,6,7,8,9,10
|
1,2,3,4,7,8,9
|
1,2,3,4,7,8,9
|
|
|
9
|
1,2,3,4,5,6,7,8,9,10
|
3,4,5,7,8,9
|
3,4,5,7,8,9
|
|
|
10
|
1,2,3,4,5,6,10
|
2,3,4,5,7,8,9,10
|
2,3,4,5,10
|
|
Table 5: Iteration 2
|
Elements
|
Reachability set
|
Antecedent set
|
Intersection set
|
Level
|
|
2
|
2,3,4,5,7,8,10
|
2,3,4,5,7,8,9,10
|
2,3,4,5,7,8,10
|
II
|
|
3
|
2,3,4,5,7,8,9,10
|
2,3,4,5,7,8,9,10
|
2,3,4,5,7,8,9,10
|
II
|
|
4
|
2,3,4,5,7,8,9,10
|
2,3,4,5,7,8,9,10
|
2,3,4,5,7,8,9,10
|
II
|
|
5
|
2,3,4,5,7,8,9,10
|
2,3,4,5,7,8,9,10
|
2,3,4,5,7,8,9,10
|
II
|
|
7
|
2,3,4,5,7,8,9,10
|
2,3,4,5,7,8,9
|
2,3,4,5,7,8,9,
|
|
|
8
|
2,3,4,5,7,8,9,10
|
2,3,4,7,8,9
|
2,3,4,7,8,9
|
|
|
9
|
2,3,4,5,7,8,9,10
|
3,4,5,7,8,9
|
3,4,5,7,8,9
|
|
|
10
|
2,3,4,5,10
|
2,3,4,5,7,8,9,10
|
2,3,4,5,10
|
II
|
Table 6: Iteration 6
|
Elements
|
Reachability set
|
Antecedent set
|
Intersection set
|
Level
|
|
7
|
7,8,9
|
7,8,9
|
7,8,9,
|
III
|
|
8
|
7,8,9
|
7,8,9
|
7,8,9
|
III
|
|
9
|
7,8,9
|
7,8,9
|
7,8,9
|
III
|
Conical Matrix
A conical matrix is developed by clustering variables according to level across rows and columns of final reachability matrix.
Table 7: Conical Matrix
|
Elements
|
1
|
6
|
2
|
3
|
4
|
5
|
10
|
7
|
8
|
9
|
|
1
|
1
|
0
|
0
|
0
|
0
|
0
|
0
|
0
|
0
|
0
|
|
6
|
0
|
1
|
0
|
0
|
0
|
0
|
0
|
0
|
0
|
0
|
|
2
|
1
|
1
|
1
|
1
|
1
|
1
|
1
|
1
|
1
|
0
|
|
3
|
1
|
1
|
1
|
1
|
1
|
1
|
1
|
1
|
1
|
1
|
|
4
|
1
|
1
|
1
|
1
|
1
|
1
|
1
|
1
|
1
|
1
|
|
5
|
1
|
1
|
1
|
1
|
1
|
1
|
1
|
1
|
1
|
1
|
|
10
|
1
|
1
|
1
|
1
|
1
|
1
|
1
|
0
|
0
|
0
|
|
7
|
1
|
1
|
1
|
1
|
1
|
1
|
1
|
1
|
1
|
1
|
|
8
|
1
|
1
|
1
|
1
|
1
|
1
|
1
|
1
|
1
|
1
|
|
9
|
1
|
1
|
1
|
1
|
1
|
1
|
1
|
1
|
1
|
1
|
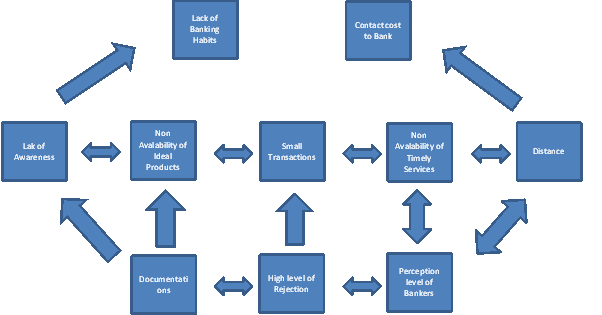
Development of Diagraph
Based on Conical Matrix Diagraph is obtained including the effect of transitivity links.
Discussion
The author has reviewed the literature and found out ten variables which are responsible for financial exclusion related to demand side analysis. From the variables selected, after applying ISM, three variables are driving forces, five variables are linking variables and two are strategic variables. The driving variables are Documentations, High level of rejection and Perception level of Bankers. The linking variables are Lack of Awareness, Non Availability of Ideal Products, Small Transactions, Non Availability of Timely Services and Distance. The Strategic variables are Lack of Banking Habits and Contact cost to bank.
Conclusion
Importance of financial inclusion is increased, because the benefits of the financial services are not provided to all the people of the society. Inclusive growth is very essential for the development of the country. Various studies examined that there is a close relationship between financial inclusion and development. But due to the various constraints the inclusive growth is prohibited such as lack of financial literacy, poverty, lack of advanced technology etc. There is a huge need to adopt various strategies for the financial inclusion such as adaptation of advanced technology, opening up the bank branched in rural areas, introduction of new saving schemes for low income people etc.
References
Agrawal. (2008): The need for Financial Inclusion with an Indian Perspective, IDBI, GILTS.
Chakrabarty, K.C. (2009): Banking: The key driver for inclusive growth. Speech Delivered at Mint’s ‘Clarity through Debate’ series on August 10th, 2009 at Chennai.
Chakrabarty, K.C. (2009): Financial Inclusion – RBI Initiatives. Speech Delivered at National Seminar on Launching a National Initiative’ for Financial Inclusion’ organised by DFS, GOI at New Delhi on September 18.
Chaudhari, P. C. (2007): “Total Financial Inclusion- Various Approaches”, Indian Journal of Agricultural Economics, Vol.62. No.3, July-Sept 2007.
Delvin, .F. (2009): “An Analysis of Influences on Total Financial Inclusion”. The Services Industries Journal, 29:8, 1021-1036.
Rakesh Mohan,(2009), Financial Inclusion in India: Is the Glass Half Empty or Three Quarters Full? Working Paper No. 409, Stanford Center for International Development.
Firpo, J. (2005), “Banking the Unbanked: Technology’s Role in Delivering Accessible Financial Services to the Poor”. Available at URL: http://www.gdrc.org/icm/govern/banking-unbanked.pdf.
Rangarajan Committee (2008), Report of the Committee on Financial Inclusion, Government of India.
Reserve bank of India (2010), Report of Trend and Progress of Banking in India 20012-13, Mumbai.
Thorat, Usha (2007), Taking Banking Services to the Common Man – Financial Inclusion.

