A Refereed Monthly International Journal of Management
An Analysis of India’s trade with China - with Special Reference to Mercantile Trade
Author
Abstract
Over the past two decades, there is no other trading partner that has gained as much importance as India and China, China and India together feed to the 40% of humanity. China is the world's largest exporter and its exports formed more than 13% of the global exports. China and India relationship is an important indicator of peace and stability in the region. There is increasing trend of imports and exports among India and China after economic reforms, these two economies are rapidly growing economies in the world. These two countries are also having cultural, historical, political background, there is tremendous potential related to international trade between these two countries. Through bilateral agreements and trade negotiation these two countries can come together and establish themselves as good partners at the international trade level. China and India had similar development strategies before adopting of market oriented economic reforms. China began reforming its centrally planned, non-market and closed economy in 1978. India always had a large private sector and functioning market subject to rigid state controls until the hesitant and piecemeal reforms of the 1980‘s. These became systematic and far broader after India experienced a severe macroeconomic crisis in 1991. With the beginning of the 21st century, they have become the two superstars of economic growth with their increasing integration with the rest of global economy. Without a doubt, a further development of these two rising giants will have a tremendous impact on world economy as a whole and their success will usher in the return of Asian century in the next twenty or thirty years.
Key Words: Policies, Strategies, Agreement, Asian Superpower, Self Sufficient, Non Socialist Country, Humanity, Peace and Stability, Polynomial Regression Model.
Introduction
Today no Country in the world is fully self-sufficient so there arises the needs of International Trade. It arises due to divergent scarcity of resources between nations or it arises due to result of difference in physical or geographical conditions as areas differ greatly in mineral resources, power resources, climate, natural vegetation, Soils and other factors, for example , If a particular area does not have sufficient Iron ore to meet its requirement then it has option to Import it from another countries where it is available in the surplus, in this way it fulfill its requirement, therefore it will not be wrong if we says that international interdependence is a central feature of today’s modern business world. In the era of globalization Foreign Trade has become the lifeline of any economy. The beauty of international trade is that it enables every country to specialize in what it does best, export these specialties, and use the money to import what other do best. All countries end up specializing in what they do best, improving global productivity and reducing prices for everybody. Thus, it is clear that international trade is the exchange of goods, services or capital across the international border line or territories that are Import and Export. The guiding principle of international trade is comparative advantage which indicates that every Country, no matter of their level of economic development can find something it can produce cheaper than another nation. The volume of international trade of a Country will depend upon the degree of economic development.
Today International trade is the key factor in the economic development of any nation. The Prudent use of trade is boosting the country’s development and create absolute gain for the trading partners involved in it. Today’s current consensus is that trade development and poverty reduction are closely related. Sustained growth over longer period is strongly associated with poverty reduction while trade and growth are strongly linked, we can say that International trade play a key role in not only in economic development but in other areas too. Currently it is observed that with the opening up of the economy and liberalization of trade restriction especially India and China have grown over the years. Though Indian growth after 1991 is satisfactory but Chinese growth is extraordinary. As China had a lower per capita than India in the year 1980s but it grew much faster and overtook India by 1990, since then growth in China has been at faster rate that per capita income is now more than twice of India. It is all due to the prudent use of the foreign trade.
Foreign trade play very significant role in development of an economy. It is an essential ingredient of the normal economic life of any country. In terms economic development, foreign trade is a potentially effective engine of growth. Even though foreign trade is life and motive power for economic growth and development of developing countries, the share of developing countries in the world’s trade has been slow to rise, this is so because of very structure of the economy of developing countries. As developing countries our (India’s) export consists mainly of a few primary products and our export surplus is Inelastic. Developing countries have been exposed to wide fluctuations in their export earnings because of the continues declining prices of primary products in the world markets, for the developing countries in the world, development of the foreign trade is of a crucial importance.
Why a Comparative Study of India and China?
China and India had similar development strategies before adopting of market oriented economic reforms. China began reforming its centrally planned, non-market and closed economy in 1978. India always had a large private sector and functioning market subject to rigid state controls until the hesitant and piecemeal reforms of the 1980‘s. These became systematic and far broader after India experienced a severe macroeconomic crisis in 1991. With the beginning of the 21st century, they have become the two superstars of economic growth with their increasing integration with the rest of global economy. Without a doubt, a further development of these two rising giants will have a tremendous impact on world economy as a whole and their success will usher in the return of Asian century in the next twenty or thirty years. In view of the above and many others related facts and developments, economists and policy makers have shown a keen interest in the development strategies and reform processes of these two countries.
It is useful to compare these two economies as a way to assess their economic performance and policy framework. But simple minded comparisons conceal as much they reveals. The conventional wisdom is that, the trade liberalization is the major factor behind the growth experiences of the Chinese and Indian economies. Despite a considerable literature, the channel through which trade affects economic growth is still not well understood. As a result it is unclear to what extent trade liberalization is an underlying contributor to the long run growth performance of China and India (Desroches 2009).
“Comparing ourselves with China is really important matters would be a very good perspective, and they can both inspire us and give us illumination about what to do - and what not to do, the lives that people are able to lead - what ultimately interests people most, are indirectly and partially influenced by the rates of overall economic growth, almost half of our children are undernourished compared with a very tiny proportion in China,” (Amartya Sen, 2011). The two oldest civilizations India and China have coexisted together for a very long period of time in history over 200 ago. India was first non socialist country to establish formal diplomatic relations with the Peoples Republic of China in year 1950. In 1954, the five principles of peace and co-existence were laid down to develop the friendship and cooperation between India and China. It continued up to April 1955, however this positive phase ended in January 23, 1959 when China refused to accept “McMahan line‟ as the legal boundary between the two countries. This tension reached its peak during Indo-Chinese war of 1962 and mistrust continued for about two decades. After 1981, both countries took positive steps to normalize this situation. For this India and China started regular dialogue at the level of Vice-Foreign ministers. Both countries realized that the boundary issue was too complicated for quick resolution. Thus, for the time being China and India might first develop friendly and cooperative relations in other fields for creating a better environment for a final settlement of the boundary question.
Review of Literature
Quer. Diego, Clever.Enrique and Birender(2010) Studies on Doing Business in China and Performance, noticed that since the open door policy came into effect in China, the Key success factor for doing business in that Country have become one of the subjects that that aroused the greater interest in international business and management research. 30 years after the open door policy came into effect in China there still need of further research. Herd. Richard and Doughery (2007) Comparative analysis of Chinese and Indian economies reinforces the view that capital formation has been key factor behind the rapid growth of these two economies rather than growth of total factor productivity. During the past decades higher capital formation in China has been responsible for nearly three quarter of the excess of growth in China relatives to India. Ali Ifzal and fan. Emaa Xiaogin (Nov 2004) reveal the brief demonstration that strong economic growth in both the PRC and China is associated with economic reforms. It shows that the role of government and competitive markets must be divided properly so that they can complement each other. Firms and farms must be unshackled to improve productivity and become the drivers of Growth. Mohanty. S.K (2014) observed in his study that a look at composition of India’s exports to China, however, raises doubts as to whether the recent trends in exports can be maintained. India’s export basket has been dominated by primary and resource-based products. The past growth rates in these exports are unlikely to be maintained, partly because as a part of India’s new mineral policy, it may seek higher value addition for minerals and thus discourage such exports and partly because China’s demand for such imports connected with the current investment boom may not be sustainable. Winters. Alan and Yusuf. Shahid (2007) study shows that GDP growth in China average 9.1 percent over the last decade, and India average 6.1 percent, some people are fearful: will China and India dominate the world Economy?, Will they consume the earth‘s scarce resources?, will they bid down wages elsewhere?, others are curious, can China and India sustain such impressive Growth rate?, especially in light of perceived fragilities (China’s financial Sector and India’s Public debt being notable examples)?, “ Orthodox” seek Lessons : nothing that Neither China nor India is pursuing an “Orthodox” model of development, they want to know how these economies did it and whether there are lesson for other developing Countries. Jeff. M. Smith(2014) The twenty-first Century will witness China and India reclaim their position at top of the Global hierarchy of nations, where they spent the better part of the first and second millennia. The reality is, thirteen year into the new century China and India are more politically engaged and economically interdependent than any time since their birth as modern nation states in 1949 and 1947 respectively.
Significance of the Study
Over the past two decades, there is no other trading partner that has gained as much importance as India and China, China and India together feed to the 40% of humanity. China is the world's largest exporter and its exports formed more than 13% of the global exports. China and India relationship is an important indicator of peace and stability in the region. There is increasing trend of imports and exports among India and China after economic reforms, these two economies are rapidly growing economies in the world. These two countries are also having cultural, historical, political background, there is tremendous potential related to international trade between these two countries. Through bilateral agreements and trade negotiation these two countries can come together and establish themselves as good partners at the international trade level. There is tremendous scope for improving trade relations between India and China. So there is a need of an intensive study analysing trade policy reform process of these two countries and respective impact of trade liberalization on their growth performance. This is a challenging issue to be studied so we have selected this topic for research considering its significance.
Objectives of the Study
- To review the trade policies, strategies, and agreement between India and China.
- To examine the nature, trends, and commodity composition of India trade with
China.
- To analyze the impact of trade of both the countries with each other on their economic
Development.
- To examine the various problems faced by India in its trade with China trade and suggest
Suitable remedial measure wherever required.
Research Methodology
- Time Period of study
The study has been conducted for the period of 15 years, beginning from 2000-01 to 2014-15.
- Sources of Data
This study is based on secondary data. The secondary source of data has been collected from relevant national and international sources. The national sources include Ministry if Commerce, Directorial General of foreign trade, Economic Survey, Handbook of statistics on Indian Economy, quarterly issues of foreign trade Review, Annual Report of Ministry of External Affairs. The International sources include International trade Center, WTO International Trade Statistics, UNCTAD Trade and Development Report and UNDP HDR, UN International Trade Statistics Year Book. Besides Data have also been collected from various national and International databases and databanks, various journals, books and working papers concerned with research work.
- Analysis and Interpretation of Data.
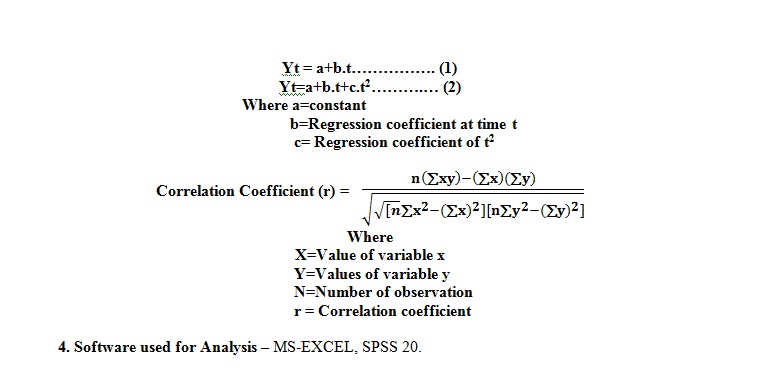
The data gathered from the different sources have been suitably edited. Thereafter, these data have been tabulated and analysed. Before analysis the data, these have been appropriately presented in the forms of tables, graphs and diagrams. For the purpose of analysis growth rate, percentage, index number, compound annual growth rate have been suitably computed. It may be mentioned that percentage are the ratio which help in making comparison, thus it is used for describing relationship and comparing distribution. On the other hand index number gives the growth pattern and trend. Growth rate analysis reveals the quantum of growth pattern in a given year as compared to the respective previous year; compound annual growth rate reveals the annual growth rate of export, import, commodities wise trade. To analyse the impact of foreign trade on economic development regression analysis has been used. Intensity of trade between India and China is determined through Export Intensity Index, Import Intensity Index and Trade Intensity Index. For the prediction of Export, Import as well as total trade between India and China. The different types of polynomial regression model is used which is expressed as
- Scope of the Study
The present study is descriptive in nature which primarily aims at studying the present existing scenario of the trade conditions between India and China, by doing so it highlight the various problems faced by India in its trade activities with China and measures if required to overcome them. The present research also make an attempt to briefly examine the India’s foreign trade pattern, India’s direction and composition with different trading block which has change due to emergence of china as a Asian superpower.
- Limitation of the study
(a)Since the study is based on the bilateral trade, data from both sides are required, data from the Indian side was easily available but Chine trade data are not accessible on their websites even though it is available on their websites it is only in the Chinese language.
(b)The Study is based solely on the secondary data, unavailability of the data at same place was a big problem, and there was great difference in data when compare with different sources for the same year, therefore the reliability of the data at some place could be questioned.
(c) The study emphasizes to analysis the current scenario of India-China trade but the data were not updated on most of the websites related to the study.
(d) India trade with China with large numbers of commodities which are about more than 98 commodities but in this study only twenty five major commodities have been taken for study purpose.
Major Findings and Discussion
(1) The trade policies, strategies, and agreement between India and China.
Trade Policy means System of the Country which aims regulating the flow of imports and exports in accordance with requirement or need of a Particular Country.
Major Indian policies reforms - India embarked on the path of globalization in the 1990s with the objective of improving overall productivity, competitiveness and efficiency of the economy in order to attain a higher growth profile consequently, industrial, financial and external sector reforms were initiated with a view to create an environment conducive for the expansion of trade. As a result of it, the growth in trade accelerated in the early part of the 1990s. This momentum, however, could not be sustained in the face of various domestic bottlenecks and exogenous constraints like East Asia crisis and slowdown in the US economy. The goal of this visionary policy was to remove unnecessary bureaucratic controls, take careful measures to integrate India with the world's economy, remove restrictions on foreign investments and crack down on public sector enterprises that yielded very low returns. The major reforms were carried out in different areas like Fiscal reforms, Monetary and Financial sector reforms, reforms in Capital Markets, Industrial Policy Reforms, Trade Policy Reforms, Promotion of Foreign Investment, and Rationalization of Exchange Rate Policy. Apart from reforms in different areas many Exim Policy were Introduced with the objectives of need of time, recently India is working with Foreign Trade Policy 2015-2020, with the objectives to (A) Simplification & merger of reward schemes (b) Boost to "make in India” (c) Trade facilitation and ease of doing business etc
Major Chinese policies reforms-“Let China sleep, for when she wakes, she will shake the world.”(Napoleon Bonaparte), this saying has been proved to be true for Chinese economy; China seems to be like sleeping before its economic reforms. Even India’s growth rate was more than the China before their Economic Reforms (as shown in table No; 1) but after Chinese reforms its has shaken the world economy by its economic development, as today China is popularly known as “Factory of world manufacture”
[Table No: 1]
Comparison of growth rate in pre and post reform era of China and India
|
Growth rate; %
|
China
|
India
|
|
Pre-reform period(10years)
|
5.5
|
5.7
|
|
Post-reform period(10years)
|
10.1
|
5.9
|
Sources; world development Indicators, World Bank
Prior to 1978 before the initiation of economic reforms and trade liberalization 38 years ago, China maintained policies that kept the economy very poor, stagnant, centrally-controlled, vastly inefficient, and relatively isolated from the global economy. China launched its “Open Door” reforms in 1978, beginning in 1978, China’s central government instituted a series of effective reforms designed to “open” its economy to direct foreign investment from abroad in order to improve its citizen’s standard of living. Since opening up its door to the world economy and investment in 1979, China has been among the world’s fastest-growing economies, and has recorded annual gross domestic product (GDP) growth averaging nearly 10% upto 2014. In recent years, China has emerged as a major global economic power. It is now the world’s largest economy (on a purchasing power parity basis), manufacturer, merchandise trader, and holder of foreign exchange reserves.
China's entry to the World Trade Organization (WTO) in 2001 has been one of the most significant economic events in recent world history. Accession to the WTO is the logical and inevitable end-result of China’s reform and open policy. China’s request to resume its status as a contracting party to the GATT (General Agreement on Tariff and Trade) to its final accession to the WTO, took China 15 years to go through the arduous and prolonged negotiations. In November 1995, China formally requested to accede to the WTO and On December 11, 2001, China officially became WTO’s 143rd member. In less than thirty years China has risen from a marginal player in world trade to become the largest trading nation in absolute numbers. Especially accession to the World Trade Organization at the beginning of the twenty-first century gave a huge boost to China’s integration into the global economy. After China accession to the WTO, China’s trade, including both processing and ordinary trade, increased very fast.
China is ahead of India on most economic and social indicators but India has huge opportunity as it has highest number of young population in the world. The ability of China to maintain a rapidly growing economy in the long run will likely depend largely on the ability of the Chinese government to implement comprehensive economic reforms that more quickly hasten China’s transition to a free market economy; rebalance the Chinese economy by making consumer demand, rather than exporting and fixed investment, the main engine of economic growth; boost productivity and innovation; address growing income disparities; and enhance environmental protection.
Agreements – There has been 84 agreement between India and china, first agreement was held on the date 29/4/1954, this was the agreement between the Republic of India and the People’s Republic of China on Trade and Intercourse between the Tibet region of China and India.
(2) The nature, trends, fluctuation, composition of India’s foreign trade with China
(a)Nature - Nature of India and China is analysed in the term openness to world Trade or International trade. The Openness Index is an economic metric calculated as the ratio of country's total trade, the sum of exports plus imports, to the country's gross domestic product=(Exports + Imports)/(Gross Domestic Product)
-
[Table No: 2]
|
Years
|
India’s openness Index
|
China’s openness Index
|
|
2001
|
0.19
|
0.38
|
|
2002
|
0.21
|
0.42
|
|
2003
|
0.21
|
0.52
|
|
2004
|
0.24
|
0.59
|
|
2005
|
0.29
|
0.63
|
|
2006
|
0.32
|
0.64
|
|
2007
|
0.29
|
0.68
|
|
2008
|
0.41
|
0.56
|
|
2009
|
0.32
|
0.44
|
|
2010
|
0.33
|
0.49
|
|
2011
|
0.42
|
0.49
|
|
2012
|
0.43
|
0.46
|
|
2013
|
0.44
|
0.44
|
|
2014
|
0.38
|
0.42
|
|
2015
|
0.31
|
0.36
|
Sources- Computed
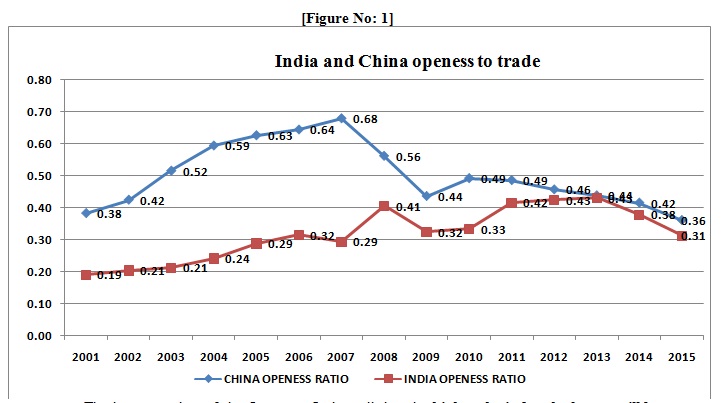
The interpretation of the Openness Index tell that the higher the index the larger will be influence of trade on domestic activities, and the stronger the country's economy. The table above (table No; 2) clearly explain that China’s trade openness ratio was 35% in 2000, the year prior to its joining the WTO, but after becoming the 143rd member of the WTO in 2001, China’s foreign trade increased dramatically. Its trade openness ratio peaked at 62% in 2007 but the global financial crisis eroded the openness ratio to 56% in 2008. After that period it continued with the decline openness index and continued till the final year of study with the fluctuating rate. In 2000, India’s openness ratio was about 19%, twice as large as that a decade ago (i.e., 9% in 1990). As a result of aggressive trade liberalization after 2000, India’s openness ratio had risen to 41%% in 2008, and highest 44% in the year 2013. It can be noted that both country had equal openness index in the year 2013 with 44 %. Therefore it can be concluded that Chinese economy is more open or is more integrated to world trade than Indian Economy.
(b) Trends, Growth and Fluctuation
[Table No: 3]
India-China Trade for the Period 2000-1 to 2014-15
(Values in Rupees Billion) (Indices 2000-01=100)
|
Years
|
India’s Export to China
|
Growth rate of Export in %
|
India’s Import from China
|
Growth rate of Import in %
|
Total Trade
|
Growth rate of Total Trade in %
|
Indices of Exports
|
Indices of Imports
|
Indices of Total Trade
|
Trade Balance
|
|
2000-01
|
37.98
|
-
|
68.63
|
-
|
106.61
|
-
|
100
|
100
|
100.00
|
-30.65
|
|
2001-02
|
45.4
|
19.55
|
97.12
|
41.52
|
142.52
|
33.69
|
119.54
|
141.51
|
133.70
|
-51.72
|
|
2002-03
|
95.6
|
110.58
|
135.12
|
39.13
|
230.73
|
61.89
|
251.71
|
196.88
|
216.44
|
-39.52
|
|
2003-04
|
135.79
|
42.03
|
186.25
|
37.84
|
322.04
|
39.58
|
357.53
|
271.38
|
302.10
|
-50.46
|
|
2004-05
|
252.33
|
85.82
|
318.92
|
71.23
|
571.25
|
77.38
|
664.38
|
464.69
|
535.88
|
-66.6
|
|
2005-06
|
299.25
|
18.59
|
481.17
|
50.87
|
780.42
|
36.61
|
787.91
|
701.11
|
732.10
|
-181.92
|
|
2006-07
|
375.3
|
25.41
|
790.09
|
64.2
|
1165.38
|
49.33
|
988.15
|
1151.23
|
1093.23
|
-414.79
|
|
2007-08
|
435.97
|
16.17
|
1091.16
|
38.11
|
1527.14
|
31.04
|
1147.89
|
1589.92
|
1432.58
|
-655.19
|
|
2008-09
|
426.61
|
-2.15
|
1476.06
|
35.27
|
1902.67
|
24.6
|
1123.25
|
2150.75
|
1784.87
|
-1049.4
|
|
2009-10
|
547.14
|
28.25
|
1460.49
|
-1.05
|
2007.63
|
5.52
|
1440.6
|
2128.06
|
1883.33
|
-913.35
|
|
2010-11
|
643.15
|
17.55
|
1980.79
|
35.63
|
2623.94
|
30.7
|
1693.39
|
2886.19
|
2461.48
|
-1337.6
|
|
2011-12
|
874.71
|
36.01
|
2654.66
|
34.02
|
3529.36
|
34.51
|
2303.08
|
3868.08
|
3310.85
|
-1780
|
|
2012-13
|
735.3
|
-15.94
|
2843.85
|
7.13
|
3579.14
|
1.41
|
1936.02
|
4143.74
|
3357.54
|
-2108.6
|
|
2013-14
|
905.61
|
23.16
|
3092.35
|
8.74
|
3997.96
|
11.7
|
2384.44
|
4505.83
|
3750.43
|
-2186.7
|
|
2014-15
|
730.3
|
-19.36
|
3695.65
|
19.51
|
4425.96
|
10.71
|
1922.85
|
5384.89
|
4151.93
|
-2965.4
|
|
CAGR
|
0.37356
|
|
2.84652
|
|
|
|
|
|
|
|
A comparative analysis of India’s trade with China reveals that (as shown in the table above) during the period under study India’s export to China has increase to nineteen (19) times, whereas import from China during the same period of time has recorded an increase of more than fifty three (53) times, causing a trade deficit of rupees 2965.4 billion, this means India is importing almost three times of its export to China. The highest rate of growth of India’s export to china during study period was recorded is the year 2002-03 when export grew by 110.58 per cent over the year 2001-02, where as the lowest rate of growth of India’s export to China during the study period was recorded in the year 2014-15 when export grew negatively by 19.36 per cent over the year 2013-14. The highest growth of India’s Import from China was recorded in the year 2007-08 when import grew by 64.20 per cent over the year 2005-06. The lowest growth of India’s Import from China was recorded in the year 2009-10 when import grew negatively by 1.05 per cent over the year 2008-09 which is only year during the study period when India’s import from China grew negatively while India’s Export to China grew negatively in three different years.
Considering the base year 2000-01, the indices have also been calculated for the given data for the period under consideration and has been found that Indices of India’s Export to China has increase to 5384.89 in the year 2014-15 from the base year. In the first eight year of the study period India’s export to China grew with increasing rate upto the year 2008-209 in the year 2009-10 indices decline to 2128.06 from 2150.75 from previous year, indicating lesser rate of export to China from India with respect to previous year it may be due to global recession, after that India’s Export to China Increased by Increasing rate till the final year of our study 2014-15. Indices of India’s Import from China was 141.51 in the year 2001-02 which increase to 5384.89 in the year 2014-15 showing a great level of increase in import from China during the period under study. It is interesting to note that during the period under study indices of India’s Import from China increase with increasing rate without any downfall in between the years.
(c) Commodity Composition
India’s export basket to China has been mainly dominated be primary and resource-based products but there are some signs of diversification in Indian exports in recent years to China, while the India’s import from china began to take momentum during recent decade and this is mostly led be technology-intensive sectors and manufactured products. The 25 major commodities which are studied comprise 93.58 % of the total India China trade. The major commodity exported from India to China are (1) Cotton (2) Pearls, precious stones, metals, coins, etc. (3) Copper and allied articles (4) Organic chemicals (5) Salt, sulphur, earth, stone, plaster, lime and cement.etc. The major commodities imported from China to India are (1) Electrical, electronic equipment (2) Machinery, nuclear reactors, boilers, etc (3) Organic chemicals (4) Fertilizers (5) Iron and steel etc.
Projection of India-China trade
Projection of India China trade is done through using correlation matrix, linear regression model, and polynomial regression model.
[Table No: 4]
CORRELATION MATRIX OF DIFFERENT COMPONENT (EXPORT, IMPORT AND TOTAL TRADE) OF INDIA’S TRADE WITH CHINA
|
Correlations
|
|
|
|
Year
|
Export
|
Import
|
Total Trade
|
|
Year
|
Pearson Correlation
|
1
|
.968
|
.967
|
.976
|
|
Sig. (2-tailed)
|
|
.000
|
.000
|
.000
|
|
N
|
15
|
15
|
15
|
15
|
|
Export
|
Pearson Correlation
|
.968
|
1
|
.941
|
.961
|
|
Sig. (2-tailed)
|
.000
|
|
.000
|
.000
|
|
N
|
15
|
15
|
15
|
15
|
|
Import
|
Pearson Correlation
|
.967
|
.941
|
1
|
.998
|
|
Sig. (2-tailed)
|
.000
|
.000
|
|
.000
|
|
N
|
15
|
15
|
15
|
15
|
|
Total trade
|
Pearson Correlation
|
.976
|
.961
|
.998
|
1
|
|
Sig. (2-tailed)
|
.000
|
.000
|
.000
|
|
|
N
|
15
|
15
|
15
|
15
|
|
. Correlation is significant at the 0.01 level (2-tailed).
|
|
The above table (table No:4) shows the correlation of Export, Import as well as total trade of India’s trade with China with the year, which indicates that trend of India’s Export, Import and total with China trade is found significant in increasing order with the increase in period of time. It is also seen that export is significantly positively correlated with Import and Total trade.
The Trend of India’s Export to China according to Year
[Table No: 5.A]
Linear Regression Model
|
Model Summary
|
|
R
|
R Square
|
Adjusted R Square
|
Std. Error of the Estimate
|
|
.968
|
.938
|
.933
|
76.323
|
|
The independent variable is year.
|
|
[Table No: 5.B]
|
ANOVA
|
|
|
Sum of Squares
|
df
|
Mean Square
|
F
|
Sig.
|
|
Regression
|
1141922.808
|
1
|
1141922.808
|
196.031
|
.000
|
|
Residual
|
75727.776
|
13
|
5825.214
|
|
|
|
Total
|
1217650.584
|
14
|
|
|
|
|
The independent variable is year.
|
|
|
|
[Table No: 5.C]
|
Coefficients
|
|
|
Unstandardized Coefficients
|
Standardized Coefficients
|
t
|
Sig.
|
|
|
B
|
Std. Error
|
Beta
|
|
year
|
63.862
|
4.561
|
.968
|
14.001
|
.000
|
|
(Constant)
|
-74.863
|
41.471
|
|
-1.805
|
.094
|
It is seen that the quantity of Export from India to China is in increasing order as increase by Year, The linear Regression Model is Expressed as Yt = a+b.t where as
y=Values of Export at time t.
a=Constant
b= regression coefficient of t.
Here 2000-2001, is the beginning of the year and denoted by = 1. For the prediction of export value from India to China the best fitted regression model is used which is denoted by = + .t. The volume of R2 indicates that 93.8% variation in India’s Export values to China is specified by this model. R2 is generally called the coefficient of determination. The Linear Regression model is significant or not for determining the export values for different year, the Analysis of Variance (ANOVA) test is applied which reflect that this Linear Regression model is Highly Significant for the India’s Export to China for Different Years. After knowing the significancy of the Regression model, the Values of constant (a) and regression coefficient (b) is estimated which is found as = -74.863 and = 63.862. On the basis of these estimate the export values from India to China is calculated for the different years on the basis of assumption that such type of trend exist. For predicting the export values for 20 years later from 2000-2001 i.e.
(2019-2020) = -74.863+ (63.862)20
= Rupees 1202.38 Billion
Similarly we can predict the Export Values from India to China for different period of time which is presented in the Table No: 8. the significancy of regression coefficient is tested with the help of t-test which is provided in the table No: 5.C. The figure below (figure No: 2) shows the Observed and Estimated Export Values of India’s Export to China during different Period of time.
[Figure No: 2]
The Observed and Estimated Export values of India’s Export to China during Different Period of Time
Polynomial Regression Model
|
Model Summary
|
|
R
|
R Square
|
Adjusted R Square
|
Std. Error of the Estimate
|
|
.996
|
.991
|
.990
|
125.069
|
|
The independent variable is year.
|
|
[Table No: 6.B]
|
ANOVA
|
|
|
Sum of Squares
|
df
|
Mean Square
|
F
|
Sig.
|
|
Regression
|
2.095E7
|
2
|
1.047E7
|
669.635
|
.000
|
|
Residual
|
187707.305
|
12
|
15642.275
|
|
|
|
Total
|
2.114E7
|
14
|
|
|
|
|
The independent variable is year.
|
|
|
|
[Table No: 6.C]
|
Coefficients
|
|
|
Unstandardized Coefficients
|
Standardized Coefficients
|
t
|
Sig.
|
|
|
B
|
Std. Error
|
Beta
|
|
year
|
-4.379
|
32.040
|
-.016
|
-.137
|
.894
|
|
year 2
|
16.883
|
1.947
|
1.011
|
8.670
|
.000
|
|
(Constant)
|
-2.443
|
111.403
|
|
-.022
|
.983
|
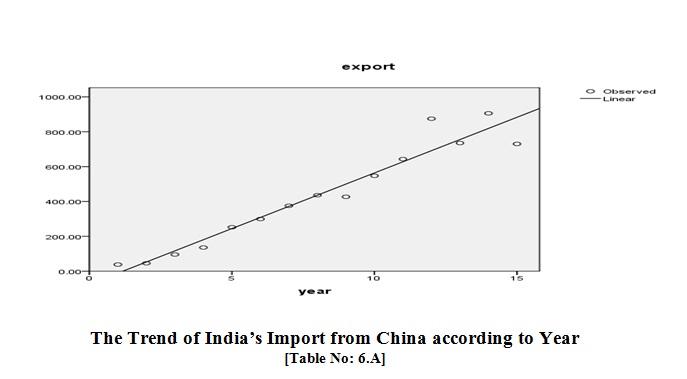
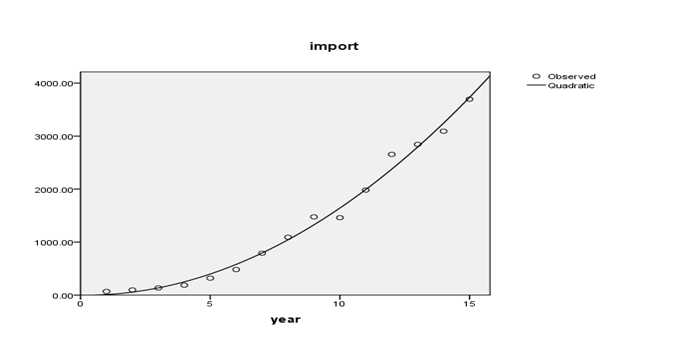
It is seen that quantity of India’s Import from China is in increasing order during the period under study as increase by Year except for the year 2009-2010, the Polynomial Regression Model is expressed as Yt=a+b.t+c.t2 where
a=constant
b=Regression Coefficient of t
c=Regression Coefficient of t2
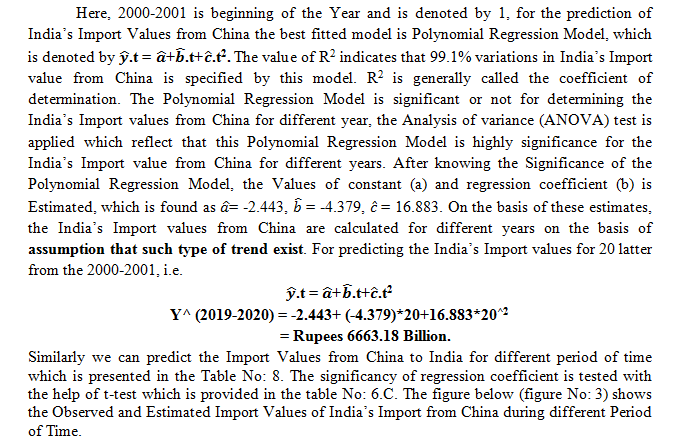
[Figure No: 3]
The Observed and Estimated Values of India’s Import from China during different Period of Time
The Trend of India’s Total Trade with China according to Year
[Table No: 7.A]
Polynomial Regression Model
|
Model Summary
|
|
R
|
R Square
|
Adjusted R Square
|
Std. Error of the Estimate
|
|
.995
|
.989
|
.987
|
168.942
|
|
The independent variable is year.
|
|
[Table No: 7.B]
|
ANOVA
|
|
|
Sum of Squares
|
df
|
Mean Square
|
F
|
Sig.
|
|
Regression
|
2.095E7
|
2
|
1.047E7
|
669.635
|
.000
|
|
Residual
|
187707.305
|
12
|
15642.275
|
|
|
|
Total
|
2.114E7
|
14
|
|
|
|
|
The independent variable is year.
|
|
|
|
[Table No: 7.C]
|
Coefficients
|
|
|
Unstandardized Coefficients
|
Standardized Coefficients
|
t
|
Sig.
|
|
|
B
|
Std. Error
|
Beta
|
|
year
|
-4.379
|
32.040
|
-.016
|
-.137
|
.894
|
|
year 2
|
16.883
|
1.947
|
1.011
|
8.670
|
.000
|
|
(Constant)
|
-2.443
|
111.403
|
|
-.022
|
.983
|
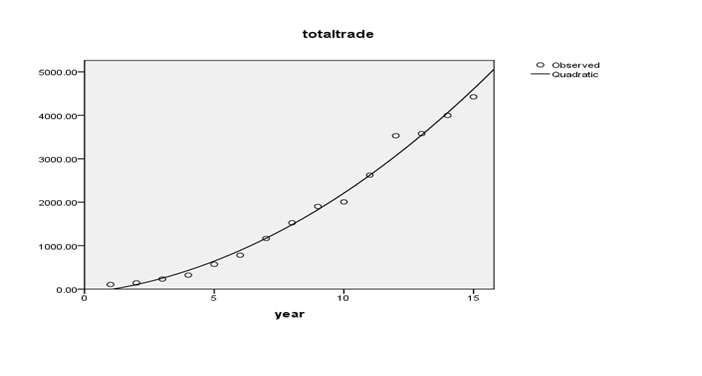
It is seen that the quantity of India’s total trade with China during the period under study is in increasing order with the increase in duration of time. The Polynomial Regression Model is expressed as Yt=a+b.t+c.t2 where
a=constant
b=Regression Coefficient of t
c=Regression Coefficient of t2
Here, 2000-2001 is beginning of the Year and is denoted by 1, for the prediction of India’s Total trade Values with China the best fitted model is Polynomial Regression Model which is denoted .t = + .t+ .t2. The value of R2 indicates 98.9% variations in India’s total trade with China by this model; R2 is generally called the coefficient of determination. The Polynomial Regression Model is significant or not for determining values of the India’s total trade with China for different year, the Analysis of variance (ANOVA) test is applied which reflect that this Polynomial Regression Model is highly significance for the India’s total trade value with China for different years. After knowing the Significancy of the Polynomial Regression Model, the Values of constant (a) and regression coefficient (b) is estimated, which is found as = -88.497 , = 63.432, = 16.636. On the basis of these estimates, the India’s total trade with China are calculated for different years on the basis of assumption that such type of trend exist. For predicting the India’s total trade values with China for 20 latter from the 2000-2001, i.e.
(2019-2020) = -88.497+(63.432)(20)+(16.636)(20)^2
= Rupees 7834.54 Billion
Similarly we can predict the Total trade Values of India’s trade with China for different period of time which is presented in the Table No: 8. the significancy of regression coefficient is tested with the help of t-test which is provided in the Table No: 8.C. The figure below (figure No: 4) shows the observed and estimated Total trade values of India’s trade with China during Different Period of Time.
[Figure No: 4]
The Observed and Estimated Values of India’s total trade with China during Different Period of Time
[Table No: 8]
PROJECTION OF INDIA’S EXPORT, IMPORT AND TOTAL TRADE WITH CHINA
(Values in Rupees Billion)
|
YEARS
|
EXPORT
|
PROJECTED EXPORT
|
IMPORT
|
PROJECTED IMPORT
|
TOTAL TRADE
|
PROJECTED TOTAL TRADE
|
|
2000-01
|
37.98
|
-11.00
|
68.63
|
10.06
|
106.61
|
-8.43
|
|
2001-02
|
45.4
|
52.86
|
97.12
|
56.33
|
142.52
|
104.91
|
|
2002-03
|
95.6
|
116.72
|
135.12
|
136.37
|
230.73
|
251.52
|
|
2003-04
|
135.79
|
180.59
|
186.25
|
250.17
|
322.04
|
431.41
|
|
2004-05
|
252.33
|
244.45
|
318.92
|
397.74
|
571.25
|
644.56
|
|
2005-06
|
299.25
|
308.31
|
481.17
|
579.07
|
780.42
|
890.99
|
|
2006-07
|
375.3
|
372.17
|
790.09
|
794.17
|
1165.38
|
1170.69
|
|
2007-08
|
435.97
|
436.03
|
1091.16
|
1043.04
|
1527.14
|
1483.66
|
|
2008-09
|
426.61
|
499.90
|
1476.06
|
1325.67
|
1902.67
|
1829.91
|
|
2009-10
|
547.14
|
563.76
|
1460.49
|
1642.07
|
2007.63
|
2209.42
|
|
2010-11
|
643.15
|
627.62
|
1980.97
|
1992.23
|
2623.94
|
2622.21
|
|
2011-12
|
874.71
|
691.48
|
2654.66
|
2376.16
|
3529.36
|
3068.27
|
|
2012-13
|
735.3
|
755.34
|
2843.85
|
2793.86
|
3579.14
|
3547.60
|
|
2013-14
|
905.61
|
819.21
|
3092.35
|
3245.32
|
3997.96
|
4060.21
|
|
2014-15
|
730.3
|
883.07
|
3695.65
|
3730.55
|
4425.96
|
4606.08
|
|
2019-20
|
|
1202.38
|
|
6663.18
|
|
7834.54
|
|
2024-25
|
|
1521.69
|
|
10439.96
|
|
11894.80
|
|
2029-30
|
|
1841.00
|
|
15060.89
|
|
16786.86
|
|
2034-35
|
|
2160.31
|
|
20525.97
|
|
22510.72
|
|
2039-40
|
|
2479.62
|
|
26835.20
|
|
29066.38
|
|
2044-45
|
|
2798.93
|
|
33988.58
|
|
36453.84
|
|
2049-50
|
|
3118.24
|
|
41986.11
|
|
44673.10
|
Source-Researcher’s own calculation
(3) (A) Impact of India’s foreign trade with China on its economic development.
Impact of India’s foreign trade with China on its economic development is analyses through the regression analysis of India’s export to China and growth in its GDP (gross domestic product) as given in the table below
[Table No: 9]
Impact of Bilateral trade between India and China on their Economic Development
(Values in US$ thousands)
|
YEAR
|
China's Export to India
|
China's GDP
(current US$)
|
India's Export to China
|
India’s GDP
(current US$)
|
|
2001
|
1827549
|
1332234720
|
922,542
|
493954161
|
|
2002
|
2619849
|
1461906488
|
1,531,604
|
523968381
|
|
2003
|
3615126
|
1649928718
|
2,567,162
|
618356467
|
|
2004
|
6051257
|
1941745602
|
4,098,514
|
721584805
|
|
2005
|
10167061
|
2268598904
|
7,183,792
|
834214700
|
|
2006
|
15639064
|
2729784032
|
7,829,168
|
949116770
|
|
2007
|
24575772
|
3523094315
|
9,491,978
|
1238699170
|
|
2008
|
31586024
|
4558431073
|
10,093,927
|
1224097069
|
|
2009
|
30613371
|
5059419738
|
10,370,052
|
1365371474
|
|
2010
|
41249116
|
6039658508
|
17,439,991
|
1708458877
|
|
2011
|
55483025
|
7492432098
|
16,717,786
|
1835814450
|
|
2012
|
54140455
|
8461623163
|
14,729,317
|
1831781515
|
|
2013
|
51635444
|
9490602600
|
16,416,825
|
1861801615
|
|
2014
|
58230546
|
10354831729
|
13,434,251
|
2048517439
|
|
2015
|
61604427
|
10983000000
|
9,576,579
|
2091000000
|
Sources-Compiled from World Bank
[Table No: 10.A]
|
Model Summaryb
|
|
Model
|
R
|
R Square
|
Adjusted R Square
|
Std. Error of the Estimate
|
|
1
|
.883a
|
.779
|
.762
|
280824898.47555
|
|
a. Predictors: (Constant), IND_Ex_to_China
|
|
b. Dependent Variable: IndiaGDP
|
[Table No: 10.B]
|
ANOVAa
|
|
Model
|
Sum of Squares
|
df
|
Mean Square
|
F
|
Sig.
|
|
1
|
Regression
|
3616532166223020500.000
|
1
|
3616532166223020500.000
|
45.859
|
.000b
|
|
Residual
|
1025214106849406720.000
|
13
|
78862623603800512.000
|
|
|
|
Total
|
4641746273072427000.000
|
14
|
|
|
|
|
a. Dependent Variable: IndiaGDP
|
|
b. Predictors: (Constant), IND_Ex_to_China
[Table No:10.C]
|
|
Coefficientsa
|
|
Model
|
Unstandardized Coefficients
|
Standardized Coefficients
|
t
|
Sig.
|
|
B
|
Std. Error
|
Beta
|
|
1
|
(Constant)
|
418515213.895
|
147684450.322
|
|
2.834
|
.014
|
|
IND_Ex_to_China
|
91.774
|
13.552
|
.883
|
6.772
|
.000
|
|
a. Dependent Variable: IndiaGDP
|
From the above regression analysis we find that model summary [table No: 10.A] depicts, R2=0.779 which means 77% of the total variability in India’s GDP is caused by the predictor variable, i.e. India’s export to China. Also F-statistics in ANOVA table [table No: 10.B] is significance as degree of freedom is f (1, 13) and coefficient table [table No: 10.C] shows the significance of impact. As p-value is lesser than the a-value, i.e. (p=.000 < a = 0.05) at 95 percent level of significance. Therefore it is concluded that there is significant impact of predictor over dependent variable. Therefore it is evident that India’s export to China has great impact over economic development of India.
3(B) Impact of China’s foreign trade with India on its economic development
Impact of China’s foreign trade with India on its economic development is analyses through the regression analysis of China’s export to India and growth in its GDP (gross domestic product)
[Table No: 11.A]
Impact of China’s Foreign trade with India on its Economic Development
|
Model Summaryb
|
|
Model
|
R
|
R Square
|
Adjusted R Square
|
Std. Error of the Estimate
|
|
1
|
.974a
|
.949
|
.945
|
804103016.57472
|
|
a. Predictors: (Constant), ChinaExto_IND
|
|
b. Dependent Variable: ChinaGDP
|
[Table No: 11.B]
|
ANOVAa
|
|
Model
|
Sum of Squares
|
df
|
Mean Square
|
F
|
Sig.
|
|
1
|
Regression
|
156679788028102020000.000
|
1
|
156679788028102020000.000
|
242.320
|
.000b
|
|
Residual
|
8405561596439418900.000
|
13
|
646581661264570620.000
|
|
|
|
Total
|
165085349624541450000.000
|
14
|
|
|
|
|
a. Dependent Variable: ChinaGDP
|
|
b. Predictors: (Constant), ChinaExto_IND
|
[Table No: 11.C]
|
Coefficientsa
|
|
Model
|
Unstandardized Coefficients
|
Standardized Coefficients
|
t
|
Sig.
|
|
B
|
Std. Error
|
Beta
|
|
1
|
(Constant)
|
699245929.568
|
353683431.253
|
|
1.977
|
.070
|
|
ChinaExto_IND
|
148.893
|
9.565
|
.974
|
15.567
|
.000
|
|
a. Dependent Variable: ChinaGDP
|
From the above regression analysis we find that model summary [table No: 11.A] depicts, R2=0.949 which means 94% of the total variability in China’s GDP is caused by the predictor variable, i.e. China’s export to India. Also F-statistics in ANOVA table [table No: 11.B] is significance as degree of freedom is f (1, 13) and coefficient table [table No 11.C] shows the significance of impact. As p-value is lesser than the a-value, i.e. (p=.000 < a = 0.05) at 95 percent level of significance. Thus it is concluded that there is significant impact of predictor over dependent variable. Therefore it is evident that China’s export to India has great impact over economic development of China. It can also be concluded that India is more important for China than China is for India; China is dependent more than India on foreign trade.
[Table No: 12]
|
YEAR
|
Export intensity index
|
Import intensity
|
Trade Intensity Index
|
|
2001
|
0.54
|
0.82
|
0.53
|
|
2002
|
0.68
|
0.89
|
0.66
|
|
2003
|
0.80
|
0.84
|
0.78
|
|
2004
|
0.89
|
0.93
|
0.87
|
|
2005
|
1.14
|
0.97
|
1.12
|
|
2006
|
0.98
|
1.07
|
0.98
|
|
2007
|
0.94
|
1.26
|
0.94
|
|
2008
|
0.79
|
1.10
|
0.78
|
|
2009
|
0.72
|
1.16
|
0.72
|
|
2010
|
0.85
|
1.11
|
0.85
|
|
2011
|
0.57
|
1.13
|
0.58
|
|
2012
|
0.50
|
0.98
|
0.51
|
|
2013
|
0.46
|
0.93
|
0.47
|
|
2014
|
0.40
|
1.01
|
0.41
|
|
2015
|
0.35
|
1.11
|
0.35
|
Export intensity is the most widely used measures to assess exports performance, An index of more than one indicates higher Export intensity between the nations, Similarly an index of more than one indicates higher import intensity between the nations. For trade Intensity Index, an index of more than one indicates that trade flow between countries/regions is larger than expected given their importance in world trade. India’s Export Intensity during the period under has always be less than one except in the year 2005 (as shown in table No:10), as a result of MOU (Memorandum of Understanding) between Ministry of Indian and Chinese Government Indian at Beijing, 21-07-2004, Indian Export to China recorded appreciable growth in the year 2005, but again in all the year Export Intensity was less than one while the Import intensity has always less than export intensity. The trade intensity was more than one in the year 2005 which also was the result of MOU held at Beijing in the year 2004.
It can be noted that the export intensity of our country with China has been relatively low as compared to the import intensity. It can be analysed from the table, that India exports much less to China market than what it should be and China imports much less from the Indian market than what it should be. There is scope for mutual trade expansion between India and China, which can be achieved by suitable policy instruments. India’s intensity to export has been extremely low in the past more than a decade (2000-01 to 2014-15). The index further reveals that the magnitude of our trade has been slow. Conversely during the period under study, our import intensity index with this market reveals that the demand of Chinese products has been extremely dominating in our domestic market. Thus, it can be advised that our country needs to balance our exports with that of the imports from China as it has been continuously affecting the BOP (balance of payment) and our Barter terms of trade. Therefore greatest problem of India’s trade with China is India’s growing trade deficit with China.
- Problems of India’s trade with China
- Dumping by China in India
[Table No: 13]
Cases under investigation and duty not yet imposed/duty imposed by
India so far against all countries (as on 30/6/2014)
|
Sl. No
|
Country
|
No. of Initiations
|
Duty Imposed
|
|
1
|
China
|
166
|
134
|
|
2
|
European Union
|
80
|
64
|
|
3
|
Korea RP
|
54
|
41
|
|
4
|
Chinese Taipei
|
52
|
42
|
|
5
|
Thailand
|
37
|
28
|
|
6
|
USA
|
37
|
28
|
|
7
|
Japan
|
34
|
29
|
|
8
|
Singapore
|
24
|
19
|
|
9
|
Malaysia
|
22
|
17
|
|
10
|
Russia
|
22
|
14
|
|
11
|
other
|
162
|
119
|
|
Total
|
690
|
536
|
Sources- World trade Organization
The table above (table No:5) shows that China is the greatest threat to India in the case of dumping activities where India is force to impose duty on the imported product from China. followed by EU, but there is great difference in the duty imposed against China and EU. Apart from the list given above India also impose anty dumping duty on the following countries, they are Australia, Bangladesh, Belarus, Brazil, Bulgaria, Canada, Egypt, Hong kong, Indonesia, Iran, Israel, Kenya, Mexico, Nepal, New Zealand, Norway, Oman, Pakistan, Philippines, Qatar, Vietnam etc. China took the world by storm with its low-cost manufactured products. Foreign markets flooded with Chinese goods are a testimony to that. China therefore becomes the obvious target for countries initiating anti-dumping measures. Most of the anti-dumping measures have only been initiated but a final verdict is yet to be out as all these cases have to go through WTO's Dispute Settlement Body to come into effect.
- India’s growing trade deficit with China
India’s export to China was Rupees 37.98 Billion in the year 2000-2001 while its Import from China was Rupees 68.63 Billion leading to Trade Deficit of Rupees 30.65 Billion. India’s trade deficit with China is on continues growth and it is all the time in negative balance during the period under study. In fact India’s negative trade balance is continuing since long time. The deficit trade balance of India with China increased by nearly six time from 2000-2001 to 2005-2006. Then again it increased by more than seven times in next five year from 2005-2006 to 2010-2011. It continue to grow and reached to a deficit trade balance of rupees 2965.35 in the year 2014-215. During this short period of fifteen year, India’s trade deficit with China grew to more than ninety five times which show a very very dangerous trade deficit of Indian economy with China. The Highest Growth in India’s trade deficit with China during the period under study was recorded in the year 2005-5006 when it grew to 176 per cent over the year 2000-2005 while the lowest growth was recorded in the year 2002-2003 when amount of trade deficit fell from rupees 51.72 Billion in the year 2001-2002 to rupees 39.52 billion in the year 2002-2003.
- Trade restriction
India and China often blame each other of having higher trade barriers in form of tariff and non tariff barriers. Although India has steadily opened up its economy, its tariffs continue to be high when compared with other countries, and its investment norms are still restrictive. This leads some to see India as a ‘rapid globalizer’ while others still see it as a ‘highly protectionist’ economy. For various reasons, Chinese companies routinely complain the long bureaucratic procedures and frequent "security" concerns raised by Indian officials while clearing projects. There are issues of getting visas and work permits for professionals and workers. Non-tariff barriers are more than tariff barriers in China on the other hand tariff barriers are more in India than Non-tariff barriers. Higher tariff often leads to the practice of dumping.
- Yuan Devaluation
China’s national currency is known as yuan renminbi (RMB) or yuan. In India the currency is traded freely in the interbank foreign exchange market but in China the currency has been linked to the US dollar. From time to time China devalue its currency, recently it devalue its currency in August 2015, The yuan slide may lead to currency wars, as other Asian countries rush to devalue to protect their exports and improve their competitive advantage vis-a-vis goods manufactured in China. Yuan devaluation will hit Indian exports, widen trade deficit, the devaluation of the Chinese currency is a ‘worrying’ development which will make Indian exports expensive and widen the trade deficit with the neighbouring nation, It is going to make imports from China even more cheaper (to India)
Several other problems of India’s trade with China has been identified which directly or indirectly are affecting the trade, some of them are them are historical with other arise due to the political and other factors. The major problems identified under this heads are (1) International Relation and Foreign Trade Policy (2) Political Problems (3) Disputed territories (4) Possibility of War with China (5) Issues of Tibet (6) Dispute over sharing river water (6) Inefficiency of Indian SEZ (Special Economic Zone) and EOU (Export Oriented Unit) in comparison to China (7) Affect of nuclear test on bilateral trade etc.
Advantages of China over India
- Remarkable growth of Chinese GDP over three decade depicts that the Growth and development of Chinese economy is faster than Indian economy.
- China’s land area is almost three times of India, where India’s land area is only 3.287millionkm² while China’s Land Area is 9.597millionkm². Therefore there is no shortage of land in China even though its size of population is more than India.
- Remarkable growth of secondary sector is noticed over a decade in Chinese economy which provides more employment opportunity to its population than India.
- Even though China has less political freedom in comparison to India but China has more economic freedom than India.
- Saving rate of China is more than India.(as per world development report 2015-16)
- Per capita income in China is more than India.(as per world development report 2015-16)
- India ranks low at 60th position, in global ranking of better institutional facilities while China’s rank is better than India at 51st Position in global ranking.
- In case of basic Infrastructure facilities China rank at 39th Position while India is at low 81st Position in global ranking
- In microeconomic environment India’s position is worst with comparison to China who stands at 8th Position while India holds 91st Position in global ranking.
- Health and primary education in China is better in China as it hold 44th rank while India is at 84th
- On many other grounds also China is in better position than India like higher education and training, goods market efficiency, Labour market efficiency, Technological readiness, market Size, Business Sophistication, Innovation.
Advantages of India over China
- India has better investment rate than China. India stands on 53rd Position where as China hold 54th Position in financial market development of global ranking.
- India has better quality service than China especially in banking and passenger and cargo transportation. (as per world development report 2015-16)
- India has world's largest youth population which means there is great opportunity to convert young energy into asset for India where as China is still struggling with its old age population.
C Indian labour market has competitive advantage over China, which means India has more affordable labour than China, where the pay is more than double of what is being offered locally.
Suggestions
(1)Effort should be made by Indian government to create more conducive trading and investment environment in the country so as to attract more investment from China and other countries, which will help bridge the trade deficit in the country.
(2) India should export whatever it can to whichever destination is profitable at the best possible price. In turn, it should import whatever it needs from wherever at the best possible price. This implies that India should run a trade surplus with relatively uncompetitive countries (like Pakistan, Bangladesh), and run a trade deficit with highly competitive countries (like China, Germany).
(3) It is very difficult for India to beat China, therefore India should continue trade with China with readiness to sustain trade deficit and should develop the trade relationship with other economies where India can earn trade surplus.
(4) Both China and India still have far too many barriers to trade and investment, and these need lowering. Chinese non-tariff barriers are higher, and Indian negotiators must focus on this. While Indian tariff barriers are more than China, therefore this should be taken into consideration while framing trade policy for India-China trade. This would encourage the trade strength between two countries.
(5) India is importing more manufactured items from China and exporting very less, which is causing trade deficits, therefore government should adopt import substitution by encouraging the manufacturing of those goods for which India is paying huge amount of forex to China.
(6) India and China should reinforce bilateral relations between them by exploring opportunities in aviation, investment and growth industries. Improving the communication between the business communities of both the countries can strengthen the trade relationship between the two countries.
References
Agrawal. Pradeep, Sahoo. Pravakar (2003) China's Accession to WTO Implications for China and India. Economic and Political Weekly, Vol. 38, No. 25 pp. 2544-2551.
Ali Ifzal and Fan. Emma Xiaogin (2004) ‘The Primacy of Reforms in the Emergence of Peoples Republic of China and India,’ ERD policy Brief NO: 32, Asian Development Bank Policy brief Series No-32.
Albert Guangzhou Hu and Zhengning Liu(2012) ‘Trade Liberalization and Firm Productivity: Evidence from Chinese manufacturing industries’, Department of Economics, National University of Singapore.
Arora Charu (2008); “Indian Economy and Reforms”; Authors press, New Delhi.
Bhasin Niti. (2005); External sector reforms in India 1991-2005; New century publication; New Delhi, page No.9.
Desroches (2009)“Indian China and world Economy” European Journal of Comparative Economics, Vol.3.
Datt Guarav and Mahajan Ashwani (2010) Indian Economy; S. Chand & Company Pvt.Ltd, New Delhi. page no.809,810
Gregory C. Chow (2004), Economic Reform and Growth in China, Department of Economics, Princeton University, USA.
Harsh. V. Pant (2006), “Indian Foreign Policy and China”.
Jeff. M. Smith(2014), Cold Peace, China-India Rivalry in the Twenty-first Century ’, Lexington Books, A wholly own subsidiary of Rowman and Little Field 4501 forbes Boulevard, Suite 200, Lanham, Maryland 2070b.
Kong Xiangzhi et al (2008), 30 Years of Agricultural Reform in China: Process, Experience and Prospects, China‐Europa Forum.
Krishna Ranjan. Ram(2006), “Special Economic Zones: Are They Good for the Country?”, CCS Working Paper No. 156 Summer Research Internship Program, Centre for Civil Society
Leonard K. Cheng, ‘China's Economic Benefits from Its WTO Membership’, Department of Economics Hong Kong University of Science and Technology.
Morrison. M. Wayne and Labonte. Marc (July 22, 2013), “China's Currency Policy: An Analysis of the Economic Issues” Congressional Research service.
Mohanty. S.K (2014),” India-China Bilateral Trade Relationship”, Study Prepared for Reserve Bank of India, RIS (Research and Information System for Developing Countries).
Mathur Vibah. (2003); India: Foreign Trade Policy and WTO (1991- 2003); New century publication; New Delhi, Page No.153.)
Quer. Diego, Clever. Enrique and Birender (2010) ‘Doing Business in China and Performance: A Review of Evidence’, Emerald Publisher Vol.4, No1.
Sudip Ranjan Basu(2010) The European Journal of Comparative Economics, Vol. 6, n.1, pp. 57-99.
Venu.M.K(2015) “Investment the Way to Reduce India- China Trust Deficit”. ‘the Wire-external affairs.’
Wu Lin and Li Fujian(2013), “India-China Relations: How Can They Be Improved? Part One: A View from Beijing”, strategy Analysis paper.
Wayne M. Morrison (2015), ‘China’s Economic Rise: History, Trends, Challenges, and Implications for the United States’ Office of the State Council, The People's Republic of China December 2011, Beijing.

