A Refereed Monthly International Journal of Management
Expatriates' Cultural Intelligence and Work Outcomes in China
Author
|
Barbara Diemer
421 Wyndon Road
Ambler, PA 19002
|
Abstract
Purpose – International assignment failures cost an organization roughly 3 to 4 times an expatriate’s annual salary with the most expatriate failures cited for work assignments in China. Previous scholarly research identified cultural intelligence (CQ) as being influential to expatriate work outcomes. The purpose of this study was to examine the relationships among a subset of Cultural Intelligence (CQ) predictor variables and work outcome related dependent variables.
Design/methodology/approach – Correlation and regression analysis were performed to determine whether a relationship exists between sub-dimensions of CQ including (a) cognitive CQ, (b) metacognitive CQ, (c) motivational CQ, and (d) behavioral CQ and the expatriate work outcomes of (a) work adjustment, (b) work performance, (c) work effectiveness, and (d) job satisfaction. The study included self-reported measurements collected via online surveys from 253 expatriates with work experience in China.
Findings – Pearson correlation test results and multiple linear regression analysis indicated significant predictive relationships between CQ and work adjustment, CQ and work effectiveness, CQ and work performance, and CQ and job satisfaction. Specifically, the motivational CQ variable had a statistically significant predictive power for work adjustment, work effectiveness, work performance, and job satisfaction. These findings suggest that the CQ construct may help to assess one aspect of expatriate assignment readiness.
Research limitations/implications - A significant limitation of the study was the self-report nature of the survey. Common method variance could occur because of self-reporting of the study variables. The participants might provide more positive and proactive types of responses than what occurred in their lived experience. Another limitation of the study is that survey participants received notification of availability of the survey through expatriate related LinkedIn groups. Using snowball-sampling techniques, survey participants forwarded the survey link to other expatriates. This sampling method is not random and therefore could introduce some bias to the study results.
Practical Implications – The implications of this study include the utilization of CQ in better identification, selection, and training of employees for international assignments; improvement of expatriate work outcomes; reduction of expatriate turnover; and reduction of expatriate assignment costs.
Social implications - The social change benefits encompass the improvement of intercultural communications and relationship building competencies of business professionals. Positive communication and newly established relationships with international partners and expatriates may lead to increased levels of foreign direct investment (FDI) in emerging economies and domestically in the United States. The inflows of FDI can potentially fuel increased economic prosperity and employment opportunities in emerging economies. The increase in business opportunities in Brazil, Russia, China, and India (the BRICs) led to emerging middle classes in previously poor communities. The increase of middle classes in emerging countries can lead to greater economic prosperity globally.
Originality/value – Quantitative analysis regarding the relationship between CQ and work outcomes for expatriates working in China does not currently exist in the scholarly research.
Keywords – Expatriate, Cultural Intelligence (CQ), Work adjustment, Work performance, Work effectiveness, Job satisfaction
Paper type – Research paper
INTRODUCTION
Central banks and statistical offices around the world estimated that China had foreign direct investment inflows of $253 billion for 2012, based upon balance of payments statistics (Organisation for Economic Co-operation and Development [OECD], 2013). Foreign direct investment figures include the use of expatriates (Peng, 2012a). Brookfield (2012) indicated that China had the highest number of expatriate failures. The future success of multinational corporations (MNC) relies on, in part, the identification, training, and support programs for expatriates (Gunkel et al., 2014). Researchers identified expatriate identification, training, and support programs as potential success factors to overseas assignments (Adams, Srivastava, Herriot, & Patterson, 2013; Froese & Peltokorpi, 2011; Min, Magnini, & Singal, 2013; Zhang, 2013).
The early termination and failure of expatriate assignments causes significant financial losses; with each failure costing an organization, roughly US $200,000 (Tungli & Peiperl, 2009) or three to four times greater than their annual salary (McEvoy, 2011). Tungli and Peiperl (2009) estimated up to 6% of international assignments end in premature returns. These early termination cost estimates do not include (a) the additional indirect costs associated with inadequate work outcomes, (b) failures for partnering organizations, (c) host country nationals, and (d) personal losses experienced by expatriates and their respective family members (Tungli & Peiperl, 2009). Previous scholarly research included the following factors as being influential to expatriate work outcomes: cultural intelligence and cross-cultural training (Lee & Sukoco, 2010; Malek & Budhwar, 2013; Okpara & Kabongo, 2011; Rehg, Gundlach, & Grigorian, 2012; Ward, Wilson, & Fischer, 2011). Researchers suggested the use of cultural intelligence scores to assess candidate identification and selection criteria; to determine additional requirements for cross-cultural training, organizational support, mentoring, and repatriation support; improvement of cross-cultural adjustment; and work outcomes are the intention (Fischer, 2011; Huff, 2013; Mahajan & De Silva, 2012).
Chen, Lin, and Sawangpattanakul (2011) reported scarce quantitative data regarding potential relationships between the dimensions of CQ and work outcomes for expatriates working in China. The identification of such factors is beneficial in determining assignment readiness and additional expatriate identification, training, and support program needs (Chen et al., 2011; Varma, Pichler, Budhwar, & Kupferer, 2012; Zhang, 2013). Improvement in the factors identified in the study could decrease costs, improve expatriate work outcomes, and improve cross-cultural communication in international business (Collins & Kriz, 2013; Gunkel, Schlägel, & Engle, 2014; McNulty, De Cieri, & Hutchings, 2013; Tait, De Cieri, & McNulty, 2014; Varma et al., 2012).
LITERATURE REVIEW
2.1 Expatriate work outcomes
Researchers measured expatriate work outcomes in various manners including cross-cultural adjustment, job performance, job satisfaction, ROI, withdrawal intentions, and turnover intentions (Black & Stephens, 1989; Earley, 1987; Grinstein & Wathieu, 2012; Lee & Kartika, 2014; McNulty et al., 2013; Pinto et al., 2012; Selmer & Lauring, 2013; Tsui & Ohlott, 1988; West et al., 1987; Wu & Ang, 2011). Four related measures of work outcomes selected for this study and used by researchers include: (a) work adjustment, (b) work performance, (c) work effectiveness, and (d) job satisfaction (Black & Stephens, 1989; Earley, 1987; Selmer & Lauring, 2013; Tsui & Ohlott, 1988; West et al., 1987). A detailed review of each work outcome variable follows.
2.1.1 Work adjustment
Cross cultural adjustment (CCA) is the relative comfort, ease, and adaptability an expatriate may encounter while living in a foreign environment, interacting with HCNs, and performing work responsibilities (Black & Stephens, 1989; Lin et al., 2012a; Peltokorpi & Froese, 2012; Sri Ramalu et al., 2011). Black and Stephens (1989) identified the three main types of CCA outcomes as (a) general, (b) work, and (c) interaction. General adjustment refers to the ease and comfort of navigating routines associated with daily life (e.g., climate, food, heath care, housing conditions, and shopping). Work adjustment is the ability of an expatriate to meet expectations, complete tasks, and demonstrate performance. Interaction adjustment is the ability to have positive communication and interaction with host country nationals (HCNs) in and outside the place of work (Black & Stephens, 1989).
Work adjustment refers to the CCA expatriates experience within the work environment; an expatriate’s ability to adapt to role novelty, role ambiguity, role conflict, and role overload (Black & Stephens, 1989; Selmer & Lauring, 2013). Some of the particular aspects included in the work adjustment measurement are (a) specific job responsibilities, (b) performance standards and expectations, and (c) supervisory responsibilities. Okpara and Kabongo (2011) concluded that various forms of cross-cultural training (CCT) had a significant positive influence on CCA, specifically work adjustment, general conventional training, general experimental training, specific experimental training, and specific conventional training. Okpara and Kabongo (2011) corroborated Black and Mendenhall's (1989) examination of nine other studies that found positive correlations between CCA and CCT. Lovvorn and Chen (2011) posited that assignment failures might relate to the lack of CQ and CCT before embarking on an international assignment. Rehg et al. (2012) presented evidence demonstrating significant and positive relationships between CCT and CQ. Lee and Sukoco (2010) also found CQ to have a significant relationship with CCA. Given previous scholarly research results, work adjustment was selected for use in this study.
2.1.2 Work performance
Work performance refers to the timeliness, quality, relational ability, and overall performance of expatriates (Earley, 1987). Earley introduced the work performance scale in a study measuring the influence of various forms of expatriate training. Some of the particular aspects included in the work performance measurement are: (a) overall performance, (b) ability to get along with others, (c) completion of assignments in a timely manner, and (d) quality of performance (Earley, 1987). Earley demonstrated specific types of expatriate training, specifically interpersonal training, correlated with work performance.
Work performance definitions vary; a combination of knowledge, skills, abilities, and motivation toward expected job responsibilities. Researchers defined job performance as: (a) the demonstration of task performance, (b) communication performance, (c) maintaining discipline, (d) teamwork and leadership skills, (e) managerial skills, (f) administrative task performance, (g) the transfer of knowledge, (h) the use of technology, (i) self-efficacy, (j) stress tolerance, (k) relational ability, (l) previous international experience, (m) cultural intelligence, and (n) the development of sustained long-term relationships with HCNs (Lee & Donohue, 2012; Woods, Barker, & Troth, 2012).
Malek and Budhwar (2013) study results indicated there is a relationship among CQ and the following levels of expatriate adjustment and performance: CQ and general adjustment, CQ and interaction adjustment, CQ and work adjustment, and CQ and contextual work performance. Wu and Ang (2011) found correlations between various work performance measurements and CQ sub-dimensions. Earley’s (1987) work performance measurement scale was used in this study. The earlier correlations found by other researchers of work performance measurements and CQ provides justification for its use (Malek & Budhwar, 2013; Wu & Ang, 2011).
2.1.3 Work effectiveness
Work effectiveness is an individuals’ ability to match their behaviors with management expectations (Selmer & Lauring, 2013; Tsui & Ohlott, 1988). Researchers measured work effectiveness based on the supervising manager’s perceptions of meeting expectations and overall performance (Tsui & Ohlott, 1988). Some of the specific aspects included in the work effectiveness measurement are: (a) management expectations in meeting roles and responsibilities; (b) management expectations regarding job completion; and (c) management preferences for job performance. Work effectiveness correlated with work adjustment, work performance, and job satisfaction (Selmer, & Lauring, 2013). The correlation statistics provide justification for use of the work effectiveness measurement in this study.
2.1.4 Job satisfaction
Job satisfaction is the emotional satisfaction felt during a particular work assignment (Selmer & Lauring, 2013; West et al., 1987). West et al. (1987) defined job satisfaction in terms of contentment with: (a) the job, (b) work responsibilities, (c) work relationships, (d) family / life balance, and (e) value of employee contributions. Zimmerman (2008) identified multiple factors that influence job satisfaction: (a) task environment; (b) completion of tasks and other job requirements; (c) compensation; (d) communication; (e) employee personality; (f) organizational characteristics; and (g) social relations at the workplace (Froese & Peltokorpi, 2011; as cited in Peltokorpi & Froese, 2014). Zimmerman (2008) hypothesized that levels of job satisfaction influenced motivation, absenteeism, anxiety, stress, organizational commitment, turnover, and individual job performance (Froese & Peltokorpi, 2011; as cited in Peltokorpi & Froese, 2014).
West et al. (1987) measured job satisfaction in terms of the following topics: (a) work responsibilities, (b) work performance, (c) relationship with management, (d) relationship with colleagues, (e) work life balance, and (f) organizational value of contributions. Froese, Peltokorpi, and Ko (2012) found significant positive correlations between job satisfaction and work adjustment. The findings indicate potential benefits of CCT in moderating work adjustment and the variable of job satisfaction. Research regarding the potential relationship between job satisfaction and CQ is not available. The absence of this data justifies the inclusion of the variables in this study.
Researchers identified other factors outside of expatriates’ control that affect performance including: (a) cultural setting, (b) ethnic background, (c) gender, (d) nationality, (e) religion, (f) age, (g) educational qualifications, (h) intercultural experiences, and (i) role (Woods et al., 2012). This study only used four factors of work outcomes previously studied by multiple researchers: work adjustment, work performance, work effectiveness, and job satisfaction (Black & Stephens, 1989; Earley, 1987; Selmer & Lauring, 2013; Tsui & Ohlott, 1988; West et al., 1987).
2.2 Cultural Intelligence (CQ)
Cultural intelligence (CQ) originated from theories and research on emotional and social intelligences, but previous research on these types of intelligences did not adequately address the complexities of working in cross-cultural contexts (Van Dyne et al., 2009). Earley and Ang (2003) introduced the construct of CQ based upon the gap in the literature that interpreted and explained culturally based decision-making and behavioral differences in types of intelligences. Researchers identified four factors of CQ that measure an individual’s ability to interpret and respond to different cultural situations: (a) metacognitive, (b) cognitive, (c) motivational, and (d) behavioral (Van Dyne et al., 2009). Meta cognitive CQ is an individual’s ability to recognize, control, and understand thinking and thought processing (i.e., planning, monitoring, and revising) as it relates to cultural preferences (Van Dyne et al., 2009). Individuals demonstrate cognitive CQ through learned knowledge about different economic, legal, and social systems of different cultures and subcultures. Motivational CQ pertains to an individual’s motivation in trying to engage, adapt, and assimilate in a culturally different environment, and behavioral CQ involves the ability to use appropriate words, tone, gestures, and facial expressions and knowledge in interactions with culturally diverse individuals (Lin, Chen et al., 2012; Sri Ramalu et al., 2011; Van Dyne et al., 2009; 2012). Van Dyne et al. (2012) highlighted additional sub-dimensions of CQ that may further delineate differences in expatriates. Examination of each component of CQ follows.
2.2.1 Cognitive CQ
Cognitive CQ is the attainment of culturally relevant information and knowledge (Ang et al., 2007). The building of cultural information pathways like culture-general knowledge and context-specific knowledge typifies the cognitive domain of CQ (Rockstuhl, Seiler, Ang, Van Dyne, & Annen, 2011; Van Dyne et al., 2012). Sri Ramalu et al. (2011) found that cognitive CQ correlated to CCA and contextual performance. Researchers suggested that expatriates, with higher levels of CQ, possess increased abilities to use the skills typically provided by supporting practices, including training. Therefore, expatriates, with higher levels of CQ, do not require as many supporting practices and training (Wu & Ang, 2011). The indication is cognitive CQ is the first in a series of CQ building blocks to achieve higher levels of CCA.
2.2.2 Metacognitive CQ
Metacognitive CQ refers to how individuals can strategize the use of cognitive CQ attained (Ang et al., 2007). Metacognitive CQ involves higher order thinking to process and cognitively modify behaviors (Rockstuhl et al., 2011) including sub-dimensions of planning, awareness, and checking (Van Dyne et al., 2012). Sri Ramalu et al. (2011) found that metacognitive CQ correlated to work adjustment, metacognitive CQ related to contextual performance, and metacognitive CQ related to specific performance.
Individuals who possess cognitive CQ can organize and utilize the information meta-cognitively (Ang et al., 2007). Lin, Chen, et al. (2012) identified metacognitive levels positively correlated with CCA. Huff (2013) also demonstrated positive correlations between metacognitive CQ and work outcomes. The metacognitive domain represents the second area of CQ necessary for increased CCA.
2.2.3 Motivational CQ
Ang et al. (2007) associated motivational CQ with self-interest, confidence, and desire to pursue culturally related interactions. The sub-dimensions of motivational CQ refer to intrinsic, extrinsic, and self-efficacy motives to adjust (Van Dyne et al., 2012). Huff (2013) assessed the relationship between the motivational dimension of CQ and life satisfaction, motivational CQ and general adjustment, motivational CQ and interaction adjustment, motivational CQ and work adjustment, motivational CQ and desire to accept future expatriate assignments. Other researchers confirmed the self-efficacy trait as related to dimensions of motivational CQ (MacNab & Worthley, 2012). Wu and Ang (2011) indicated motivational CQ positively relates to work-related outcomes. The indication is the motivational CQ domain helps to mediate the behavioral CQ domain.
2.2.4 Behavioral CQ
Behavioral CQ refers to the enactment of culturally appropriate behaviors or actions (Ang et al., 2007; Rockstuhl et al., 2011). Behavioral CQ includes sub-dimensions of verbal, non-verbal behavior, and speech acts (Van Dyne et al., 2012). Sri Ramalu et al. (2011) found that behavioral CQ correlated to work adjustment and contextual performance. Huff (2013) found a relationship between behavioral CQ and life satisfaction. Wu and Ang (2011) indicated behavioral CQ positively relates to work-related outcomes. Researchers theorized that increased levels of CCA adjustment further motivate individuals and potentially impact behaviors; thus increasing use of motivational and behavioral CQ competencies (Ang et al., 2007). Behavioral CQ is the last component in the CQ construct and signifies the highest level of cultural intelligence competencies.
Current identification and selection standards are not sufficient to increase the likelihood of expatriate success. Researchers theorized CQ measurements are predictors for expatriate identification, selection, and assignment success (Ward et al., 2011). Wu and Ang (2011) also identified the construct of CQ as an identification and selection tool for greater expatriate success. The CQ scale was selected for use in this study given previous scholarly research.
2.2.5 CQ and work outcomes
Researchers showed relationships between aggregate CQ scores, specific domains of CQ, and work outcome measurements. Cultural shock negatively related to higher levels of CQ while work performance was positively related to higher levels of CQ (Chen et al., 2011). Higher levels of CQ correlated to greater adjustment levels (Malek & Budhwar, 2013) and contextual performance (Sri Ramalu et al., 2011). Wu and Ang (2011) demonstrated the influence of distinct levels of CQ on work adjustment and corresponding organizational support needs; higher cognitive and metacognitive CQ required less organization support versus lower levels of cognitive and metacognitive CQ. Ang et al. (2007) showed a correlation between culturally based decision-making and metacognitive CQ and culturally based decision-making and cognitive CQ. Motivational CQ and behavioral CQ correlated highly with task performance (Wu & Ang, 2011). Leader CQ correlated to leader performance and also to team member performance (Groves & Feyerherm, 2011). While some researchers found correlations between CQ and work outcomes, others criticize discrepancies in the literature.
Some researchers show inconsistent relationships regarding CQ on various work outcome factors. Sri Ramalu et al. (2011) did not show a relationship between motivational CQ and job performance. Ward et al. (2011) found motivational CQ negatively related to psychological and sociocultural adaption. While Wu and Ang (2011) showed cognitive and metacognitive CQ as negatively associated with adjustment and performance. Researchers have attempted to respond to these discrepancies with additional research (Van Dyne et al., 2012). The conflicting nature of existing scholarly literature and research regarding the CQ construct provides justification for additional study of sub-dimensions of CQ factors.
- HYPOTHESES
Previous research regarding cultural intelligence and work outcomes did not investigate specific nuisances in China (Rehg et al., 2012). Additional research examining how these factors relate to work outcomes in China adds validity to the study constructs used by Selmer and Lauring (2013). Further examination of particular relationships in the study data results included the following hypotheses:
H1a-d: There is a significant relationship between (a) cognitive CQ, (b) metacognitive CQ, (c) motivational CQ, (d) behavioral CQ, and work adjustment.
H2a-d: There is a significant relationship between (a) cognitive CQ, (b) metacognitive CQ, (c) motivational CQ, (d) behavioral CQ, and work performance.
H3a-d: There is a significant relationship between (a) cognitive CQ, (b) metacognitive CQ, (c) motivational CQ, (d) behavioral CQ, and work effectiveness.
H4a-d: There is a significant relationship between (a) cognitive CQ, (b) metacognitive CQ, (c) motivational CQ, (d) behavioral CQ, and job satisfaction.
--- INSERT FIGURE 1 HERE ---
- METHOD
4.1 Target population and data collection
Expatriates that presently work in China or repatriated to their company of origin were targeted for participation in the online survey. The targeted study sample received participation invitations through multiple LinkedIn groups for expatriate related topics and international human resource management. The use of a non-probabilistic, snowball sampling method was a feasible form of sampling given the amount of resources available for identifying the sample through expatriate LinkedIn groups (Sadler et al., 2010). A non-probabilistic, snowball sampling approach may introduce some bias in the study based on similar features and profile compositions the sample may share from being part of similar social and professional circles (Sadler et al., 2010). Despite some potential for bias, this sampling approach provided the most opportunity for obtaining the target study sample of expatriates working in China.
Study participants provided self-reported measurements of data through an online survey platform. A total of 355 participants attempted to take the survey while only 268 participants completed the survey. Several study participants sent email commentary regarding the inconsistent nature of Chinese internet access as one of the reasons for not being able to complete the survey. This may help to explain one of the contributing factors regarding why 87 participants were not able to complete the survey questions. Of the 268 study participants, 15 cases had missing data for many questions. Those 15 cases of missing data were excluded from the sample. Therefore, 253 study participants remained in the data set for further analysis.
4.2 Sample
Several demographic questions described the characteristics of the study population. These characteristics included general demographic information, work experience descriptors, Chinese work experience descriptors, and CCT descriptors. A detailed description of each grouping of demographic and descriptor data follows.
Table 1 presents the detailed demographic data for gender, age, marital status, ethnicity, and education level. The majority of the study population were male (80%). The average age of the study participants was 42, with the majority of participants’ age ranging being 21–50 years of age. Over half of participants identified as married (59%) followed by single (28%). A majority of participants self-identified their ethnicity as White, Non-Hispanic (81%). Over 86% of participants identified their education level as a Bachelor’s (32%) or Master’s (54%) degree. Future regression analysis investigating the influence of these demographic variables would be interesting to explore.
--- INSERT TABLE 1 HERE ---
Table 2 presents data related to general work experience descriptors including months of full-time work experience, annual salary, functional work area, and tenure with the organization. The distribution of months of full-time work experience was roughly equal for the ranges of months specified. About (66%) of the participants earned an annual salary ranging between above $50,000 to above $150,000. Over half of participants (58%) worked in functional areas relating to general management, production / operations, or marketing. Almost 3/4 (73%) of participants had a tenure of greater than 12 months, with the average tenure calculated at 57 months. Future regression analysis investigating the influence of these general work experience variables would be interesting to explore.
--- INSERT TABLE 2 HERE ---
Table 3 presents data related to work experiences in China including location of work experience, number of months living in China, other persons embarking on the assignment, number of previous expatriate assignments, assignment selection, and intent to leave current organization. The majority of participants worked in Shanghai, Beijing, or Shenzhen. The majority of participants (76%) were in China for more than 24 months. Over half of the participants embarked on the work experience alone (57%) followed by spouse / significant other (40%). Over 1/3 of participants (35%) did not have previous expatriate work experiences. Almost half (53%) of participants identified work experience selection as self-initiated / personal request. Over 1/3 of participants (39%) anticipate leaving their current organization within the next 2 years. Future regression analy investigating the influence of these Chinese work experience would be interesting to explore.
--- INSERT TABLE 3 HERE ---
Table 4 presents data regarding CCT experiences including pre-departure CCT, number of hours for pre-departure CCT, type of pre-departure CCT, post-arrival CCT, number of hours for post-arrival CCT, type of post-arrival CCT, and Chinese language proficiency. The majority of study participants (79%) did not receive pre-departure or post-arrival (75%) CCT. Of the 21% of participants that did receive pre CCT and post CCT (25%), the following types of pre-departure training methods occurred; training related to job, language training, brief cultural orientation, intensive cultural orientation, and environmental briefing. Over half (59%) of participants identified language proficiency as elementary or limited. Future regression analy investigating the influence of these CCT variables would be interesting to explore in future studies.
--- INSERT TABLE 4 HERE ---
4.3 Instrument
The survey instrument included several background and demographic variables (i.e., gender, age, education, description of industry, and job function. The independent variables comprised the sub-dimensions of cultural intelligence included (a) cognitive CQ, (b) metacognitive CQ, (c) motivational CQ, and (d) behavioral CQ. The dependent variables relating to work outcomes included: (a) work adjustment (Black & Stephens, 1989), (b) work performance (Earley, 1987), (c) work effectiveness (Tsui & Ohlott, 1988), and (d) job satisfaction (West et al., 1987).
4.3.1 Work outcomes
Selmer and Lauring (2013) identified the following factors as related to expatriate work outcomes: work adjustment, work performance, work effectiveness, and job satisfaction. This specific combination of work outcome variables were tested by Selmer and Lauring (2013) with the following Cronbach’s alpha calculations for reliability; α = .75 for work adjustment, α = .75 for work performance, α = .90 for work effectiveness, and α = .78 for job satisfaction. The calculated Cronbach’s alpha for this study’s work outcome variables included work adjustment α = .87, work effectiveness α = .88, work performance α = .82, and job satisfaction α = .87. Work adjustment, work performance, work effectiveness, and job satisfaction had high reliability; the Cronbach’s alpha coefficients were higher than .80 (Field, 2013). These Cronbach’s alpha results add reliability to repeating the use of the work outcomes variables in the future.
4.3.1.1 Work adjustment scale
Black and Stephens' (1989) seminal study used a subset of questions to assess general, interaction, and work adjustment as part of their CCA scale. Three statements from that work adjustment construct was used in this study. Participants provided answers through an ordinal, 7-point Likert-type scale. The scale ranged from 1 (completely unadjusted) to 7 (completely adjusted), with high scores indicating higher levels of perceived adjustment in relation to the statements and lower scores indicating low levels of perceived adjustment.
4.3.1.2 Work performance scale
Earley (1987) introduced the work performance scale in a study measuring the influence of various forms of expatriate training. Four of Earley's (1987) work performance questions were used in this study. Participants provide answers through an ordinal, 7-point Likert scale. The scale ranged from 1 (poor) to 7 (excellent), with high scores indicating excellent levels of perceived work performance in relation to the statements and lower scores indicating poor levels of perceived performance.
4.3.1.3 Work effectiveness scale
Tsui and Ohlott (1988) measured work effectiveness based on the supervising manager’s perceptions of meeting expectations and overall performance. This study adopted the use of Tsui and Ohlott's work effectiveness questions. Work effectiveness was measured using two questions from the Tsui and Ohlott (1988). Participants provided answers through an ordinal, 7-point Likert-type scale. The scale ranged from 1 (not at all) to 7 (entirely), with high scores indicating higher levels of perceived work effectiveness in relation to the statements and lower scores indicating poor levels of perceived work effectiveness.
4.3.1.4 Job satisfaction scale
West et al. (1987) measured job satisfaction in terms of the following topics in their study: (a) work responsibilities, (b) work performance, (c) relationship with management, (d) relationship with colleagues, (e) work life balance, and (f) organizational value of contributions. This study adopted the use of the West et al. (1987) work performance questions. Job satisfaction was measured using seven statements from the West et al. (1987). Participants provided answers through an ordinal, 7-point Likert-type scale. The scale ranged from 1 (poor) to 7 (excellent), with high scores indicating exceptional levels of perceived job satisfaction in relation to the statements and lower scores indicating small levels of perceived job satisfaction.
4.3.2 Cultural Intelligence (CQ)
The Van Dyne et al. (2009) cultural intelligence scale was used for this study. Study participants answered a total of 20 questions that measure sub-dimensions of cultural intelligence including: (a) cognitive CQ, (b) metacognitive CQ, (c) motivational CQ, and (d) behavioral CQ. Participants provided answers through an ordinal, 7-point Likert-type scale. The scale ranged from 1 (strongly disagree) to 7 (strongly agree), with higher scores indicating strong levels of agreement with the statements and lower scores indicating strong levels of disagreement with the statements.
The cognitive CQ domain included six questions that assess learned knowledge about different economic, legal, and social systems of different cultures and subcultures. Metacognitive CQ included four questions relating to an individual’s ability to recognize, control, and understand thinking and thought processing (i.e., planning, monitoring, and revising) as it related to cultural preferences. Motivational CQ included five questions that identify an individual’s motivation in trying to engage, adapt, and assimilate in a culturally different environment, while behavioral CQ comprised five questions regarding the ability to use appropriate words, tone, gestures, and facial expressions and knowledge in interactions with culturally diverse individuals.
Ang et al. (2007) tested the reliability of the individual components of the CQ scale through multiple methods: internal consistency, cross-validation, generalizability across time and cultures. Ang et al. (2007) demonstrated the following results Cronbach’s alpha: metacognitive CQ α = .88; cognitive CQ α = .89; motivational CQ α = .81; and behavioral CQ α = .86. The calculated Cronbach’s alpha for this study’s CQ variables included metacognitive CQ α = .90; cognitive CQ α = .84; motivational CQ α = .89; and behavioral CQ α = .86. All four sub-dimensions of CQ had high reliability; the Cronbach’s alpha coefficients were higher than .80 (Field, 2013). These Cronbach’s alpha results add reliability to repeating the use of the CQ variables in the future.
- RESULTS
Pearson's product-moment correlation was used to assess the relationship between the sub-dimensions of CQ and work outcomes. Standard multiple regression was used to understand how well the independent or predictor variables of cognitive CQ, meta-cognitive CQ, motivational CQ, and behavioral CQ predicted the work outcomes or criterion variables of work adjustment, work effectiveness, work performance, and job satisfaction. A detailed review of each of the work outcome dependent variables and hypotheses testing follows.
Table 5 contains descriptive statistics for the study variables. Violation of the regression assumptions occurred, therefore bootstrap sampling methods were employed. Study variables’ descriptive statistics were reported with 2,000 bootstrap samples at the 95% confidence interval. The highest mean of the work outcome variables was for work adjustment (M = 5.85, SD = 1.16) with a 95% bootstrap confidence interval (CI) mean indicating a range of 5.71 - 6.00. The lowest mean of the work outcome variables was for job satisfaction (M = 5.42, SD = 1.05) with a 95% bootstrap CI mean indicating a range of 5.29 - 5.55. The highest mean of the CQ variables was for motivational CQ (M = 5.91, SD = 1.06) with a 95% bootstrap CI mean indicating a range of 5.78 - 6.04. The lowest mean of the CQ variables was for cognitive CQ (M = 4.85, SD = 1.11) with a 95% bootstrap CI mean indicating a range of 4.71 - 4.98.
--- INSERT TABLE 5 HERE ---
5.1 Hypotheses 1: Work Adjustment
Correlation analysis calculated statistically significant but medium sized, positive correlations between work adjustment and meta-cognitive CQ (r = .35, p < .01), work adjustment and motivational CQ (r = .38, p < .01), and weak or small sized positive correlations between work adjustment and cognitive CQ (r = .25, p < .01), and work adjustment and behavioral CQ (r = .26, p < .01). Regression analysis determined that cognitive CQ, metacognitive CQ, motivational CQ, and behavioral CQ, were able to significantly predict work adjustment F(4, 248) = 12.1, p > .001, R = .41, R2 = .16, adjusted R2 = .15. The effect size (R = .41) indicated a medium effect between the predictor variables of CQ and work adjustment. The F value for the predictor variables was statistically significant. The four sub-dimensions of the CQ variables in the model accounted for 15.0% after adjustment variance in work adjustment.
While there is a small to medium strength correlation between work adjustment and sub-dimensions of CQ, when multiple regression analysis was conducted, the sub-dimensions of the CQ independent variables (metacognitive CQ, cognitive CQ, behavioral CQ) were not able to significantly predict work adjustment. Of the four unstandardized beta coefficient values, only motivational CQ was significantly different from zero. The motivational CQ variable had a statistically significant predictive power for work adjustment while the other CQ variables were not statistically significant in their predictive power. Therefore, there is a significant relationship between motivational CQ and work adjustment.
--- INSERT TABLE 6 HERE ---
--- INSERT TABLE 7 HERE ---
5.2 Hypotheses 2: Work Performance
Correlation analysis calculated statistically significant and small to moderate sized, positive correlations between work performance and meta-cognitive CQ (r = .41, p < .01), work performance and cognitive CQ (r = .31, p < .01), work performance and motivational CQ (r = .47, p < .01), and work performance and behavioral CQ (r = .26, p < .01). Regression analysis determined that the overall model was significant in its ability to predict work performance F (4, 248) = 19.9, p < .001, R = .49, R2 = .24, adjusted R2 = .23. The effect size (R = .49) indicated a large effect between the predictor variables of CQ and work performance. The F value for the predictor variables was statistically significant, indicating there was a proper fit between the regression model and the data. The 4 sub-dimensions of the CQ variables in the model accounted for an adjusted R2of 23% of the variance in work performance.
Of the four unstandardized beta coefficient values, only motivational CQ was significantly different from zero. The motivational CQ variable had a statistically significant predictive power for work performance while the other CQ variables were not statistically significant in their predictive power. Therefore, there is a significant relationship between motivational CQ and work performance.
--- INSERT TABLE 8 HERE ---
5.3 Hypotheses 3: Work Effectiveness
Correlation analysis calculated a statistically significant but weak or small to moderate sized, positive correlation between work effectiveness and meta-cognitive CQ (r = .35, p < .01), work effectiveness and cognitive CQ (r = .30, p < .01), work effectiveness and motivational CQ (r = .36, p < .01), and work effectiveness and behavioral CQ (r = .22, p < .01). Regression analysis determined that the overall model was significant in its ability to predict work effectiveness F (4, 248) = 12.0, p > .001, R = .40, R2 = .16, adjusted R2 = .15. The effect size (R = .40) indicated a medium effect between the predictor variables of CQ and work effectiveness. The F value for the predictor variables was statistically significant, indicating there was not a proper fit between the regression model and the data. The four sub-dimensions of the CQ variables in the model accounted for a 15% variance after adjustment in work effectiveness.
Of the four unstandardized beta coefficient values, only motivational CQ was significantly different from zero. The motivational CQ variable had a statistically significant predictive power for work effectiveness while the other CQ variables were not statistically significant in their predictive power. The Motivational CQ variable makes the strongest, unique contribution to predicting or explaining the work effectiveness outcome. Therefore, there is a significant relationship between motivational CQ and work effectiveness.
--- INSERT TABLE 9 HERE ---
5.4 Hypotheses 4: Job Satisfaction
Correlation analysis calculated statistically significant but weak or small to moderate sized, positive correlations between job satisfaction and meta-cognitive CQ (r = .33, p < .01), job satisfaction and cognitive CQ (r = .27, p < .01), job satisfaction and motivational CQ (r = .38, p < .01), and job satisfaction and behavioral CQ (r = .21, p < .05. The results indicated increases in meta-cognitive CQ, cognitive CQ, and motivational CQ had moderate correlations to increases in job satisfaction while increases in behavioral CQ had small or weak correlations to increases in job satisfaction. Regression analysis determined that the overall model was significant in its ability to predict job satisfaction F (4, 248) = 11.7, p < .001, R = .40, R2 = .16, adjusted R2 = .15. The effect size (R = .40) indicated a medium to large effect between the predictor variables of CQ and job satisfaction. The F value for the predictor variables was statistically significant, indicating there is a proper fit between the regression model and the data. The four sub-dimensions of the CQ variables in the model accounted for a 15% variance after adjustment.
Of the four unstandardized beta coefficient values, only motivational CQ was significantly different from zero. The motivational CQ variable had a statistically significant predictive power for job satisfaction while the other CQ variables were not statistically significant in their predictive power. Therefore, there is a significant relationship between motivational CQ and job satisfaction.
--- INSERT TABLE 10 HERE ---
- DISCUSSION
6.1 Main findings
Researchers demonstrated that higher levels of CQ correlated with higher levels of CCA and work outcomes. This study’s findings provided evidence consistent with prior research on CQ, in its ability to improve work outcomes. Regression analyses determined that the overall models for cognitive CQ, meta-cognitive CQ, motivational CQ, and behavioral CQ had significant predictive power for work adjustment (F(4, 248) = 12.1, p > .001, R = .41, R2 = .16, adjusted R2 = .15), work effectiveness (F(4, 248) = 12.0, p > .001, R = .40, R2 = .16, adjusted R2 = .15), work performance (F(4, 248) = 19.9, p < .001, R = .49, R2 = .24, adjusted R2 = .23) and job satisfaction (F(4, 248) = 11.7, p < .001, R = .40, R2 = .16, adjusted R2 = .15). Specifically, the motivational CQ variable had a statistically significant predictive power for work adjustment, work effectiveness, work performance, and job satisfaction.
Some research shows inconsistent relationships regarding CQ on various work outcome factors. Sri Ramalu et al. (2011) did not show a relationship between motivational CQ and job performance. Ward et al. (2011) found motivational CQ negatively related to psychological and sociocultural adaption. Additional research that further examines the influence of motivational CQ on other expatriate work outcome variables would be interesting to consider given the conflicting nature of existing scholarly literature and this study’s results.
6.2 Limitations
A significant limitation of the study was the self-report nature of the survey. The study participants could answer questions in an aspirational rather than a factual manner. Common method variance could occur because of self-reporting of the study variables. The participants might provide more positive and proactive types of responses than what occurred in their lived experience. Previous expatriate assignments occurring outside of China may have influenced self-reporting of experiences in China. To mitigate such limitation, obtaining work outcome measures from expatriates’ supervisors and peers would be an optimal study design approach in future research.
Another limitation of the study is that survey participants received notification of availability of the survey through expatriate related LinkedIn groups. Using snowball-sampling techniques, survey participants forwarded the survey link to other expatriates. This sampling method is not random and therefore could introduce some bias to the study results.
The study data were not inclusive of all factors associated with expatriate assignments and repatriation experiences. Omitted factors related to specific personality attributes could influence the study model. Individual expatriate differences relating to current assignment duration and the total number of years of expatriate experiences can affect the generalization of research results (Kraimer et al., 2012).
The study data were cross-sectional in nature; therefore, the results of the study cannot establish causality (Rovai et al., 2013). A longitudinal study design might be appropriate in future research to reduce participant bias from recent experiences that occur during the time of survey completion. Common method bias could occur because of the survey data collection and sampling method (Podsakoff, MacKenzie, & Podsakoff, 2012).
Perceived cultural distance between expatriates and Chinese host country nationals (HCNs) could influence the study results (Froese & Peltokorpi, 2011). Specific local behaviors and customs in China could affect survey answers for a particular region. Larger sample sizes from different regions could help to mediate local cultural differences and expatriate experiences in China (Littrell, Alon, & Chan, 2012).
6.3 Implications
Approaches to relationship building differ widely for the Chinese versus western cultures (Ndubisi, 2011). Chen et al. (2011) perceived the Chinese culture as collectivistic, group-oriented, and exhibiting conflict avoidance behaviors compared to their western counterparts. Additionally, the business culture in China depends on the establishment of guanxi and gives much importance to mianzi (Lin, 2011; Varma, Budhwar, & Pichler, 2011). Lu (2012) noted that a lack of guanxi could prevent the establishment of positive business relationships and negotiations. Perceived differences in two countries’ cultures can negatively influence (a) levels of anxiety and stress among expatriates; (b) motivation and ability to adjust; (c) performance levels; (d) turnover intent; and (e) job satisfaction (Froese & Peltokorpi, 2011; Grinstein & Wathieu, 2012; Lee & Kartika, 2014; Pinto et al., 2012; Wu & Ang, 2011). Researchers hypothesized that expatriates who understand these types of cultural differences and act accordingly, may experience more favorable work outcomes (Kriz, Gummesson, & Quazi, 2014; Pan et al., 2012; Varma et al., 2011). Ward et al. (2011) and Wu and Ang (2011) theorized CQ measurements are predictors for expatriate identification, selection, and assignment success.
The results of this study may provide additional support for these theories regarding a connection between CQ and positive work outcomes. Specifically, the motivational CQ variable had a significant predictive power in explaining the variances in work adjustment, work performance, work effectiveness, and job satisfaction. This finding corresponds with other research results that found expatriates who had high levels of personal initiative or motivation demonstrated higher performance outcomes and satisfaction (Stroppa & Spieß, 2011). Selmer and Lauring (2013) showed positive correlations between positive affectivity, work adjustment, work performance, work effectiveness, and job satisfaction. MacNab and Worthley (2012) proposed that traits relating to self-efficacy, intrinsic motivation, and cross-cultural motivation (motivational CQ) lead to higher levels of assignment adjustment and performance.
The research results indicated that CQ, and more specifically, motivational CQ, had a significant and positive predictive ability to influence work outcomes. Researchers suggested the use of cultural intelligence scores to assess candidate identification and selection criteria, to determine additional requirements for cross-cultural training, organizational support, mentoring, and repatriation support; improvement of cross-cultural adjustment and work outcomes were the intention (Fischer, 2011; Huff, 2013; Mahajan & De Silva, 2012). The results of this study supported this recommendation for an application to professional expatriate management practices.
- CONCLUSION
Organizations should attempt to use the CQ assessment scale, among other expatriate identification and selection criteria, to measure a prospective expatriate candidate’s current ability to adapt to the cultural differences inherent in a global assignment. If a candidate scores lower on CQ sub-dimensions, especially the motivational CQ dimension, further training and the creation of additional support systems may benefit the candidate prior to departure and after arrival in the host location. This recommendation follows from the study’s regression analyses and other scholarly research (Fischer, 2011; Huff, 2013; Mahajan & De Silva, 2012). Organizations able to identify appropriate staffing and training needs for expatriates may potentially reduce costs associated with failed assignments and employee turnover (McNulty et al., 2013; Minter, 2011; Peng & Beamish, 2014; Tharenou, 2013). International business school programs may benefit from research identifying areas to strengthen the existing education of aspiring expatriates (Kim & Egan, 2011).
References
Abdul Malek, M., & Budhwar, P. (2013). Cultural intelligence as a predictor of expatriate adjustment and performance in Malaysia. Journal of World Business, 48, 222–231. doi:10.1016/j.jwb.2012.07.006
Adams, J. W., Srivastava, A., Herriot, P., & Patterson, F. (2013). Careerist orientation and organizational citizenship behavior in expatriates and non-expatriates. Journal of Career Development, 40, 469–489. doi:10.1177/0894845312472255
Ang, S., Van Dyne, L., Koh, C., Ng, K. Y., Templer, K. J., Tay, C., & Chandrasekar, N. A. (2007). Cultural intelligence: Its measurement and effects on cultural judgment and decision-making, cultural adaptation and task performance. Management and Organization Review, 3, 335–371. doi:10.1111/j.1740-8784.2007.00082.x
Black, J. S., & Mendenhall, M. (1989). A practical but theory-based framework for selecting cross-cultural training methods. Human Resource Management, 28, 511–539. doi:10.1002/hrm.3930280406
Black, J. S., & Stephens, G. K. (1989). The influence of the spouse on American expatriate adjustment and intent to stay in Pacific Rim overseas assignments. Journal of Management, 15, 529–544. doi:10.1177/014920638901500403
Brookfield, G. M. A. C. (2012). Global relocation trends 2012. Morristown, NJ: Brookfield Global Relocation Services. Retrieved from http://espritgloballearning. com/wp-content/uploads/2011/03/2012-Brookfield-Global-Relocations-Trends-Survey.pdf
Chen, A. S., Lin, Y., & Sawangpattanakul, A. (2011). The relationship between cultural intelligence and performance with the mediating effect of culture shock: A case from Philippine laborers in Taiwan. International Journal of Intercultural Relations, 35, 246–258. doi:10.1016/j.ijintrel.2010.09.005
Chen, X. P., Liu, D., & Portnoy, R. (2012). A multilevel investigation of motivational cultural intelligence, organizational diversity climate, and cultural sales: Evidence from US real estate firms. Journal of Applied Psychology, 97, 93. doi:10.1037/a0024697
Collins, R. A., & Kriz, A. (2013). Cultural intelligence (CQ) and its role in advancing open innovation alliances (OIA) between China and the West. Journal of Chinese Entrepreneurship, 5, 220–239. doi:10.1108/JCE-03-2013-0008
Earley, P. C. (1987). Intercultural training for managers: A comparison of documentary and interpersonal methods. Academy of Management Journal, 30, 685–698. doi:10.2307/256155
Field, A. (2013). Discovering Statistics Using IBM SPSS Statistics (4th ed.). London, England: SAGE Publications.
Fischer, R. (2011). Cross-cultural training effects on cultural essentialism beliefs and cultural intelligence. International Journal of Intercultural Relations, 35, 767–775. doi:10.1016/j.ijintrel.2011.08.005
Froese, F. J., & Peltokorpi, V. (2011). Cultural distance and expatriate job satisfaction. International Journal of Intercultural Relations, 35, 49–60. doi:10.1016/j.ijintrel.2010.10.002
Froese, F. J., Peltokorpi, V., & Ko, K. A. (2012). The influence of intercultural communication on cross-cultural adjustment and work attitudes: Foreign workers in South Korea. International Journal of Intercultural Relations, 36, 331–342. doi:10.1016/j.ijintrel.2011.09.005
Grinstein, A., & Wathieu, L. (2012). Happily (mal)adjusted: Cosmopolitan identity and expatriate adjustment. International Journal of Research in Marketing, 29, 337–345. doi:10.1016/j.ijresmar.2012.03.003
Groves, K. S., & Feyerherm, A. E. (2011). Leader cultural intelligence in context: Testing the moderating effects of team cultural diversity on leader and team performance. Group & Organization Management, 36, 535–566. doi:10.1177/1059601111415664
Gunkel, M., Schlägel, C., & Engle, R. L. (2014). Culture’s influence on emotional intelligence: An empirical study of nine countries. Journal of International Management, 20, 256–274. doi:10.1016/j.intman.2013.10.002
Huff, K. C. (2013). Language, cultural intelligence and expatriate success. Management Research Review, 36, 596–612. doi:10.1108/01409171311325750
Kim, S., & Egan, T. (2011). Establishing a formal cross-cultural mentoring organization and program: A case study of International Student Mentor Association in a higher education context. Journal of European Industrial Training, 35, 89–105. doi:10.1108/03090591111095754
Kraimer, M. L., Shaffer, M. A., Harrison, D. A., & Ren, H. (2012). No place like home? An identity strain perspective on repatriate turnover. Academy of Management Journal, 55, 399–420. doi:10.5465/amj.2009.0644
Kriz, A., Gummesson, E., & Quazi, A. (2014). Methodology meets culture: Relational and guanxi-oriented research in China. International Journal of Cross Cultural Management, 14, 27–46. doi:10.1177/1470595813493265
Lee, L., & Donohue, R. (2012). The construction and initial validation of a measure of expatriate job performance. The International Journal of Human Resource Management, 23, 1197–1215. doi:10.1080/09585192.2011.638654
Lee, L. Y., & Kartika, N. (2014). The influence of individual, family, and social capital factors on expatriate adjustment and performance: The moderating effect of psychology contract and organizational support. Expert Systems with Applications, 41, 5483–5494. doi:10.1016/j.eswa.2014.02.030
Lee, L. Y., & Sukoco, B. M. (2010). The effects of cultural intelligence on expatriate performance: The moderating effects of international experience. The International Journal of Human Resource Management, 21, 963–981. doi:10.1080/09585191003783397
Lin, C. Y. Y., Lu, T. C., & Lin, H. W. (2012a). A different perspective of expatriate management. Human Resource Management Review, 22, 189–207. doi:10.1016/j.hrmr.2012.02.003
Lin, L. H. (2011). Cultural and organizational antecedents of guanxi: The Chinese cases. Journal of Business Ethics, 99, 441–451. doi:10.1007/s10551-010-0662-3
Lin, Y., Chen, A. S., & Song, Y. (2012b). Does your intelligence help to survive in a foreign jungle? The effects of cultural intelligence and emotional intelligence on cross-cultural adjustment. International Journal of Intercultural Relations, 36, 541–552. doi:10.1016/j.ijintrel.2012.03.001
Littrell, R. F., Alon, I., & Chan, K. W. (2012). Regional differences in managerial leader behaviour preferences in China. Cross Cultural Management: An International Journal, 19, 315–335. doi:10.1108/13527601211247071
Lovvorn, A., & Chen, J. (2011). Developing a global mindset: The relationship between an international assignment and cultural intelligence. International Journal of Business and Social Science, 2(9), 275–283. Retrieved from http://www.ijbssnet.com/
Lu, L. (2012). Guanxi and Renqing: The roles of two cultural norms in Chinese business. International Journal of Management, 29, 466–475. Retrieved from http://www.journals.elsevier.com/the-international-journal-of-management-education/
MacNab, B. R., & Worthley, R. (2012). Individual characteristics as predictors of cultural intelligence development: The relevance of self-efficacy. International Journal of Intercultural Relations, 36, 62–71. doi:10.1016/j.ijintrel.2010.12.001
Mahajan, A., & De Silva, S. R. (2012). Unmet role expectations of expatriates, host-country national support, and expatriate adjustment. International Journal of Cross Cultural Management, 12, 349–360. doi:10.1177/1470595812440153
McEvoy, G. (2011). Reducing the cost of expatriation in austere times: A case study of two organizations. Journal of International Management Studies, 6, 1–10. Retrieved from http://www.jimsjournal.org/
McNulty, Y., De Cieri, H., & Hutchings, K. (2013). Expatriate return on investment in the Asia Pacific: An empirical study of individual ROI versus corporate ROI. Journal of World Business, 48, 209–221. doi:10.1016/j.jwb.2012.07.005
Min, H., Magnini, V. P., & Singal, M. (2013). Perceived corporate training investment as a driver of expatriate adjustment. International Journal of Contemporary Hospitality Management, 25, 740–759. doi:10.1108/IJCHM-May-2012-0079
Minter, R. (2011). Preparation of expatriates for global assignments: Revisited. Journal of Diversity Management (JDM), 3, 37–42. Retrieved from http://www.cluteonline.com/journals/index.php/JDM/
Ndubisi, N. O. (2011). Conflict handling, trust and commitment in outsourcing relationship: A Chinese and Indian study. Industrial Marketing Management, 40, 109–117. doi:10.1016/j.indmarman.2010.09.015
Okpara, J. O., & Kabongo, J. D. (2011). Cross-cultural training and expatriate adjustment: A study of western expatriates in Nigeria. Journal of World Business, 46, 22–30. doi:10.1016/j.jwb.2010.05.014
Organisation for Economic Co-operation and Development. (2013, April). FDI in figures. Paris, France. Retrieved from http://www.oecd.org/daf/inv/FDI%20in%20figures.pdf
Pan, Y., Rowney, J. A., & Peterson, M. F. (2012). The structure of Chinese cultural traditions: An empirical study of business employees in China: Structure of Chinese cultural traditions. Management and Organization Review, 8, 77–95. doi:10.1111/j.1740-8784.2011.00274.x
Peltokorpi, V., & Froese, F. (2014). Expatriate personality and cultural fit: The moderating role of host country context on job satisfaction. International Business Review, 23, 293–302. doi:10.1016/j.ibusrev.2013.05.004
Peltokorpi, V., & Froese, F. J. (2012). The impact of expatriate personality traits on cross-cultural adjustment: A study with expatriates in Japan. International Business Review, 21, 734–746. doi:10.1016/j.ibusrev.2011.08.006
Peng, G. Z. (2012a). FDI legitimacy and MNC subsidiary control: From legitimation to competition. Journal of International Management, 18, 115–131. doi:10.1016/j.intman.2011.12.001
Peng, G. Z., & Beamish, P. W. (2014). MNC subsidiary size and expatriate control: Resource-dependence and learning perspectives. Journal of World Business, 49, 51–62. doi:10.1016/j.jwb.2012.11.001
Pinto, L. H., Cabral-Cardoso, C., & Werther, W. B. (2012). Adjustment elusiveness: An empirical investigation of the effects of cross-cultural adjustment on general assignment satisfaction and withdrawal intentions. International Journal of Intercultural Relations, 36, 188–199. doi:10.1016/j.ijintrel.2011.06.002
Podsakoff, P. M., MacKenzie, S. B., & Podsakoff, N. P. (2012). Sources of method bias in social science research and recommendations on how to control it. Annual Review of Psychology, 63, 539-569. doi:10.1146/annurev-psych-120710-100452
Rehg, M. T., Gundlach, M. J., & Grigorian, R. A. (2012). Examining the influence of cross-cultural training on cultural intelligence and specific self-efficacy. Cross Cultural Management: An International Journal, 19, 215–232. doi:10.1108/13527601211219892
Rockstuhl, T., Seiler, S., Ang, S., Van Dyne, L., & Annen, H. (2011). Beyond general intelligence (IQ) and emotional intelligence (EQ): The role of cultural intelligence (CQ) on cross-border leadership effectiveness in a globalized world. Journal of Social Issues, 67, 825–840. doi:10.1111/j.1540-4560.2011.01730.x
Rovai, A. P., Baker, J. D., & Ponton, M. K. (2013). Social science research design and statistics: A practitioner’s guide to research methods and IBM SPSS analysis. [Kindle edition]. Chesapeake, VA: Watertree Press LLC.
Sadler, G. R., Lee, H. C., Lim, R. S. H., & Fullerton, J. (2010). Recruitment of hard-to-reach population subgroups via adaptations of the snowball sampling strategy: Hard-to-reach populations. Nursing & Health Sciences, 12, 369–374. doi:10.1111/j.1442-2018.2010.00541.x
Selmer, J., & Lauring, J. (2013). Dispositional affectivity and work outcomes of expatriates. International Business Review, 22, 568–577. doi:10.1016/j.ibusrev.2012.08.003
Sri Ramalu, S., Wei, C., & Rose, R. (2011). The effects of cultural intelligence on cross-cultural adjustment and job performance amongst expatriates in Malaysia. International Journal of Business and Social Science, 2, 59–71. Retrieved from http://www.ijbssnet.com/
Stroppa, C., & Spieß, E. (2011). International assignments: The role of social support and personal initiative. International Journal of Intercultural Relations, 35, 234–245. doi:10.1016/j.ijintrel.2010.09.008
Tait, E., De Cieri, H., & McNulty, Y. (2014). The opportunity cost of saving money: An exploratory study of permanent transfers and localization of expatriates in Singapore. International Studies of Management and Organization, 44, 80-95. doi:10.2753/IMO0020-8825440305
Tharenou, P. (2013). Self-initiated expatriates: An alternative to company-assigned expatriates? Journal of Global Mobility: The Home of Expatriate Management Research, 1, 336–356. doi:10.1108/JGM-02-2013-0008
Tsui, A. S., & Ohlott, P. (1988). Multiple assessment of managerial effectiveness: Interrater agreement and consensus in effectiveness models. Personnel Psychology, 41, 779–803. doi:10.1111/j.1744-6570.1988.tb00654.x
Tungli, Z., & Peiperl, M. (2009). Expatriate practices in German, Japanese, U.K., and U.S. multinational companies: A comparative survey of changes. Human Resource Management, 48, 153–171. doi:10.1002/hrm.20271
Van Dyne, L., Ang, S., & Koh, C. K. S. (2009). Cultural intelligence: Measurement and scale development. Contemporary leadership and intercultural competence: Exploring the cross-cultural dynamics within organizations, (pp. 233–254). Thousand Oaks, CA: Sage Publications.
Van Dyne, L., Ang, S., Ng, K. Y., Rockstuhl, T., Tan, M. L., & Koh, C. (2012). Sub-dimensions of the four factor model of cultural intelligence: Expanding the conceptualization and measurement of cultural intelligence: CQ: Sub-dimensions of cultural intelligence. Social and Personality Psychology Compass, 6, 295–313. doi:10.1111/j.1751-9004.2012.00429.x
Varma, A., Budhwar, P., & Pichler, S. (2011). Chinese host country nationals’ willingness to help expatriates: The role of social categorization. Thunderbird International Business Review, 53, 353–364. doi:10.1002/tie.20413
Varma, A., Pichler, S., Budhwar, P., & Kupferer, S. (2012). Expatriate-local interactions: An investigation in China. Journal of Managerial Psychology, 27, 753–768. doi:10.1108/02683941211259557
Ward, C., Wilson, J., & Fischer, R. (2011). Assessing the predictive validity of cultural intelligence over time. Personality and Individual Differences, 51, 138–142. doi:10.1016/j.paid.2011.03.032
West, M. A., Nicholson, N., & Rees, A. (1987). Transitions into newly created jobs. Journal of Occupational Psychology, 60, 97–113. doi:10.1111/j.2044-8325.1987.tb00244.x
Woods, P. R., Barker, M. C., & Troth, A. C. (2012). Cross-cultural management performance elements in the expatriate context. International Journal of Business Research, 12(3), 95–108. Retrieved from http://www.iabe.org/domains/iabe/
journal.aspx?journalid=12
Wu, P. C., & Ang, S. H. (2011). The impact of expatriate supporting practices and cultural intelligence on cross-cultural adjustment and performance of expatriates in Singapore. The International Journal of Human Resource Management, 22, 2683–2702. doi:10.1080/09585192.2011.599956
Zhang, Y. (2013). Expatriate development for cross-cultural adjustment: Effects of cultural distance and cultural intelligence. Human Resource Development Review, 12, 177–199. doi:10.1177/1534484312461637
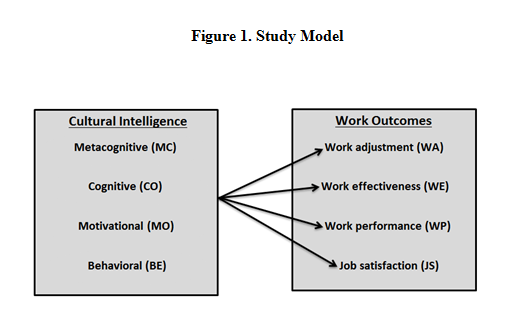
Table 1. Frequency and Percentages of General Demographic Data (N=253)
|
Demographic
|
Detail
|
Frequency
|
Percent
|
|
Gender
|
Female
|
50
|
19.8
|
|
|
Male
|
203
|
80.2
|
|
Age
|
21-30
|
54
|
21.3
|
|
|
31-40
|
76
|
30.0
|
|
|
41-50
|
66
|
26.1
|
|
|
51-60
|
42
|
16.6
|
|
|
61-70
|
12
|
4.7
|
|
|
71-80
|
3
|
1.2
|
|
Marital Status
|
Single
|
71
|
28.1
|
|
|
Married
|
148
|
58.5
|
|
|
Divorced
|
19
|
7.5
|
|
|
Other
|
15
|
5.9
|
|
Ethnicity
|
White, Non-Hispanic
|
205
|
81.0
|
|
|
Black, African American
|
5
|
2.0
|
|
|
Asian/Pacific Islander
|
17
|
6.7
|
|
|
Spanish/Hispanic/Latino/Latina
|
11
|
4.3
|
|
|
Other
|
15
|
5.9
|
|
Education
|
Bachelor's degree (BA, BS)
|
81
|
32.0
|
|
|
Master's degree (MBA, MA, MS)
|
136
|
53.8
|
|
|
Doctoral degree (PhD, EdD)
|
12
|
4.7
|
|
|
Law degree (JD)
|
5
|
2.0
|
|
|
None
|
10
|
4.0
|
|
|
Other
|
9
|
3.6
|
Table 2. Frequency and Percentages of General Work Experience Descriptors (N=253)
|
Descriptor
|
Detail
|
Frequency
|
Percent
|
|
Months F/T Experience
|
0-50
|
43
|
17.0
|
|
51-100
|
35
|
13.8
|
|
101-200
|
68
|
28.1
|
|
201-350
|
60
|
23.7
|
|
351-600
|
47
|
18.6
|
|
Annual Salary
|
Below $30,000
|
32
|
12.6
|
|
|
$30,000 to $49,000
|
32
|
12.6
|
|
|
$50,000 to $69,000
|
31
|
12.3
|
|
|
$70,000 to $149,000
|
68
|
26.9
|
|
|
$150,000 and above
|
67
|
26.5
|
|
|
I prefer not to answer
|
23
|
9.1
|
|
Functional Work Area
|
General management
|
95
|
37.5
|
|
Production/operations
|
27
|
10.7
|
|
Marketing
|
25
|
9.9
|
|
Finance/accounting
|
11
|
4.3
|
|
Information Technology
|
16
|
6.3
|
|
Other
|
79
|
31.2
|
|
Months Tenure with Organization
|
0
|
15
|
6.7
|
|
1 – 6
|
17
|
7.6
|
|
7 – 12
|
28
|
12.4
|
|
13 – 24
|
37
|
16.4
|
|
25 – 36
|
30
|
13.3
|
|
37 – 60
|
30
|
13.3
|
|
61 – 192
|
57
|
25.3
|
|
193 – 440
|
11
|
4.9
|
Table 3. Frequency and Percentages of Work Experience Descriptors in China (N=253)
|
Descriptor
|
Detail
|
Frequency
|
Percent
|
|
City Location
In China
|
Shanghai
|
101
|
39.9
|
|
Beijing
|
58
|
22.9
|
|
Shenzhen
|
21
|
8.3
|
|
Guangzhou
|
13
|
5.1
|
|
Various other cities
|
79
|
31.2
|
|
Number of Months in China
|
0 – 12
|
37
|
14.6
|
|
13 – 24
|
25
|
9.9
|
|
25 – 48
|
70
|
27.7
|
|
49 – 96
|
62
|
24.5
|
|
97 – 180
|
59
|
23.3
|
|
Persons Accompanying Expatriate
|
No one
|
145
|
57.3
|
|
Spouse/Significant other
|
101
|
39.9
|
|
Child(ren)
|
45
|
17.8
|
|
Other
|
8
|
3.2
|
|
Number of Previous Expatriate Work Experiences
|
0
|
88
|
34.8
|
|
1
|
71
|
28.1
|
|
2
|
30
|
11.9
|
|
3
|
32
|
12.6
|
|
4 +
|
32
|
12.6
|
|
Assignment Selection
|
Company appointed/offered
|
91
|
36.0
|
|
Self-initiated/personal request
|
133
|
52.6
|
|
Other
|
29
|
11.5
|
|
Intention to Leave Organization within 2 years
|
Bottom 2 box (disagree)
|
92
|
36.4
|
|
Middle 3 box
|
63
|
24.9
|
|
Top 2 box (agree)
|
98
|
38.7
|
Table 4. Frequency and Percentages of CCT (N=253)
|
Descriptor
|
|
Frequency
|
Percent
|
|
Pre-departure CCT
|
Yes
|
54
|
21.3
|
|
No
|
199
|
78.7
|
|
Number of Hours Pre-Departure CCT
|
1 – 20
|
24
|
9.5
|
|
21 – 100
|
11
|
4.3
|
|
101 +
|
20
|
7.9
|
|
Type of Pre-Departure CCT
|
Training related to your job
|
18
|
7.1
|
|
Language training
|
29
|
11.5
|
|
Brief cultural orientation
|
26
|
10.3
|
|
Intensive cultural orientation
|
18
|
7.1
|
|
Environmental briefing
|
26
|
10.3
|
|
Other
|
17
|
6.7
|
|
Post-Arrival CCT
|
Yes
|
63
|
24.9
|
|
No
|
190
|
75.1
|
|
Number of Hours Post-Arrival CCT
|
1 – 20
|
29
|
11.5
|
|
21 – 100
|
15
|
5.9
|
|
101 + +
|
19
|
7.5
|
|
Type of Pre-Post-Arrival CCT
|
Training related to your job
|
24
|
9.5
|
|
Language training
|
39
|
15.4
|
|
Brief cultural orientation
|
32
|
12.6
|
|
Intensive cultural orientation
|
13
|
5.1
|
|
Environmental briefing
|
20
|
7.9
|
|
Other
|
8
|
0.03
|
|
Chinese Language Proficiency
|
No proficiency
|
35
|
13.8
|
|
Elementary proficiency
|
89
|
35.2
|
|
Limited working proficiency
|
60
|
23.7
|
|
Professional working proficiency
|
40
|
15.8
|
|
Full professional proficiency
|
27
|
10.7
|
|
Native or bilingual proficiency
|
2
|
0.8
|
Table 5. Means (M) and Standard Deviations (SD) for the Study Variables (N=253)
|
Variable
|
M
|
SD
|
Bootstrap 95% CI (M)
|
|
Total Work Outcomes
|
5.61
|
0.84
|
[5.51, 5.71]
|
|
Work Adjustment
|
5.85
|
1.16
|
[5.71, 6.00]
|
|
Work Performance
|
5.55
|
0.61
|
[5.47, 5.62]
|
|
Work Effectiveness
|
5.64
|
1.25
|
[5.49, 5.78]
|
|
Job Satisfaction
|
5.42
|
1.05
|
[5.29, 5.55]
|
|
Total CQ
|
5.41
|
0.91
|
[5.29, 5.52]
|
|
Cognitive CQ
|
4.85
|
1.11
|
[4.71, 4.98]
|
|
Metacognitive CQ
|
5.70
|
1.12
|
[5.56, 5.84]
|
|
Motivational CQ
|
5.91
|
1.06
|
[5.78, 6.04]
|
|
Behavioral CQ
|
5.35
|
1.27
|
[5.20, 5.50]
|
Note: Bootstrap results calculated based on 2,000 bootstrap samples
Table 6. Correlations for Study Variables (N=253)
|
Variable
|
WA
|
WE
|
WP
|
JS
|
MC
|
CO
|
MO
|
BE
|
|
Work Adjustment (WA)
|
1.00
|
.54**
|
.40**
|
.53**
|
.35**
|
.25**
|
.38**
|
.26**
|
|
Work Effectiveness (WE)
|
.54**
|
1.00
|
.62**
|
.63**
|
.35**
|
.30**
|
.36**
|
.22**
|
|
Work Performance (WP)
|
.40**
|
.62**
|
1.00
|
.57**
|
.41**
|
.31**
|
.47**
|
.26**
|
|
Job Satisfaction (JS)
|
.53**
|
.63**
|
.57**
|
1.00
|
.33**
|
.27**
|
.38**
|
.21**
|
|
Metacognitive CQ (MC)
|
.35**
|
.35**
|
.41**
|
.33**
|
1.00
|
.52
|
.67
|
.55
|
|
Cognitive CQ (CO)
|
.25**
|
.30**
|
.31**
|
.27**
|
0.52
|
1.00
|
.49
|
.38
|
|
Motivational CQ (MO)
|
.38**
|
.36**
|
.47**
|
.38**
|
0.67
|
.49
|
1.00
|
.53
|
|
Behavioral CQ (BE)
|
.26**
|
.22**
|
.26**
|
.21**
|
0.55
|
.38
|
.53
|
1.00
|
**. Correlation is significant at the 0.01 level (2-tailed).
*. Correlation is significant at the 0.05 level (2-tailed).
Table 7. Regression Analysis for Work Adjustment
|
Variables
|
Β
|
SE Β
|
β
|
t
|
p
|
B 95%
Bootstrap CI
|
|
Metacognitive CQ
|
.14
|
.09
|
.14
|
1.57
|
.12
|
[-.03, .32]
|
|
Cognitive CQ
|
.05
|
.07
|
.04
|
.64
|
.53
|
[ -.09, .18]
|
|
Motivational CQ
|
.27
|
.09
|
.25
|
2.98
|
.00***
|
[.06, .47]
|
|
Behavioral CQ
|
.04
|
.07
|
.04
|
.58
|
.57
|
[-.08, .17]
|
|
R
|
.41
|
|
|
|
|
|
|
R2
|
.16
|
|
|
|
|
|
|
Adjusted R2
|
.15
|
|
|
|
|
|
|
F
|
12.1***
|
|
|
|
|
|
Note: Bootstrap results calculated based on 2,000 bootstrap samples
* p < .05 (two-tailed).
** p < .01 (two-tailed).
*** p < .001 (two-tailed).
Table 8. Regression Analysis for Work Performance
|
Variables
|
Β
|
SE Β
|
β
|
t
|
p
|
B 95%
Bootstrap CI
|
|
Metacognitive CQ
|
.08
|
.04
|
.14
|
1.78
|
.08
|
[-.01, .17]
|
|
Cognitive CQ
|
.04
|
.04
|
.07
|
1.06
|
.29
|
[-.03, .11]
|
|
Motivational CQ
|
.21
|
.05
|
.36
|
4.59
|
.00***
|
[.11, .31]
|
|
Behavioral CQ
|
-.02
|
.03
|
-.04
|
-.53
|
.59
|
[-.08, .05]
|
|
R
|
.49
|
|
|
|
|
|
|
R2
|
.24
|
|
|
|
|
|
|
Adjusted R2
|
.23
|
|
|
|
|
|
|
F
|
19.9***
|
|
|
|
|
|
Note: Bootstrap results calculated based on 2,000 bootstrap samples
* p < .05 (two-tailed).
** p < .01 (two-tailed).
*** p < .001 (two-tailed).
Table 9. Regression Analysis for Work Effectiveness
|
Variables
|
Β
|
SE Β
|
β
|
t
|
p
|
B 95%
Bootstrap CI
|
|
Metacognitive CQ
|
.17
|
.10
|
.15
|
1.79
|
.07
|
[-.04, .38]
|
|
Cognitive CQ
|
.15
|
.08
|
.13
|
1.84
|
.07
|
[-.01, .32]
|
|
Motivational CQ
|
.24
|
.10
|
.21
|
2.48
|
.01**
|
[.03, .46]
|
|
Behavioral CQ
|
-.02
|
.07
|
-.02
|
-.29
|
.77
|
[-.18, .16]
|
|
R
|
.40
|
|
|
|
|
|
|
R2
|
.16
|
|
|
|
|
|
|
Adjusted R2
|
.15
|
|
|
|
|
|
|
F
|
12.0***
|
|
|
|
|
|
Note: Bootstrap results calculated based on 2,000 bootstrap samples
* p < .05 (two-tailed).
** p < .01 (two-tailed).
*** p < .001 (two-tailed).
Table 10. Regression Analysis for Job Satisfaction
|
Variables
|
Β
|
SE Β
|
β
|
t
|
p
|
B 95%
Bootstrap CI
|
|
Metacognitive CQ
|
.11
|
.08
|
.12
|
1.34
|
.18
|
[-.05, .26]
|
|
Cognitive CQ
|
.09
|
.07
|
.09
|
1.32
|
.19
|
[-.07, .24]
|
|
Motivational CQ
|
.27
|
.08
|
.27
|
3.28
|
.00***
|
[.08, .47]
|
|
Behavioral CQ
|
-.03
|
.06
|
-.03
|
-.47
|
.64
|
[-.15, .10]
|
|
R
|
.40
|
|
|
|
|
|
|
R2
|
.16
|
|
|
|
|
|
|
Adjusted R2
|
.15
|
|
|
|
|
|
|
F
|
11.7***
|
|
|
|
|
|
Note: Bootstrap results calculated based on 2,000 bootstrap samples
* p < .05 (two-tailed).
** p < .01 (two-tailed).
*** p < .001 (two-tailed).

