A Refereed Monthly International Journal of Management
Regulatory Transformation and its Impact on LIC of India: A Brief Sketch
Author
|
Research Scholar (SRF)
Faculty of Commerce,
Banaras Hindu University, Varanasi, 221005
Contact Number: 09889461976
E-mail Address: pooja.bhu091@gmail.com
Address for Communication:
Pooja, D/o. Shri Dashrath Prasad,
B-22/261 G, Kirahiya, Khojwa, Varanasi,
Uttar Pradesh, Pin Code: 221010
|
Pooja
S. N. Jha
Professor,
Room No. 202, Faculty of Commerce,
Banaras Hindu University, Varanasi, 221005
Email Id: snjhabhu@gmail.com
Contact No.: 09415300418
|
Abstract
Life insurance business in India was nationalised in the year 1956, and LIC of India came into existence since September 1, 1956. After viewing competition in the market due to introduction of LPG policy in 1991, a need was felt to liberalise the insurance market in India. As a result, in the year 2000, Insurance Regulatory and Development Authority (IRDA) was setup as a regulatory body to regulate control and supervise the insurance business in India. After such regulatory transformation, private life and non-life insurers were allowed to enter in the Indian market. Remarkable changes has been seen in life insurance market onwards 2000, because private and foreign players entered in the market with new technologies, huge funds, and thus gave a cut throat competition to LIC of India. Consequently, through this paper an attempt has been made to analyse the impact of regulatory transformation on LIC of India, and to compare the performance of Corporation over all private life insurers in post reforms era.
Keywords: Benefits Paid, Commission, Investment Income, Market Shares, Operating Ratio, Policies Issues, Premium Underwritten
Introduction
Today, the entire world economy has become a global community. The liberalisation, privatisation and globalisation (LPG) wave has swiped across the global market. The LPG Policy 1991 was a sign of departure from the regulated economic tradition to liberalised market economy. Near about after a decade, reforms have been enacted in India for ending the public sector monopoly in insurance and open the industry to private participants subject to suitable prudential regulation. The reforms have two objectives, viz., to capture a wide untapped population under suitable insurance cover, and to create a more efficient and competitive insurance sector.[i] It has become imperative for LIC of India to face the competition posed by the entry of new private players because for almost four decades LIC has been sole player with virtual monopoly in the life insurance sector. Today because of the combined efforts of both the regulator and industry players, benefits of insurance are broadly recognised, public assurance has been restored and the industry has become more dynamic.
Objective of Study:
The main objectives of the study are:
- To analyse the impact of regulatory transformation on life insurance industry in India in general and LIC of India in particular, and
- To compare the performance of LIC of India over all private life insurers operating in the country in post reforms era.
Research Methodology:
The research plan which has been structured for particular paper is descriptive and analytical in nature. The relevant data have been taken from secondary sources such as books, journals, annual reports of IRDA and different web materials. For analysis purpose, data of twelve years from 2004 to 2015 has been taken into consideration. For statistical analysis, independent sample t-test is used to compare the performance of LIC of India and private life insurers. Tables and graphs are also used to make study more appropriate and visual.
Hypothesis:
For the particular study, following hypothesis has been framed to measure the performance of LIC of India over private life insurers in post reforms period:
H0: There is no significant difference between the business performance of LIC of India and private life insurers operating in India.
H1: There is significant difference between the business performance of LIC of India and private life insurers operating in India.
Regulatory Transformation in Life Insurance Sector and its Impact on LIC of India
Life Insurance came to India in the year 1818 from England when Oriental Life Insurance Company was started life insurance transactions in India. Bombay Insurance Company Limited was established in India in 1823 followed by Madras Equitable Life Assurance Society (1829), United Insurance (1906), Hindustan Cooperatives (1907), Indian Mercantile Swadeshi Life and General Insurance. Indian Life Assurance Companies Act, 1912 was the first statutory norm to regulate the life business. In 1928, the Indian Insurance Companies Act was passed to facilitate the Government to collect statistical information about life and non-life business transacted in India. Moreover, with a view to protect the interest of the insurance public, the earlier legislation was amended by the Insurance Act, 1938 for effective control over the activities of insurers.[ii]
During the pre-independence period, the Insurance Amendment Act, 1950 has abolished the Principal Agencies, and Government of India has decided to nationalise the insurance business due to some unfair trade practices. As a result, life insurance business in India was nationalised on January 19, 1956 and the Parliament of India passed the Life Insurance Corporation Act on June 19, 1956, and the LIC of India came into existence on September 1, 1956.[iii] The nationalisation decision was taken by government in order to channelize more resources towards national development programmes, to increase the insurance market penetration, and to protect the interests of the policyholders from failures.[iv] In the year 1956, LIC had 5 zonal offices, 33 divisional offices and 212 branch offices, apart from its corporate office. But in the later years the need was felt to expand the operations and place a branch office at each district headquarters. Consequently, re-organisation of LIC of India took place and large numbers of new branch offices were opened.
The major changes occurred in life insurance industry in India in form of Insurance Sector Reform. After viewing competition in market, the Government of India has constituted the Malhotra Committee in 1994, headed by former Finance Secretary and RBI Governor, R. N. Malhotra. The committee was aimed at creating a more efficient and competitive financial system suitable for the requirement of the economy keeping in mind the structural changes took place after implementation of LPG policy in 1991. In 1994, committee submitted its report with various recommendations in the form of structure, competition, investments and customer services related to insurance business in India. Keeping in view, the recommendations of Malhotra Committee to regulate the insurance business, IRDA bill was drafted, and introduced in the Parliament. When the bill was introduced in parliament for first time, there were mix reactions about the problems. But in the year 1999, the bill was passed and Insurance Regulatory and Development Authority (Currently Insurance Regulatory and Development Authority of India- IRDAI) was established to promote, regulate, manage and control the insurance business in India in order to move the Indian insurance business to global market.[v] The opening of a new era of insurance progress was seen in form of the entry of global insurers, development of new products, strong distribution networks, dynamic communication means and efficient managerial standards. The new era has changed the monopoly position of the LIC of India. Even than in the presence of twenty three new players in private sector, LIC of India continues to dominate the business with its widespread activities.
Impact of Regulatory Transformation on LIC of India: A Comparison with Private Life Insurers
An attempt has been made to analyse the impact of regulatory transformation and to compare the business performances of LIC of India with all twenty three private life insurers in India over a period of twelve years from 3003-04 to 2014-15. For the purpose of comparative study, some important measures have been taken into consideration, such as, new policies issued by life insurers, life insurance premium underwritten, market shares of life insurers, commission expenses ratio, operating expenses ratios, benefits paid by life insurers and investment income including capital gains.
- New Policies Issued
The issuance of new policy is a good measure of performance assessment. The number of new policy issued in industry has been increased from 286.7 lakhs of policies during the year 2003-04 to 532.25 lakhs policies during the year 2009-10. But after that, it has declined by 90.38 lakhs policies and stood at 259.08 lakhs of policies issued during the financial year 2014-15. The new policies issued by life insurers are presented year wise in table 1.
Endnotes
[i]Pant Arati (2012): Liberaliastion of Life Insurance: New Dimensions; Life Insurance Today, June, 2012.
[ii]History of insurance in India; Insurance Regulatory and Development Authority (IRDA), retrieved from https://www.irda.gov.in on September 16, 2014.
[iii]A Brief History of Insurance and Life Insurance. (2014). Life Insurance Corporation of India; retrieved from https://www.licindia.in/history.htm on September 16, 2014.
[iv]Evolution of Life Insurance Industry. (n.d.). BFSI Sector in India; retrieved from https://www.dnb.co.in/BFSISectorInIndia/LifeIn2.asp
[v]Jain, Yogesh. (2013). Economic Reforms and World Economic Crisis: Changing Indian Life Insurance market place; IOSR Journal of Business and Management (IOSR-JBM), Volume 8, Issue 1 (January - February 2013), pp.106-115; retrieved from www.iosrjournals.org on September 14, 2014.
Table 1: New Policies Issued by Life Insurers
In Lakhs
|
Year
|
LIC of India
|
Private Life Insurers
|
Industry Total
|
|
2003-04
|
269.68
|
16.59
|
286.27
|
|
2004-05
|
239.78
|
22.33
|
262.11
|
|
2005-06
|
315.91
|
38.71
|
354.62
|
|
2006-07
|
382.29
|
79.22
|
461.51
|
|
2007-08
|
376.13
|
132.62
|
508.75
|
|
2008-09
|
359.13
|
150.11
|
509.24
|
|
2009-10
|
388.63
|
143.62
|
532.25
|
|
2010-11
|
370.38
|
111.14
|
481.52
|
|
2011-12
|
357.51
|
84.42
|
441.93
|
|
2012-13
|
367.82
|
74.05
|
441.87
|
|
2013-14
|
345.12
|
63.60
|
408.72
|
|
2014-15
|
201.71
|
57.37
|
259.08
|
|
N
|
12
|
12
|
|
|
Mean
|
331.17
|
81.15
|
|
Source: Annual Reports of IRDA, different years from 2003-04 to 2014-15
|
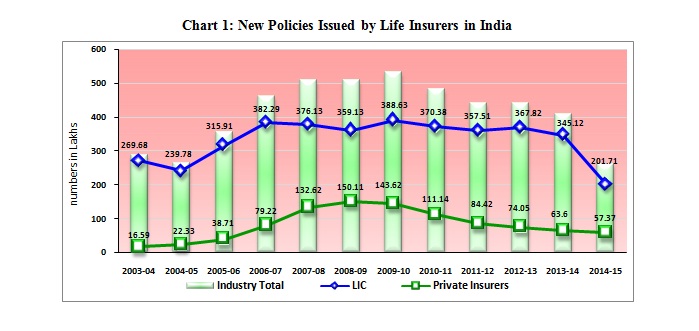
Table 1 depicts the mean values of new policies issued by life insurers. In this regard, it has been found that the mean value for new policies issued by LIC of India is 331.17 lakhs, whereas, in case of private life insurers it stands at 81.15 lakhs over a period of twelve years, from the financial year 2003-04 to 2014-15. It shows that the performance of LIC of India is much better than the performance of private life insurers. (Chart 1)
- Life Insurance Premium Underwritten
Premium income is observed as the key base of income in life insurance industry. Actually premium income is the revenue which is derived from the premium paid by the policyholders. The total premium income underwritten by public sector and private sector life insurance companies from the financial year 2003-04 to 2014-15 are shown in table 2.
Table 2: Life Insurance Premium Underwritten
(Rs. in Crores)
|
Year
|
LIC of India
|
Private Life Insurers
|
Industry Total
|
|
2003-04
|
63533.34
|
3120.33
|
66653.75
|
|
2004-05
|
75127.29
|
7727.51
|
82854.80
|
|
2005-06
|
90792.22
|
15083.53
|
105875.76
|
|
2006-07
|
127822.84
|
28218.75
|
156075.84
|
|
2007-08
|
149789.99
|
51561.42
|
201351.41
|
|
2008-09
|
157288.04
|
64503.22
|
221785.47
|
|
2009-10
|
186077.31
|
79369.94
|
265447.25
|
|
2010-11
|
203473.40
|
88131.60
|
291638.64
|
|
2011-12
|
202889.28
|
84282.83
|
287072.11
|
|
2012-13
|
208803.58
|
78398.91
|
287202.49
|
|
2013-14
|
236942.30
|
77340.90
|
314283.20
|
|
2014-15
|
239667.65
|
88433.49
|
328101.14
|
|
N
|
12
|
12
|
|
|
Mean
|
161850.60
|
55514.37
|
|
Source: Annual Reports of IRDA, different years from 2003-04 to 2014-15
|
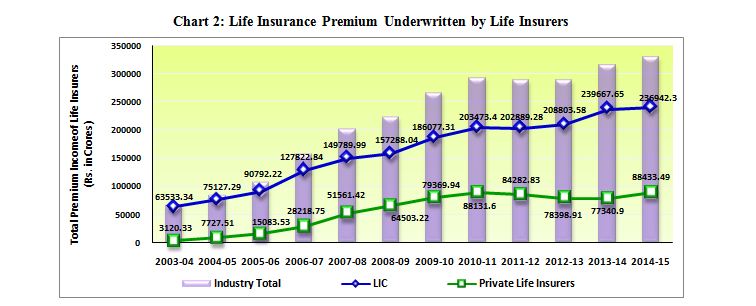
It is obvious from table 2 that the mean value of Rs. 161850.60 crores for LIC of India is quite high than the average of Rs. 55514.37 crores for private life insurers in regard to premium income underwritten over the period of twelve years from the year 2003-04 to 2014-15. It is also evident that the performance of LIC of India is better than the performance of private life insurers during the given time period. A graphical view is also presented in chart 2.
- Market Shares of Life Insurers in India
Market share shows the percentage of life insurance market captured and covered by life insurers in India. In life Insurance market share in form of total premium underwritten is considered as an indicator for the management to review the performance. The market shares captured by public sector and private sector life insurance companies in life insurance industry in India in terms of percentage of premium underwritten is given in table 3.
Table 3: Market Shares of Life Insurers
In percent
|
Year
|
LIC of India
|
Private Life Insurers
|
Industry Total
|
|
2003-04
|
95.32
|
4.68
|
100.00
|
|
2004-05
|
90.67
|
9.33
|
100.00
|
|
2005-06
|
85.75
|
14.25
|
100.00
|
|
2006-07
|
81.90
|
18.90
|
100.00
|
|
2007-08
|
74.39
|
25.61
|
100.00
|
|
2008-09
|
70.92
|
29.08
|
100.00
|
|
2009-10
|
70.10
|
29.90
|
100.00
|
|
2010-11
|
69.78
|
30.22
|
100.00
|
|
2011-12
|
70.68
|
29.32
|
100.00
|
|
2012-13
|
72.70
|
28.30
|
100.00
|
|
2013-14
|
75.39
|
24.61
|
100.00
|
|
2014-15
|
73.05
|
26.95
|
100.00
|
|
N
|
12
|
12
|
|
|
Mean
|
77.55
|
22.60
|
|
Source: Annual Reports of IRDA, different years from 2003-04 to 2014-15
|
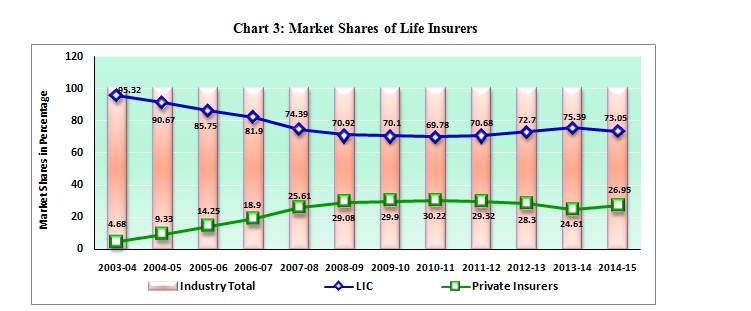
Table 3 shows the mean values of market shares captured by public and private sector life insurers in India. It is evident from the analysis that the mean value of 77.55 percent for LIC of India is quite more than the mean value of 22.60 percent for private life insurers over a period of twelve year form the year 2003-04 to 2014-15. (Chart 3)
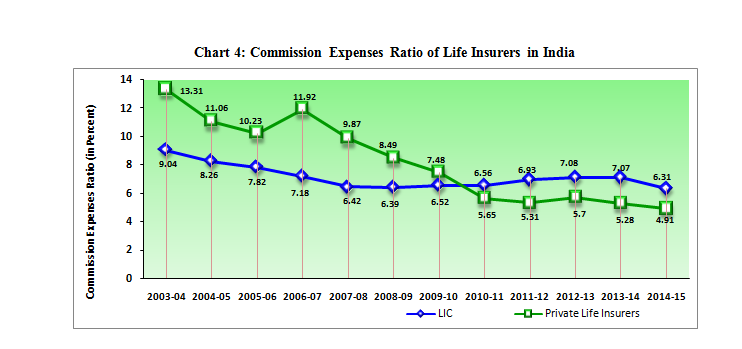
- Commission Expenses Ratio
The fees paid to agents or brokers as a percentage of the policy premium underwritten are known as commission expenses. The percentage may vary widely depending on policy coverage, the insurer and the marketing methods. Commission expenses ratio is the ratio of total commission expenses as a percentage of total earned premium income. High ratio indicates that the company is able to earn more premiums against small commission expenses paid to sales people. Table 4 shows the total commission expenses and commission expense ratio by public sector and private sector life insurance companies in life insurance industry in India. (Chart 4)
Table 4: Commission Expenses Ratio
|
Year
|
LIC of India
|
Private Life Insurers
|
|
Commission Expenses Rs. in crores
|
Total Premium Income Rs. in crores
|
Commission Expense Ratio in %
|
Commission Expenses Rs. in crores
|
Total Premium Income Rs. in crores
|
Commission Expense Ratio in %
|
|
2003-04
|
5742.91
|
63533.34
|
9.04
|
415.42
|
3120.33
|
13.31
|
|
2004-05
|
6203.23
|
75127.29
|
8.26
|
854.73
|
7727.51
|
11.06
|
|
2005-06
|
7100.19
|
90792.22
|
7.82
|
1543.10
|
15083.53
|
10.23
|
|
2006-07
|
9173.58
|
127822.84
|
7.18
|
3109.65
|
28218.75
|
11.92
|
|
2007-08
|
9614.69
|
149789.99
|
6.42
|
5089.61
|
51561.42
|
9.87
|
|
2008-09
|
10055.09
|
157288.04
|
6.39
|
5477.89
|
64503.22
|
8.49
|
|
2009-10
|
12132.56
|
186077.31
|
6.52
|
5942.09
|
79369.94
|
7.48
|
|
2010-11
|
13347.29
|
203473.40
|
6.56
|
4982.03
|
88131.60
|
5.65
|
|
2011-12
|
14063.06
|
202889.28
|
6.93
|
4470.61
|
84282.83
|
5.31
|
|
2012-13
|
14790.26
|
208803.58
|
7.08
|
4471.20
|
78398.91
|
5.70
|
|
2013-14
|
16762.88
|
236942.30
|
7.07
|
4083.49
|
77340.90
|
5.28
|
|
2014-15
|
15118.14
|
239667.65
|
6.31
|
4342.54
|
88433.49
|
4.91
|
|
N
|
12
|
|
12
|
|
|
Mean
|
|
7.13
|
|
8.27
|
|
Source: Annual Reports of IRDA, different years from 2003-04 to 2014-15
|
Table 4 reveals that the mean value of commission expenses ratio of LIC of India stood at 7.13 and 8.27 for private life insurers over a period of twelve years from the year 2003-04 to 2014-15 respectively, which in turn shows a little difference in the performance of public and private sector life insurers in this regard.
-
- Operating Expenses Ratio
The ongoing cost for operating or running a business, service, product, or a system are known as operating expenses.[i] In life insurance business, expenses related to the acquisition or renewal of insurance contracts plus corporate administration costs etc. are known as operating expenses.[ii] Low ratio indicates that the more premiums are underwritten against small operating expenses. Table 5 shows the total operating expenses and operating expense ratio by public sector and private sector life insurers in India from the financial year 2003-04 to 2014-15. (Chart 5)
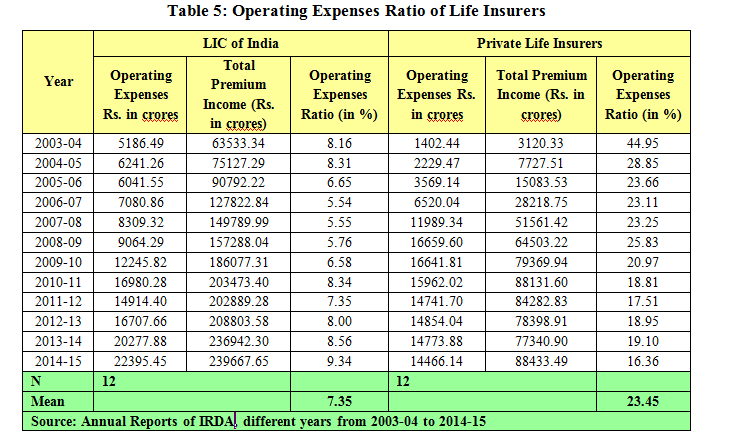
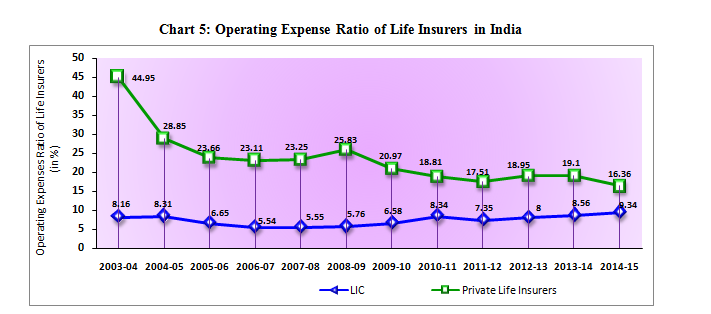
Table 5 exhibits the mean value 7.35 for LIC of India and 23.45 for private life insurers in regard to average operating ratio over a period of 12 years. The graphical view of operating expenses ration may be seen from chart 2.7. Its shows that the low operating costs were incurred by the Corporation during the period, as compared to high operating costs incurred by the private life insurers during the same period of time. Consequently, null hypothesis has been rejected.
- Benefits Paid by Life Insurers in India
The performance of LIC of India and private life insurers regarding benefits paid to policyholders over a period of twelve year form the financial year 2003-04 to 2014-15 is presented with the help of table 6. It has been seen that the higher gross benefit of Rs. 211180.27 crores were paid by life insurance industry during the year 2014-15 to policyholders, which stood Rs. 24012.12 crores during the year 2003-04. (Chart 6)
Table 6: Benefits Paid by Life Insurers in India
Rs. in Crores
|
Year
|
LIC of India
|
Private Life Insurers
|
Industry Total
|
|
2003-04
|
23930.34
|
81.78
|
24012.12
|
|
2004-05
|
28455.71
|
244.86
|
28700.57
|
|
2005-06
|
33956.80
|
1306.65
|
35263.45
|
|
2006-07
|
53298.41
|
2470.27
|
55768.68
|
|
2007-08
|
56550.33
|
5136.05
|
61686.37
|
|
2008-09
|
52478.14
|
5864.97
|
58343.10
|
|
2009-10
|
79162.00
|
16671.00
|
95833.00
|
|
2010-11
|
111273.00
|
31251.00
|
142524.00
|
|
2011-12
|
117497.00
|
35581.00
|
153079.00
|
|
2012-13
|
134922.00
|
57571.00
|
192493.00
|
|
2013-14
|
158015.54
|
58380.09
|
216395.63
|
|
2014-15
|
144125.75
|
67054.52
|
211180.27
|
|
N
|
12
|
12
|
|
|
Mean
|
82805. 41
|
23468. 77
|
|
Source: Annual Reports of IRDA, different years from 2003-04 to 2014-15
|
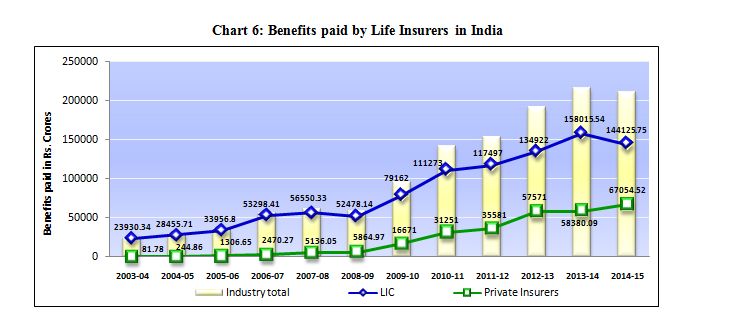
Table 6 reveals the mean value of benefits paid by life insurers in India. It has been observed that the mean value of benefits paid to policyholders is Rs. 82805. 41 by LIC of India and it stood at Rs. 23468.77 crores in case of private life insurers. It means that the more benefits were paid by LIC of India as compared to private life insurers to policyholders compared to all private life insurers operating in the country.
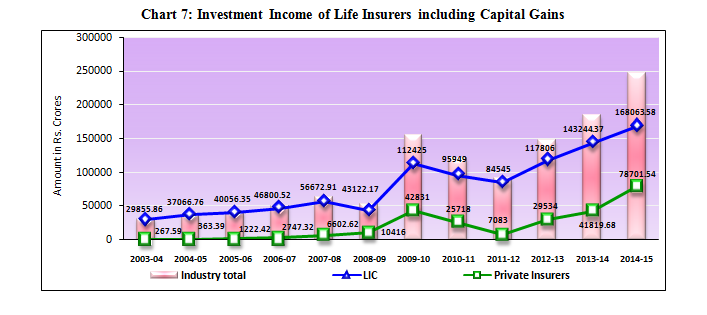
- Investment Income including Capital Gains
Normally, interest, dividends, capital gains, rental and royalty income, income from business involved in trading of financial instruments or commodities and businesses etc. are included in investment income.[i] Particularly, in life insurance business the incomeswhich are derived fromcapital gains,dividends paid and otheractivitiesrelated to the saleoflife insurance policies are known as investment income. The investment income of life insurance industry is shown in table 7.
Table 7: Investment Income including Capital Gains
Rs. in Crores
|
Year
|
LIC of India
|
Private Life Insurers
|
Industry Total
|
|
2003-04
|
29855.86
|
267.59
|
30123.45
|
|
2004-05
|
37066.76
|
363.39
|
37430.15
|
|
2005-06
|
40056.35
|
1222.42
|
41278.77
|
|
2006-07
|
46800.52
|
2747.32
|
49547.84
|
|
2007-08
|
56672.91
|
6602.62
|
63275.53
|
|
2008-09
|
43122.17
|
10416.00
|
53538.17
|
|
2009-10
|
112425.00
|
42831.00
|
155256.00
|
|
2010-11
|
95949.00
|
25718.00
|
121667.00
|
|
2011-12
|
84545.00
|
7083.00
|
91628.00
|
|
2012-13
|
117806.00
|
29534.00
|
147340.00
|
|
2013-14
|
143244.37
|
41819.68
|
185064.05
|
|
2014-15
|
168063.58
|
78701.54
|
246765.12
|
|
N
|
12
|
12
|
|
|
Mean
|
81300.15
|
20608.88
|
|
Source: Annual Reports of IRDA, different years from 2003-04 to 2014-15
|
The table 7 reveals that the mean value of Rs. 81300.15 crores of investment income for LIC of India is quite high than the mean value of Rs. 20608.88 crores of investment income in case of private life insurers. Thus, it is clear from the table that more investment income from different sources has been generated by LIC of India than of its competitors over a period of twelve years from the financial year 2003-04 to financial year 2014-15.
[i]Definition: Investment Income. (n.d.). Definition retrieved from http://www.investopedia.com/terms/i/investmentincome.asp
Other Readings
- Evolution of Life Insurance Industry in India. (N.d.). retrieved on October 12, 2014 from http://www.dnb.co.in
- Life Insurance Marketing in India: The Changing Distribution Norms. (N.d.). Retrieved on September 23, 2014 from icmrindia.org
- Lunawat, M., L. (N.d.). Insurance in India- Changing Policies and Emerging Practices; Response Books, New Delhi.
- Mathew, M., J. (1998). Insurance- Theory and Practices, RBSA Publishers, Jaipur, 1998.
- Nirmal, Ghorawat. (2013). Perspective on Life Insurance Industry in India, retrieved on October 12, 2014 from http://canirmalg.wordpress.com
- Srivastava, , Tripathi, Sarika., and Kumar, Amit. (2012). Life Insurance Industry- The Challenging Trends; retrieved on June 2014, from http://www.researchersworld.com
- Annual reports of IRDA from the year 2003-04 to 2012-13.
- Kaur, Satvinder. (2013). Unit – VI Life Insurance; retrieved on September 23, 2014 from http://www.studymode.com
- Yogesh, Jain. (2013). Economic Reforms and World Economic Crisis- Changing Indian Life Insurance market place; IOSR Journal of Business and Management; Volume 8, Issue 1 (Jan. - Feb. 2013), retrieved on June 12, 2014 from http://www.iosrjournals.org106-115.
- Choudhary, Sonika., and Kiran, Priti. (2011). Life Insurance Industry in India - Current Scenario; International Journal of Management and Business Studies, Vol. 1, Issue 3, September 2011, retrieved on August 27, 2014 from http://www.ijmbs.com, pp. 146-150.
- Bharadi, H, H. (N.d). Role of Insurance Regulatory and Development Authority in Indian Insurance Sector; International Journal in Multidisciplinary and Academic Research (SSIJMAR), Vol. 1, No. 4, November-December, retrieved from http://www.ssijmar.in
- Journals of Insurance Institute of India. different issues; retrieved from http://www.coi.org.in/web/guest/journal
- Journals of IRDA, different issues; retrieved from https://www.irda.gov.in
Results and Discussion:
The Result of given table and its observation in shown in the following table 8 and chart 8:
Table 8: Results of Independent Samples t-Test
|
|
Variables
|
Assumptions
|
Levene's Test for Equality of Variances
|
t-test for Equality of Means
|
|
F
|
Sig.
|
t
|
df
|
Sig.
2 -tailed
|
Mean Differ-ence
|
Std. Error Differ-ence
|
95% Confidence Interval of the Difference
|
|
Sr. No.
|
Lower
|
Upper
|
|
1.
|
New Policies Issued (in Lakhs)
|
Equal variances assumed
|
1.27
|
.27
|
11.34
|
22
|
.00
|
250.03
|
22.05
|
204.29
|
295.76
|
|
Equal variances not assumed
|
|
|
11.34
|
20.22
|
.00
|
250.03
|
22.05
|
204.06
|
296.00
|
|
2.
|
Total Premium Underwritten (Rs. in Crores)
|
Equal variances assumed
|
5.42
|
.03
|
5.28
|
22
|
.00
|
1.06336E5
|
20134.45
|
64579.94
|
1.48093E5
|
|
Equal variances not assumed
|
|
|
5.28
|
16.89
|
.00
|
1.06336E5
|
20134.45
|
63836.21
|
1.48836E5
|
|
3.
|
Market Shares
(in Percentage)
|
Equal variances assumed
|
.000
|
.99
|
15.39
|
22
|
.00
|
54.96
|
3.57
|
47.55
|
62.36
|
|
Equal variances not assumed
|
|
|
15.39
|
22.00
|
.00
|
54.96
|
3.57
|
47.55
|
62.36
|
|
4.
|
Commission Expense Ratio
(in Percentage)
|
Equal variances assumed
|
22.67
|
.00
|
-1.28
|
22
|
.21
|
-1.14
|
.89
|
-2.98
|
.70
|
|
Equal variances not assumed
|
|
|
-1.28
|
12.79
|
.22
|
-1.14
|
.89
|
-3.06
|
.78
|
|
5.
|
Operating Expense Ratio
(in Percentage)
|
Equal variances assumed
|
5.28
|
.03
|
-7.15
|
22
|
.00
|
-16.10
|
2.25
|
-20.77
|
-11.44
|
|
Equal variances not assumed
|
|
|
-7.15
|
11.62
|
.00
|
-16.10
|
2.25
|
-21.02
|
-11.18
|
|
6.
|
Benefit paid to Policyholders (Rs. in Crores)
|
Equal variances assumed
|
9.22
|
.00
|
3.77
|
22
|
.00
|
59337.65
|
15726.23
|
26723.44
|
91951.86
|
|
Equal variances not assumed
|
|
|
3.77
|
16.76
|
.00
|
59337.65
|
15726.23
|
26122.44
|
92552.87
|
|
7.
|
Investment Income including Capital Gain (Rs. in Crores)
|
Equal variances assumed
|
7.24
|
.013
|
4.03
|
22
|
.00
|
60691.75
|
15044.32
|
29491.50
|
91891.75
|
|
Equal variances not assumed
|
|
|
4.03
|
16.61
|
.00
|
60691.75
|
15044.32
|
28893.76
|
92489.73
|
|
|
|
|
|
|
|
|
|
|
|
|
|
Chart 8: Discussion of Results
|
Sr. No.
|
Variables
|
Interpretation
|
Result of Hypothesis
|
|
1.
|
New Policies Issued (in Lakhs)
|
The sig. value (probability) of Levene's test is more than 0.05 i.e. .27. Thus, we have to use the equal variances assumed result. The t value (11.34) is very high than the critical value of t (1.717) at 22 degrees of freedom with probability of 0.000 , which is less than the significance level of 0.05. It indicates that, there exists a significant difference between the new policies issued by LIC of India and private life insurers; and therefore, the null hypothesis has been rejected.
|
Rejected
|
|
2.
|
Total Premium Income (Rs. in Crores)
|
The significance value 0.03 of Levence’s statistic for premium income shows that variance between the group are not equal. Consequently, the t-statistics 5.28 is quite more than the tabulated value 1.729 with significance value of .000 at 16.89 degrees of freedom. It indicates that there exists a significant difference between the total premium underwritten by LIC of India and private life insurers during specified period of time and consequently, null hypothesis has been rejected. It is also evident that the performance of LIC of India is better than the performance of private life insurers during the given time period.
|
Rejected
|
|
3.
|
Market Shares (in Percentage)
|
For the particular variable market shares, The significance value 0.99 of Levence’s statistic is more than the significance level of 0.05, which shows that the variances between the groups are equal. The t-statistics 15.39 is more than the tabulated value 1.717 with significance value of .00 at 22 d.f. It specifies that there is a significant difference between the market shares captured by LIC of India and private life insurers (together) in India. Thus the null hypothesis has been rejected and shows that LIC of India has been capturing more market shares than of its competitors.
|
Rejected
|
|
4.
|
Commission Expense Ratio (in Percentage)
|
In case of commission expense ratio, it has been revealed from the analysis that the significance value of Levence statistic 0.00 which indicates that the variances between the groups are not equal. The t-statistics -1.28 (significance value 0.22) at 12.79 d.f. indicates that there is no significant difference between the commission expense ratios of LIC of India and private life insurers operating in India. It also reveals a very little difference between the commission expenses and premium income underwritten by public and private sector life insurers.
|
Accepted
|
|
5.
|
Operating Expense Ratio (in Percentage)
|
For operating expense ratio, Levene’s statistics shows the low than 0.05 (that is 0.03). Thus it is assumed that the variances between the groups are not equal. Moreover, the probability the t-statistics -7.15 (significance value 0.00) at 11.62 d.f. indicates that there exists a significant difference between the operating expense ratios of LIC of India and private life insurers operating in India. It shows that the low operating costs were incurred by the Corporation during the period, as compared to high operating costs incurred by the private life insurers during the same period of time. Consequently, null hypothesis has been rejected.
|
Rejected
|
|
6.
|
Benefit paid to Policy-holders (Rs. in Crores)
|
In the particular analysis of benefits paid to policyholders by public and private sector life insurers, the significance value of Levence’s test is 0.00, which indicates that the equal variances between the groups does not exist. In independent samples t test, t value (3.77) is quite high than the critical value of t (1.739) at 16.76 degrees of freedom which gives the probability of 0.00 which is less than the significance level of 0.05. It means that there is significant difference exists between the benefits paid to policyholders by LIC of India and private life insurers, and revealed that the more benefits were paid by LIC of India as compared to private life insurers to policyholders, and thus null hypothesis has been rejected.
|
Rejected
|
|
7.
|
Investment Income including Capital Gains (Rs. in Crores)
|
In case of investment income, it has been revealed from the analysis that the significance value of Levence statistic 0.013 (less than significance value of 0.00) which indicates that the variances between the groups are not equal. Furthermore, the t value (4.03) is more than the critical value of t (1.739) at 16.61 d.f. with probability of 0.000. It shows that there is significant difference between the investment income of LIC and private life insurers in and therefore the null hypothesis has been rejected.
|
Rejected
|
Concluding Remarks
In India, life insurance business has passed from two different phases, viz. from liberal business to nationalisation of life insurance sector and emergence of LIC of India on September 1, 1956 by an Act of Parliament -Life Insurance Corporation Act 1956; and then come back of private and foreign life insurers in India after the establishment of IRDA in the year 2000 as per the recommendations of Malhotra Committee, in order to regulate and control the business of insurance in India. In the year 2014, IRDA was renamed as IRDAI (Insurance Regulatory and Development Authority of India) after the promulgation of Insurance Laws (Amendment) Ordinance 2014, by the President of India.
An attempt had been made to assess the impact of regulatory changes on the business performance of LIC of India, some measures such as new policies issued, premium income, market shares, commission expenses ratios, operating expenses ratios, benefits paid to policyholders and investment income have been taken into consideration and it has been found that the business performance of LIC of India is quite better than the private sector life insurance companies over a period of twelve years from the year 2003-04 to 2014-15. After insurance sector reforms, the market shares of LIC of India has been started declining continuously from 100 percent to 73.05 percent till 2015. Even after facing a very tough competition from all private and foreign ventures, LIC of India still manages the position of a market leader in life insurance market.
The reason behind the success of LIC of India after insurance sector reforms is its long term business experience in the field of life insurance since September 1, 1956 and trust among the general masses of India. It is the brand name of LIC which is understood as synonymous with life insurance among general public. Thus, it is revealed that LIC has maintained its brand name in the presence of strong market competitors and proved its excellence in business performance.
References
Endnotes
[1]Pant Arati (2012): Liberaliastion of Life Insurance: New Dimensions; Life Insurance Today, June, 2012.
[1]History of insurance in India; Insurance Regulatory and Development Authority (IRDA), retrieved from https://www.irda.gov.in on September 16, 2014.
[1]A Brief History of Insurance and Life Insurance. (2014). Life Insurance Corporation of India; retrieved from https://www.licindia.in/history.htm on September 16, 2014.
[1]Evolution of Life Insurance Industry. (n.d.). BFSI Sector in India; retrieved from https://www.dnb.co.in/BFSISectorInIndia/LifeIn2.asp
[1]Jain, Yogesh. (2013). Economic Reforms and World Economic Crisis: Changing Indian Life Insurance market place; IOSR Journal of Business and Management (IOSR-JBM), Volume 8, Issue 1 (January - February 2013), pp.106-115; retrieved from www.iosrjournals.org on September 14, 2014.
[1]Definition: Operating Expenses. (n.d.). Definition retrieved from http://www.sampo.com/about-us/glossary/?q=Operating+expenses
[1]Definition: Investment Income. (n.d.). Definition retrieved from http://www.investopedia.com/terms/i/investmentincome.asp
Other Readings
- Evolution of Life Insurance Industry in India. (N.d.). retrieved on October 12, 2014 from http://www.dnb.co.in
- Life Insurance Marketing in India: The Changing Distribution Norms. (N.d.). Retrieved on September 23, 2014 from icmrindia.org
- Lunawat, M., L. (N.d.). Insurance in India- Changing Policies and Emerging Practices; Response Books, New Delhi.
- Mathew, M., J. (1998). Insurance- Theory and Practices, RBSA Publishers, Jaipur, 1998.
- Nirmal, Ghorawat. (2013). Perspective on Life Insurance Industry in India, retrieved on October 12, 2014 from http://canirmalg.wordpress.com
- Srivastava, , Tripathi, Sarika., and Kumar, Amit. (2012). Life Insurance Industry- The Challenging Trends; retrieved on June 2014, from http://www.researchersworld.com
- Annual reports of IRDA from the year 2003-04 to 2012-13.
- Kaur, Satvinder. (2013). Unit – VI Life Insurance; retrieved on September 23, 2014 from http://www.studymode.com
- Yogesh, Jain. (2013). Economic Reforms and World Economic Crisis- Changing Indian Life Insurance market place; IOSR Journal of Business and Management; Volume 8, Issue 1 (Jan. - Feb. 2013), retrieved on June 12, 2014 from http://www.iosrjournals.org106-115.
- Choudhary, Sonika., and Kiran, Priti. (2011). Life Insurance Industry in India - Current Scenario; International Journal of Management and Business Studies, Vol. 1, Issue 3, September 2011, retrieved on August 27, 2014 from http://www.ijmbs.com, pp. 146-150.
- Bharadi, H, H. (N.d). Role of Insurance Regulatory and Development Authority in Indian Insurance Sector; International Journal in Multidisciplinary and Academic Research (SSIJMAR), Vol. 1, No. 4, November-December, retrieved from http://www.ssijmar.in
- Journals of Insurance Institute of India. different issues; retrieved from http://www.coi.org.in/web/guest/journal
- Journals of IRDA, different issues; retrieved from https://www.irda.gov.in

