A Refereed Monthly International Journal of Management
How does Board Attributes and Shareholding Pattern effect Firm’s Financial Performance: Empirical Evidence from Consumer Goods Sector in India
Author
|
Dr. Seema Malik,
Assistant Professor,
Department of Commerce, BPSMV, Khanpur Kalan.
E-mail: seemamalikphd@gmail.com
|
Abstract
Purpose – This paper examines the effect of corporate governance attributes on the financial performance of BSE (Bombay Stock Exchange) listed consumer goods (FMCG and durables) firms in India over the period 2004-2014.
Design/methodology/approach – In order to draw the empirical results, corporate governance attributes like the shareholding pattern and Board Attributes are used as the key independent variables and three financial performance measures i.e. Return on Assets (ROA), Return on Equity (ROE), and Earnings per Share (EPS) are used as dependent variables. Panel data methodology is used to find out empirical results.
Findings –The promoters’ shareholding and Foreign Institutional Investors’ shareholding was significantly and positively related to the performance. Board size and the percentage of directors having board interlocking were negatively and significantly related with financial performance.
Practical implications – The study recommends that firms in consumer goods sector should increase the promoters’ shareholding and foreign institutional shareholding as both of them has positive linkages with the firm’s financial performance. Large size of board can face the problems of co-ordination, communication and decision-making. On the other hand, firms should reduce their board size and try to include those directors in the board who does not have board interlocking as board size and board interlocking has negative impact on the financial performance of the firms under study. The board interlocking impaired the firms’ performance because of busy board not performing their monitoring task effectively.
Keywords: India, Consumer Goods, Corporate Governance, Financial performance, Panel data
Paper type Research paper
Introduction
The corporate governance issues have succeeded in attracting a good deal of public interest because of their evident importance for the economic health of corporations and society in general, especially after the overabundance of corporate scams and disasters in the recent times.
In the new environmental context, corporate governance is no longer a luxury but a necessity. There is a gap between principle and practice of corporate governance. The primary concern of corporate governance is to ensure that the firm’s directors and managers act ethically in the interests of the firm and its shareholders and that the managers are held accountable to fund providers for the use of assets. Corporate governance issues are in general receiving greater attention as a result of the increasing recognition that a firm’s corporate governance affects both its economic performance and its ability to access long-term, low investment capital.
Development in conceptual framework
There has been an extensive review of literature on literature on the study of the impact of corporate governance on the financial performance of the firms. The results are diverse on whether the impact is positive or negative or significant or non-significant. While some earlier studies have empirically documented that corporate governance attributes has positive impact on the firm’s financial performance and some documented the negative impact. These various studies reflecting the positive and negative impact of various attributes of the corporate governance are as follows:
Board Size: Board size included total number of directors in the board. There are many studies who have demonstrated the positive association and impact of Board size on the financial performance of the firms. These studies included Sheikh N. H. et al (2013), Ehikioya 2009, Coles et al. 2008, Dwivedi and Jain, 2005 and Klein 2002, Wang, W. K. et al( 2011), Mishra, S. & Mohanty, P. (2014), O’Connell, V. & Cramer, N. (2010).
However, on the contrary some of the studied documented the negative impact of board size on the financial performance of the firms. These studies included Yermack (1996), Eisenberg et al., 1998; Fernandez et al., 1997; Wang, W. K. et al (2012), Ujunva A. (2012), Al-Saidi M. & Al-Shammari B.(2013), Guo Z. & Kumara U.(2012), Mashayekhi B. & Bazaz M.S.(2008), Nyamongo, E. M. & Temesgen K. (2013).
Andres P. D. & Vallelado E. (2008) found the inverted u shaped association between the board size and financial performance of the firms.
Board Independence: Board independence means the percentage of Independent directors in the board. There are many studies who have demonstrated the positive association and impact of Board independence on the financial performance of the firms. These studies included Ward (1991); Felton and Watson (2002) and Newell and Wilson (2002), Stefdnescu C. A. (2011), Pombo, C. & Gutierrez, L.H. (2011), Nyamongo, E. M. & Temesgen K. (2013), Mishra, S. & Mohanty, P. (2014), Filatotchev, I. Et al (2005), Mashayekhi B. & Bazaz M.S.(2008)
However, on the contrary some of the studied documented the negative impact of board independence on the financial performance of the firms. These studies included Wang, W. K. et al (2012), Sheikh N. H., Wang Z. and Khan S. (2013), Al-Saidi M. & Al-Shammari B.(2013), Berthelot, S., et.al (2012), Guo Z. & Kumara U.(2012), O’Connell, V. & Cramer, N. (2010).
Board Interlocking: It means Percentage of directors having Board interlocking. When a director serves as a board member in two or more companies, thus establishing a connection between them; this phenomenon is known as Board interlocking (Fich & White, 2005). There are many studies who have demonstrated the positive association and impact of Board interlocking on the financial performance of the firms. These studies included Mishra, S. & Mohanty, P. (2014), Pombo, C. & Gutierrez, L.H. (2011).
Board Meetings: It means Number of Board meetings held during a financial year. Mishra, S. & Mohanty, P. (2014) found positive impact of board meeting on the financial performance of the firms while Berthelot, S., et.al (2012) found negative association between the board meeting and the financial performance of the firms.
Remuneration of Executive directors: It means Average total remuneration of each executive director in the board. The earlier studies namely Firth et al. (2007), Kato T. et al (2007), Kato, T. & Kubo, K. (2006), Lee, K. W. et al. (2008), Mishra, S. & Mohanty, P. (2014) found the positive association between the Remuneration of Executive directors and the financial performance of the firms while Abdullah, S. N. (2006) found negative association between the Remuneration of Executive directors and the financial performance of the firms.
Shareholding Pattern: Shareholding pattern included percentage of Promoters’ Shareholdings (PSH), Indian Institutional Shareholding (ISH) (Percentage of shares held by the Indian institutions like banks, financial institutions, mutual funds, insurance companies etc. in a company) and Foreign Institutional Shareholding (FII) in the total shareholding of the company. Kumar N. & Singh J. P. (2013) found positive association between the Promoters’ Shareholdings and the financial performance of the firms. While, Filatotchev, I. Et al (2005)
found positive association between the Indian institutional Shareholdings and the financial performance of the firms. The studies like Arouri H. et al (2014), Filatotchev, I. Et al (2005), Patibandla M.(2005), Omran M. (2009) found positive association between the foreign institutional Shareholdings and the financial performance of the firms.
Data and Methodology
Sample
The target population comprised of the companies in consumer goods ((Fast moving and durables) sector in India. The reason behind choosing the consumer goods sector is that this sector contributes highest i.e. 10.20 per cent towards BSE 200 total Market Capitalisation among all the secondary sectors as presented in table 1.
Table 1: Percentage contributions of various sectors towards BSE 200 Total Market Capitalisation as on 16th Oct, 2014
|
Sector
|
BSE 200 S&P
|
Sector
|
|
Finance
|
26.08
|
Tertiary
|
|
Information technology
|
13.64
|
Tertiary
|
|
FMCG & durables
|
10.20
|
Secondary
|
|
Oil & Gas
|
9.66
|
Secondary
|
|
Transport Equipment
|
9.61
|
Secondary
|
|
Health care
|
7.09
|
Secondary
|
|
Capital Goods
|
4.85
|
Secondary
|
|
Metal
|
4.36
|
Secondary
|
|
Power
|
3.13
|
Secondary
|
|
Telecom
|
2.66
|
Tertiary
|
|
Housing related
|
2.39
|
Secondary
|
|
Chemicals & Agro chemicals
|
1.90
|
Secondary
|
|
Media and publishing
|
0.91
|
Tertiary
|
|
Transport services
|
0.89
|
Tertiary
|
|
Diversified
|
0.87
|
Secondary
|
|
Textiles
|
0.82
|
Secondary
|
|
Consumer durables
|
0.50
|
Secondary
|
|
Miscellaneous
|
0.24
|
Secondary
|
|
Tourism
|
0.14
|
Tertiary
|
(Source: www.bseindia.com retrieved on 16th Oct, 2014)
Sample firms are taken from the BSE 200 companies as the firms in BSE 200 Index accounts for about 72 percent of market capitalisation of all the companies listed on BSE (Kumar N. & Singh J. P., 2013). There were 23 consumer good firms in BSE 200 index (as accessed from www.bseindia.com on 16th Oct, 2014) and final sample consisted of 16 consumer goods firms (Annexure 1)due to non-availability of firm-level data on the board attributes and ownership pattern of all firms. The period of the study is 2004-2014 and data is collected using PROWESS Database and from the annual reports of the companies under study.
Variables
There are three types of variables which are used in the study. These are: Dependent, Independent and Control variables. These variables are largely adopted from existing review of literature. These are explained as follows in Table II:
Table II: Definition of the various variables used in the study
|
Dependent Variables
|
|
Return on Assets (ROA)
|
Ratio of profit after tax to total assets
|
|
Return on Equity (ROE)
|
Ratio of Profit after tax- Preference Dividend to Equity Capital
|
|
Earnings Per Share (EPS)
|
Ratio of Profit distributed to shareholder to No. of total shareholders
|
|
Independent Variables
|
|
Board Size (BS)
|
Total numbers of directors in the board.
|
|
Independent directors (PIND)
|
Percentage of Independent directors in the board.
|
|
Board meetings (BM)
|
Number of Board meetings held during a financial year.
|
|
Board Interlocking (PBIL)
|
Percentage of directors having Board interlocking.
|
|
Average Directorship (ADIR)
|
Average number of directorships held by a director in other companies in a financial year. (It included directorships in other public limited companies and excluded private and foreign companies as per the information provided by the corporate governance reports of the firms under study).
|
|
Average Remuneration (ATR)
|
Average total remuneration drawn by each executive director in the board.
|
|
Promoters’ shareholding (PSH)
|
Percentage of promoters’ shareholding in total shares
|
|
Indian Financial Institutions’ Shareholding (ISH)
|
Percentage of Indian Financial Institutions’ shareholding in total shares.
|
|
Foreign Institutional investors’ shareholding (FII)
|
Percentage of shares Foreign Institutional Investors’ shareholding in total shares.
|
|
Control Variables
|
|
Size
|
Firm’s Total Assets
|
|
Leverage (LEV)
|
Debt-Equity ratio
|
|
Age
|
Age of a firm from the date of its incorporation
|
|
Sales
|
Total Sales
|
Model Specification
Panel data methodology is used to find out empirical results. The data consisted of both cross-sectional data and time series data. There are three main methods of analysing panel data. These are: Constant Coefficient Method (CCM), Fixed Effect method (FEM) and Random Effect Method (REM). Constant Coefficient Method (CCM) is a method which use pool observations and estimate a “grand” regression, neglecting the cross-section and time-series nature of data. To make a choice between the Constant Coefficient Method (CCM) and Fixed Effect Method and to check the significance of fixed effects, the Redundant Fixed Effects Tests is applied. If fixed effects results reveal its significance, then another test called Hausman Test is applied to choose between the Fixed Effect method and Random Effect Method.
In order to assess the effect of governance attributes on the financial performance of the firms, three panel data regression model is fitted to the data for three performance variables.
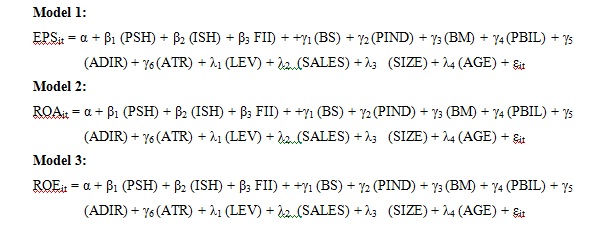
Empirical Results:
Consumer sector consisted of 16 firms in the study. Before proceeding further, the stationary condition of all the variables (dependent variables, independent variables and control variables) was checked using unit root test. A stationary series can be defined as one with a constant mean, constant variance and constant auto co-variances for each given lag. The use of non-stationary data can lead to spurious regressions (Brooks C, 2008). Unit root test are based on testing the null hypothesis that series is not stationery (Kozhan R., 2010). The results of unit root test are presented here in table III as follows:
Table III: Results of Unit Root Test of variables
|
Panel unit root test: Summary
|
|
Automatic lag length selection based on SIC: 0 to 1
|
|
Newey-West automatic bandwidth selection and Bartlett kernel
|
|
Series
|
Method
|
Statistic
|
Prob.**
|
Cross-sections
|
Obs.
|
|
Null: Unit root (assumes common unit root process)
|
|
EPS
|
Levin, Lin & Chu t*
|
-1.65526
|
0.0489*
|
16
|
140
|
|
ROE
|
Levin, Lin & Chu t*
|
-2.07538
|
0.0190*
|
16
|
142
|
|
ROA
|
Levin, Lin & Chu t*
|
-4.28918
|
0.0000*
|
16
|
136
|
|
PSH
|
Levin, Lin & Chu t*
|
-59.0315
|
0.0000*
|
13
|
112
|
|
ISH
|
Levin, Lin & Chu t
|
-1.12997
|
0.1292
|
16
|
140
|
|
FII
|
Levin, Lin & Chu t*
|
-1.97061
|
0.0244*
|
16
|
138
|
|
BS
|
Levin, Lin & Chu t*
|
-5.25377
|
0.0000*
|
16
|
141
|
|
PIND
|
Levin, Lin & Chu t*
|
-10.0488
|
0.0000*
|
14
|
121
|
|
BM
|
Levin, Lin & Chu t*
|
-5.40774
|
0.0000*
|
14
|
125
|
|
PBIL
|
Levin, Lin & Chu t*
|
-3.45076
|
0.0003*
|
15
|
134
|
|
ADIR
|
Levin, Lin & Chu t*
|
-2.21574
|
0.0134*
|
16
|
139
|
|
ATR
|
Levin, Lin & Chu t
|
-0.03256
|
0.4870
|
15
|
128
|
|
LEV
|
Levin, Lin & Chu t*
|
-11.7456
|
0.0000*
|
15
|
132
|
|
SALES
|
Levin, Lin & Chu t
|
7.61087
|
1.0000
|
16
|
140
|
|
LSIZE
|
Levin, Lin & Chu t*
|
-5.89502
|
0.0000*
|
16
|
128
|
|
LAGE
|
Levin, Lin & Chu t*
|
-14.2845
|
0.0000*
|
7
|
56
|
|
*= Significant at 5 percent level of significance.
|
The above table depicted that all the variables are stationary in nature except – ISH, ATR and SALES. The p value of these variables is greater than 5 percent. This means null hypothesis is accepted and the series are non-stationary in nature. To remove this problem, the growth rate of these variables was taken being a relative measure instead of taking the first difference (absolute measure).
While fitting a model, there should not exists multicollinearity between predictors. Multicollinearity makes it difficult to assess the individual importance of a predictor (Field A., 2005). The Pearson’s correlation between each pair of independent variables should not exceed 0.80 (Bryman and Cramer, 1997) and (Kennedy, 1985) or more than 0.90 (Tabachnick and Fidell, 1996); otherwise independent variables with a coefficient in excess of 0.80 may be suspected of exhibiting multicollinearity. The results of the pair-wise correlations presented in Table IV. The results indicated that correlation between all the explanatory variables is very small. So, there exists no problem of multicollinearity.
Table IV: Correlation Matrix of explanatory variables
|
Correlation
|
|
Prob.
|
PSH
|
GISH
|
FII
|
BS
|
PIND
|
BM
|
PBIL
|
ADIR
|
GATR
|
LEV
|
GSALES
|
LSIZE
|
LAGE
|
|
PSH
|
1.00
|
|
|
|
|
|
|
|
|
|
|
|
|
|
Prob.
|
-----
|
|
|
|
|
|
|
|
|
|
|
|
|
|
GISH
|
0.10
|
1.00
|
|
|
|
|
|
|
|
|
|
|
|
|
Prob.
|
0.19
|
-----
|
|
|
|
|
|
|
|
|
|
|
|
|
FII
|
-0.37
|
-0.15
|
1.00
|
|
|
|
|
|
|
|
|
|
|
|
Prob.
|
0.00
|
0.06
|
-----
|
|
|
|
|
|
|
|
|
|
|
|
BS
|
0.12
|
0.07
|
-0.13
|
1.00
|
|
|
|
|
|
|
|
|
|
|
Prob.
|
0.13
|
0.35
|
0.10
|
-----
|
|
|
|
|
|
|
|
|
|
|
PIND
|
0.09
|
-0.13
|
0.05
|
-0.22
|
1.00
|
|
|
|
|
|
|
|
|
|
Prob.
|
0.25
|
0.09
|
0.48
|
0.00
|
-----
|
|
|
|
|
|
|
|
|
|
BM
|
0.03
|
0.35
|
-0.25
|
-0.02
|
0.01
|
1.00
|
|
|
|
|
|
|
|
|
Prob.
|
0.65
|
0.00
|
0.00
|
0.77
|
0.81
|
-----
|
|
|
|
|
|
|
|
|
PBIL
|
-0.08
|
0.04
|
0.29
|
0.08
|
0.08
|
-0.06
|
1.00
|
|
|
|
|
|
|
|
Prob.
|
0.31
|
0.61
|
0.00
|
0.30
|
0.29
|
0.40
|
-----
|
|
|
|
|
|
|
|
ADIR
|
-0.00
|
0.06
|
-0.10
|
0.00
|
-0.08
|
0.18
|
0.36
|
1.00
|
|
|
|
|
|
|
Prob.
|
0.96
|
0.46
|
0.22
|
0.98
|
0.33
|
0.02
|
0.00
|
-----
|
|
|
|
|
|
|
GATR
|
-0.00
|
-0.05
|
-0.02
|
-0.00
|
-0.03
|
-0.03
|
0.02
|
-0.04
|
1.00
|
|
|
|
|
|
Prob.
|
0.97
|
0.51
|
0.77
|
0.92
|
0.63
|
0.67
|
0.80
|
0.59
|
-----
|
|
|
|
|
|
LEV
|
0.22
|
0.06
|
-0.14
|
-0.12
|
0.30
|
0.29
|
0.17
|
0.24
|
-0.10
|
1.00
|
|
|
|
|
Prob.
|
0.00
|
0.44
|
0.08
|
0.13
|
0.00
|
0.00
|
0.03
|
0.00
|
0.18
|
-----
|
|
|
|
|
GSALES
|
0.32
|
0.13
|
-0.07
|
-0.03
|
-0.11
|
0.12
|
0.10
|
0.17
|
0.04
|
0.23
|
1.00
|
|
|
|
Prob.
|
0.00
|
0.09
|
0.36
|
0.27
|
0.16
|
0.14
|
0.21
|
0.03
|
0.58
|
0.00
|
-----
|
|
|
|
LSIZE
|
-0.19
|
0.03
|
0.06
|
0.19
|
0.23
|
0.08
|
-0.04
|
-0.17
|
-0.16
|
0.10
|
-0.25
|
1.00
|
|
|
Prob.
|
0.01
|
0.69
|
0.43
|
0.01
|
0.00
|
0.28
|
0.62
|
0.03
|
0.04
|
0.20
|
0.00
|
-----
|
|
|
LAGE
|
-0.53
|
-0.12
|
-0.07
|
0.06
|
-0.14
|
-0.04
|
-0.30
|
-0.26
|
-0.01
|
-0.50
|
-0.37
|
0.28
|
1.00
|
|
Prob.
|
0.00
|
0.12
|
0.35
|
0.44
|
0.09
|
0.60
|
0.00
|
0.00
|
0.82
|
0.00
|
0.00
|
0.00
|
-----
|
Selection of Appropriate Method:
Initially, two ways Fixed Effect Method was applied for the entire three models i.e. EPS, ROA and ROE. The redundant fixed effect test was used to check the significance of fixed effects. The test gave the following results as presented in Table V:
Table V: Redundant Fixed Effects Tests (Consumer goods Sector)
|
Test cross-section and period fixed effects
|
|
Effects Test
|
EPS
|
ROA
|
ROE
|
|
Statistic
|
d.f.
|
Prob.
|
Statistic
|
d.f.
|
Prob.
|
Statistic
|
d.f.
|
Prob.
|
|
Cross-Section/
Period F
|
32.4577
|
(23,107)
|
0.0000*
|
12.8006
|
(23,107)
|
0.0000*
|
14.8776
|
(23,107)
|
0.0000*
|
|
Cross-Section/
Period Chi-square
|
299.023
|
23
|
0.0000*
|
190.391
|
23
|
0.0000*
|
206.583
|
23
|
0.0000*
|
(*=Significant at 5 percent level of significance)
So, null hypothesis is rejected here which means the fixed effects are significant at 5 percent level of significance. So Fixed Effect Method can be applied here instead of Constant Coefficient Method. The Hausman test for random effects was used to make a choice between Fixed Effect Method and Random Effect Method. The results of the same are presented in Table VI.
Table VI: Correlated Random Effects - Hausman Test
|
Test cross-section random effects
|
|
|
EPS
|
ROA
|
ROE
|
|
Test Summary
|
Chi-Sq. Statistic
|
d.f.
|
Prob.
|
Chi-Sq. Statistic
|
d.f.
|
Prob.
|
Chi-Sq. Statistic
|
d.f.
|
Prob.
|
|
Cross-section random
|
558.60
|
13
|
0.0000*
|
52.24
|
13
|
0.0000*
|
133.48
|
13
|
0.0000*
|
(*=Significant at 5 percent level of significance)
So, the Results of Hausman test rejected the hypotheses that individual effects are purely random and uncorrelated with the regressors. This violates the basic assumption of random effect model. So, Finally Fixed Effect Method was applied to the EPS, ROA and ROE model. the results of these models are presented in the table VII.
Table VII: Final Models
|
|
Model 1
(Fixed effect model)
|
Model 2
(Fixed effect model)
|
Model 3
(Fixed effect model)
|
|
|
EPS
|
ROA
|
ROE
|
|
VARIABLES
|
Coefficient
|
Prob.
|
Coefficient
|
Prob.
|
Coefficient
|
Prob.
|
|
C
|
-1110.301
|
0.0000*
|
254.0371
|
0.0000*
|
979.6662
|
0.0000
|
|
PSH
|
0.997203
|
0.0020*
|
0.099268
|
0.2315
|
0.292064
|
0.3255
|
|
GISH
|
-0.015026
|
0.1575
|
-0.002525
|
0.3631
|
0.012082
|
0.2254
|
|
FII
|
0.101036
|
0.8299
|
0.230863
|
0.0629**
|
1.232305
|
0.0061*
|
|
BS
|
0.876572
|
0.4983
|
-1.172562
|
0.0007*
|
-2.116706
|
0.0833**
|
|
PIND
|
-0.620058
|
0.0141*
|
-0.214566
|
0.3498
|
0.919520
|
0.0001*
|
|
BM
|
-0.443606
|
0.6122
|
-0.006017
|
0.8440
|
-0.900510
|
0.2740
|
|
PBIL
|
-0.232255
|
0.0486*
|
-1.693133
|
0.0000*
|
-0.027023
|
0.8052
|
|
ADIR
|
-6.855652
|
0.0000*
|
-0.007813
|
0.4003
|
-3.492512
|
0.0159*
|
|
GATR
|
-0.041869
|
0.2386
|
-6.843463
|
0.0000*
|
-0.052937
|
0.1134
|
|
LEV
|
-3.590051
|
0.4798
|
-0.004225
|
0.8529
|
-11.41927
|
0.0180*
|
|
GSALES
|
0.178248
|
0.0425*
|
-6.612702
|
0.0145*
|
-0.053285
|
0.5146
|
|
LSIZE
|
73.28312
|
0.0000*
|
-17.89346
|
0.0133*
|
-24.94810
|
0.0102*
|
|
LAGE
|
-160.6251
|
0.0000*
|
0.093999
|
0.1513
|
-98.31371
|
0.0002*
|
|
R-square
|
0.921477
|
|
0.901359
|
|
0.893899
|
|
Adjusted R-square
|
0.895058
|
|
0.868172
|
|
0.858201
|
|
F-statistic
|
34.87952
|
|
27.15954
|
|
25.04089
|
|
F-probability
|
0.000000
|
|
0.000000
|
|
0.000000
|
|
Durbin-Watson
|
1.989920
|
|
1.935948
|
|
2.033728
|
(*= Significant at 5 percent, **= Significant at 10 percent level of significance)
The table given above depicted that all the three models are overall fit because value of F-statistic is 34.87952 which is highly significant at 5 per cent level of significance. There is no problem of autocorrelation as the value of Durbin-Watson statistic is close to 2. The empirical results from the model depicted that Promoters’ Shareholding is positively and significantly related with the earning per share where as Foreign Institutional Shareholding is positively and significantly related with Return on Assets and Return on Equity. Board size has a negative relation with return on assets and return on equity and this relationship is significant. Percentage of independent directors is positively related with Return on equity but negatively related with Earning per Share. But percentage of directors having board interlocking is negatively related with Earning per Share and Return on Assets and this relationship is significant. Average directorship is negatively related to the earning per share and return on equity and this relationship is significant. The growth rate of average remuneration of executive directors is negatively related with the Return on Assets and the relationship is also significant. Sales and firms’ size have a positive relation with the earnings per share and age has a significant negative relation with Earnings per share.
After fitting regression models, it is necessary to check the other two conditions of a good regression model. These are: Normality of residuals and Constant variance of residuals means presence of Homoskedasticity.
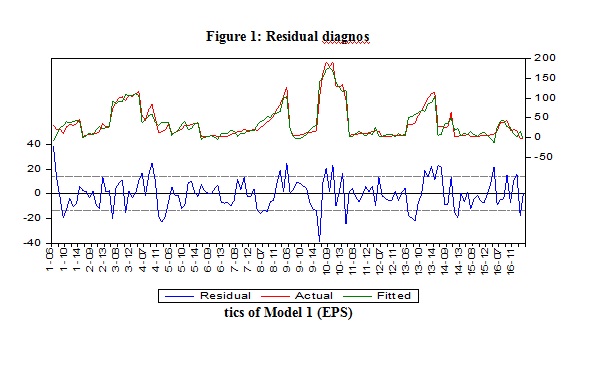
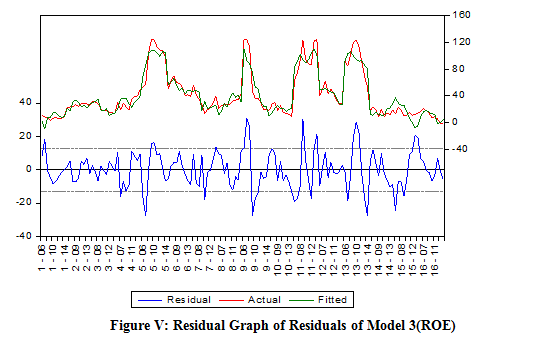
Residual graph of Model 1(EPS), Model 2(ROE) and Model 3(ROA) are presented in the Figure I, Figure III and Figure V respectively. The normality of residuals of Model 1(EPS), Model 2(ROE) and Model 3(ROA) are presented in the Figure II, Figure IV and Figure VI respectively.
Residual diagnostics of Model 1(EPS):
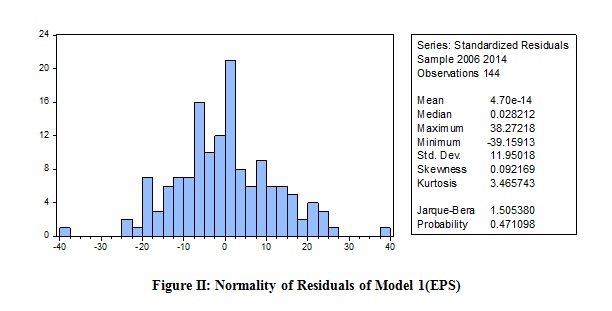
It is revealed from the above figure that Jarque-Bera probability is greater than five percent.
So, null hypothesis of normality is accepted over here.
Residual diagnostics of Model 2 (ROA):
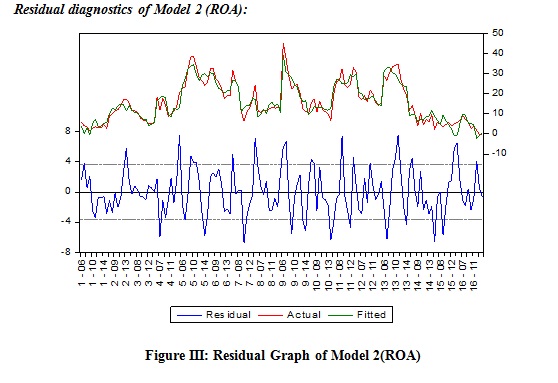
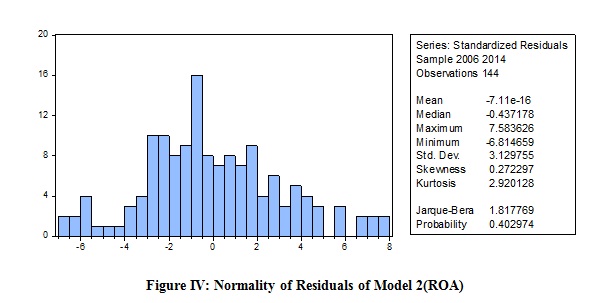
It is revealed from the above figure that Jarque-Bera probability is greater than five percent.
So, null hypothesis of normality is accepted over here.
Residual diagnostics of Model 3(ROE)
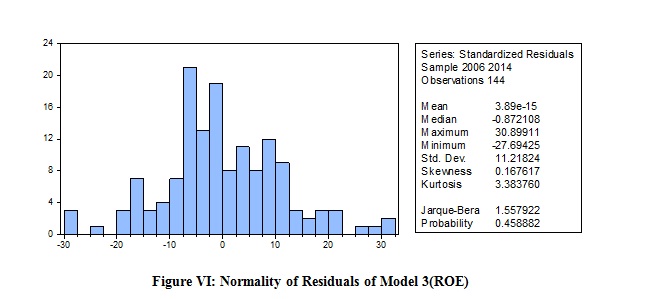
It is revealed from the above figure that Jarque-Bera probability is greater than five percent.
So, null hypothesis of normality is accepted over here.
Heteroskedasticity Test:
In order to check the constant variance in residuals White test of Homoskedasticity was applied and test gave the following results for all the three models:
Model 1(EPS)
White's test Ho: Homoskedasticity; against Ha: Unrestricted Heteroskedasticity
chi2 (104) = 127.98, Prob. > chi2 = 0.0553
Model 1(ROA)
White's test Ho: Homoskedasticity; against Ha: Unrestricted Heteroskedasticity
chi2 (104) =127.50, Prob. > chi2 = 0.0587
Model 1(ROE)
White's test Ho: Homoskedasticity; against Ha: Unrestricted Heteroskedasticity
chi2 (104) = 126.39, Prob. > chi2 = 0.0641
The above test results revealed that null hypothesis of constant variance is accepted here and favoured homoskedasticity.
Conclusion:
This paper discusses the developments in research with regard to corporate governance through an extensive review of literature which emerged across various nations around the globe, filtering it to specific sector i.e. consumer goods sector and then especially in context of India. The empirical results depicted that Promoters’ Shareholding is positively and significantly related with the Earning per share where as Foreign Institutional Shareholding is positively and significantly related with Return on Assets and Return on Equity. Board size has a negative relation with Return on Assets and Return on Equity and this relationship is significant. Percentage of independent directors is positively related with Return on equity but negatively related with Earning per Share. But percentage of directors having board interlocking is negatively related with Earning per Share and Return on Assets and this relationship is significant. Average directorship is negatively related to the earning per share and return on equity and this relationship is significant. The growth rate of average remuneration of executive directors is negatively related with the Return on Assets and the relationship is also significant. Sales and firms’ size have a positive relation with the earnings per share and age has a significant negative relation with Earnings per share.
So, it is suggested that firms in consumer goods sector should increase the promoters’ shareholding and foreign institutional shareholding as both of them has positive linkages with the firm’s financial performance. on the other hand, firms should reduce their board size and try to include those directors in the board who does not have board interlocking as board size and board interlocking has negative impact on the financial performance of the firms under study. Large size of board can face the problems of co-ordination, communication and decision-making. Large boards give excessive control to the CEO, harm efficiency (Yermack, 1996; Eisenberg et al., 1998; Fernandez et al., 1997; Wang, W. K. et al (2012). The board interlocking impaired the firms’ performance because of busy board not performing their monitoring task effectively as revealed by Fich & White (2005).
References:
Abdullah, S. N. (2006). Director’s remuneration, firm’s performance and corporate governance in Malaysia among distressed companies. Corporate Governance, 6(2), 162-174.
Al-Saidi, M. and Al-Shammari, B. (2013). Board composition and bank performance in Kuwait. Managerial Auditing Journal, 28(6), 472-494.
Andres, P. D. and Vallelado, E. (2008). Corporate Governance in banking: The role of the board of directors. Journal of Banking and Finance, 32, 2570-2580.
Arouri, H., Hossain, M. & Muttakin, M. B. (2014). Effects of boards and Ownership structures on corporate performance: Evidence from GCC countries. Journal of Accounting in Emerging Economies, 4 (1), 117-130.
Berthelot, S., Francoeur, C. and Labelle, R. (2012). Corporate governance mechanisms, accounting results and stock valuation in Canada. International Journal of Managerial Finance, 8(4), 332-343.
Brooks, C. (2008). Introductory Econometrics for Finance. Second Edition, Cambridge University Press.
Bryman, A. and Cramer, D. (1997). Quantitative Data Analysis with SPSS for Windows.
Coles, J. L., Daniel, N. D. and Naveen, L. (2008). Boards: Does one size fits all? Journal of Financial Economics, 8(2), 329-56.
Dwivedi, N. and Jain, A. K. (2005). Corporate governance and performance of Indian firms: the effect of board size and ownership. Employee Responsibilities and Rights Journal, 17(3), 161-172.
Ehikioya, B. I. (2009). Corporate governance structure and firm performance in developing economies: evidence from Nigeria. Corporate Governance, 9(3), 231-43.
Eisenberg, T., Sundgren, S. and Wells, M. T., (1998). Larger Board size and decreasing firm value in small firms. Journal of Financial Economics. 48, 35-54.
Felton, R. F. and Watson, M. (2002). Change across the Board. McKinsey Quarterly, 4, 31-46.
Fernandez, A. I., Gomez, S. and Fernandez, C., (1997). The effect of board size and composition on corporate performance. In: Ballin M. (Ed.). Corporate governance, financial markets and Global governance. Kluwer Academic Publishers, Boston.
Fich, E. and White, L. (2005). Why do CEOs reciprocally sit on each other’s boards? Journal of Corporate Finance, 11, 175-195.
Field, A. (2005). Discovering Statistics using SPSS. SAGE Publications. 6th Edition.
Filatotchev, I., Lien, Y. C., & Piesse, J. (2005). Corporate Governance and Performance in Publicly Listed, Family-Controlled Firms: Evidence from Taiwan. Asia Pacific Journal of Management, 22, 257-283.
Filatotchev, I., Lien, Y. C., and Piesse, J. (2005). Corporate Governance and Performance in Publicly Listed, Family-Controlled Firms: Evidence from Taiwan. Asia Pacific Journal of Management, 22, 257-283.
Firth, M., Fung, P. M. Y. and Rui, O. M. (2007). How ownership and corporate governance influence chief executive pay in China’s listed firms. Journal of Business Research, 60(7), 776-775.
Guo, Z., Kumara, U. (2012). Corporate Governance and Firm Performance of Listed firms in Sri Lanka. Procedia-Social and Behavioural Sciences, 40, 664-667.
Kato, T. and Kubo, K. (2006). CEO compensation and firm performance in Japan: Evidence from new panel data on Individual CEO Pay. Journal of the Japanese and International Economics, 20, 1-19.
Kato, T., Kim, W. and Lee, J. H. (2007). Executive compensation, firm performance and chaebols in Korea: Evidence from new panel data. Pacific- Basin Financial Journal, 15, 36-55.
Kennedy, P. (1985). A Guide to Econometrics. 2nd Edition, The MIT Press, Cambridge, MA.
Kozhan, R. (2010). Financial Econometrics with E-views. Roman Kojhan & Ventus Publishing.
Kumar, N. and Singh, J. P. (2013). Effect of board size and promoter ownership on firm value: some empirical findings from India. Corporate Governance, 13(1), 88-98.
Lee, K. W., Lev, b. and Yeo, G. H. (2008). Executive pay dispersion, corporate governance, and firm performance. Review of Quantitative Finance and Accounting, 30, 315-338.
Mashayekhi, B. and Bazaz, M.S. (2008), “Corporate governance and firm performance in Iran”, Journal of Contemporary Accounting & Economics, Vol. 4 No. 2, pp. 156-72.
Mishra, S. and Mohanty, P. (2014). Corporate governance as a value driver for firm performance: evidence from India. Corporate Governance, 14(2), 265-280.
Newell, R. and Wilson, G. (2002). A Premium for Good Governance. McKinsey Quarterly, 20-23.
Nyamongo, E. M. and Temesgen K. (2013). The effect of governance on performance of Commercial banks in Kenya: a panel study. Corporate Governance, 13(2), 236-248.
O’Connell, V. and Cramer, N. (2010). The relationship between firm performance and Board Characteristics in Ireland. European Management Journal, 28, 387-399.
Omran, M. (2009). Post-privatization corporate governance and firm performance: the role of private ownership concentration, identity and board composition. Journal of Comparative Economics, 37, 658-673.
Patibandla, M. (2006). Equity pattern, corporate governance and performance: A study of India’s corporate sector. Journal of Economic Behaviour and Organisation, 59, 29-44.
Pombo, C. and Gutierrez, L. H. (2011). Outside directors, Board interlock and firm performance: empirical evidence from Colombian Business Groups. Journal of Economics and Business, 63, 251-277.
Sheikh, N. H., Wang, Z. and Khan, S. (2013). The impact of internal attributes of corporate governance on firm performance Evidence from Pakistan. International Journal of Commerce and Management, 23(1), 38-55.
Stefdnescu, C. A. (2011). Do Corporate governance Actors features affect bank’s value?-Evidence from Romania. Procedia Social and Behavioural Sciences, 24, 1311-1321.
Tabachnick, B.G. and Fidell, L.S. (1996). Using Multivariate Statistics, HarperCollins, New York, NY.
Ujunwa, A. (2012). Board characteristics and the financial performance of Nigerian quoted firms. Corporate Governance, 12(5), 656-674.
Wang, W. K., Lu, W. M., & Lin, Y. L. (2012). Does corporate governance play an important role in BHC performance? Evidence from the U.S. Economic Modelling, 29, 751-760.
Ward, J. L. (1991). Creating Effective Boards for Private Enterprises. San Francisco, CA: Jossey-Bass Publishers.
www.bseindia.com
Yermack, D., (1996). Higher market valuation of companies with a small board of directors. Journal of Financial Economics, 40, 185-211.
Annexure 1
List of Sample Firms
|
Sr. No.
|
Scrip Code
|
Scrip Name
|
|
1
|
500043
|
Bata India Ltd.
|
|
2
|
500049
|
Bharat Electronics
|
|
3
|
500825
|
Britannia Industries Ltd.
|
|
4
|
500830
|
Colgate-Palmolive (India) Ltd.
|
|
5
|
500096
|
Dabur India Ltd.
|
|
6
|
531162
|
Emami Ltd.
|
|
7
|
500676
|
Glaxosmithkline Consumer Healthcare Ltd.
|
|
8
|
532424
|
Godrej Consumer Products Ltd.
|
|
9
|
517354
|
Havells India Ltd.
|
|
10
|
500696
|
Hindustan Unilever Ltd.
|
|
11
|
531642
|
Marico Ltd.
|
|
12
|
500790
|
Nestle India Ltd.
|
|
13
|
500800
|
Tata Global Beverages Ltd.
|
|
14
|
532432
|
United Spirits Ltd.
|
|
15
|
511389
|
Videocon Industries Ltd.
|
|
16
|
500575
|
Voltas Ltd.
|
(Source: www.bseindia.com retrieved on 16th Oct, 2014)

